 Catalogue PIGMA
/Salinity
Type of resources
Topics
Keywords
Contact for the resource
Provided by
Years
Formats
Representation types
status
Scale
Resolution
-
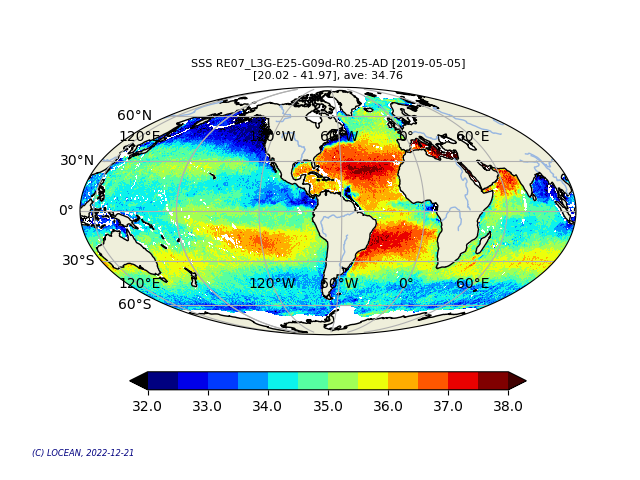
This product contains daily salinity fields from a 9 days temporal gaussian average, corrected from land-sea contamination and latitudinal bias, based on L2Q products, mixing ascending and descending orbits. The base products, for all the CATDS-PDC (Centre Aval de Traitement des Données SMOS - Production & Dissemination Center) processing chains, are the SMOS L1B products from ESA (European Space Agency). From these, brightness temperatures at various incidence angles are reconstructed. The Sea Surface Salinity (SSS) are retrieved from multi-angular brightness temperatures through a maximum likehood Bayesian approach in which measured Tb and Tb simulated using a forward direct model are compared (see Zine et al. 2008 for a general description of the retrieval method, and pro_con table for a summary of the similarities/differences with respect to ESA level 2 ocean salinity processing). Products from reprocessing RE07 are available for the period 02/2010 - 05/2021. Products from operational (OPER) processing are available since 06/2021. Reprocessed products and operational products are derived using the same algorithm and configuration, hence ensuring the temporal continuity.
-
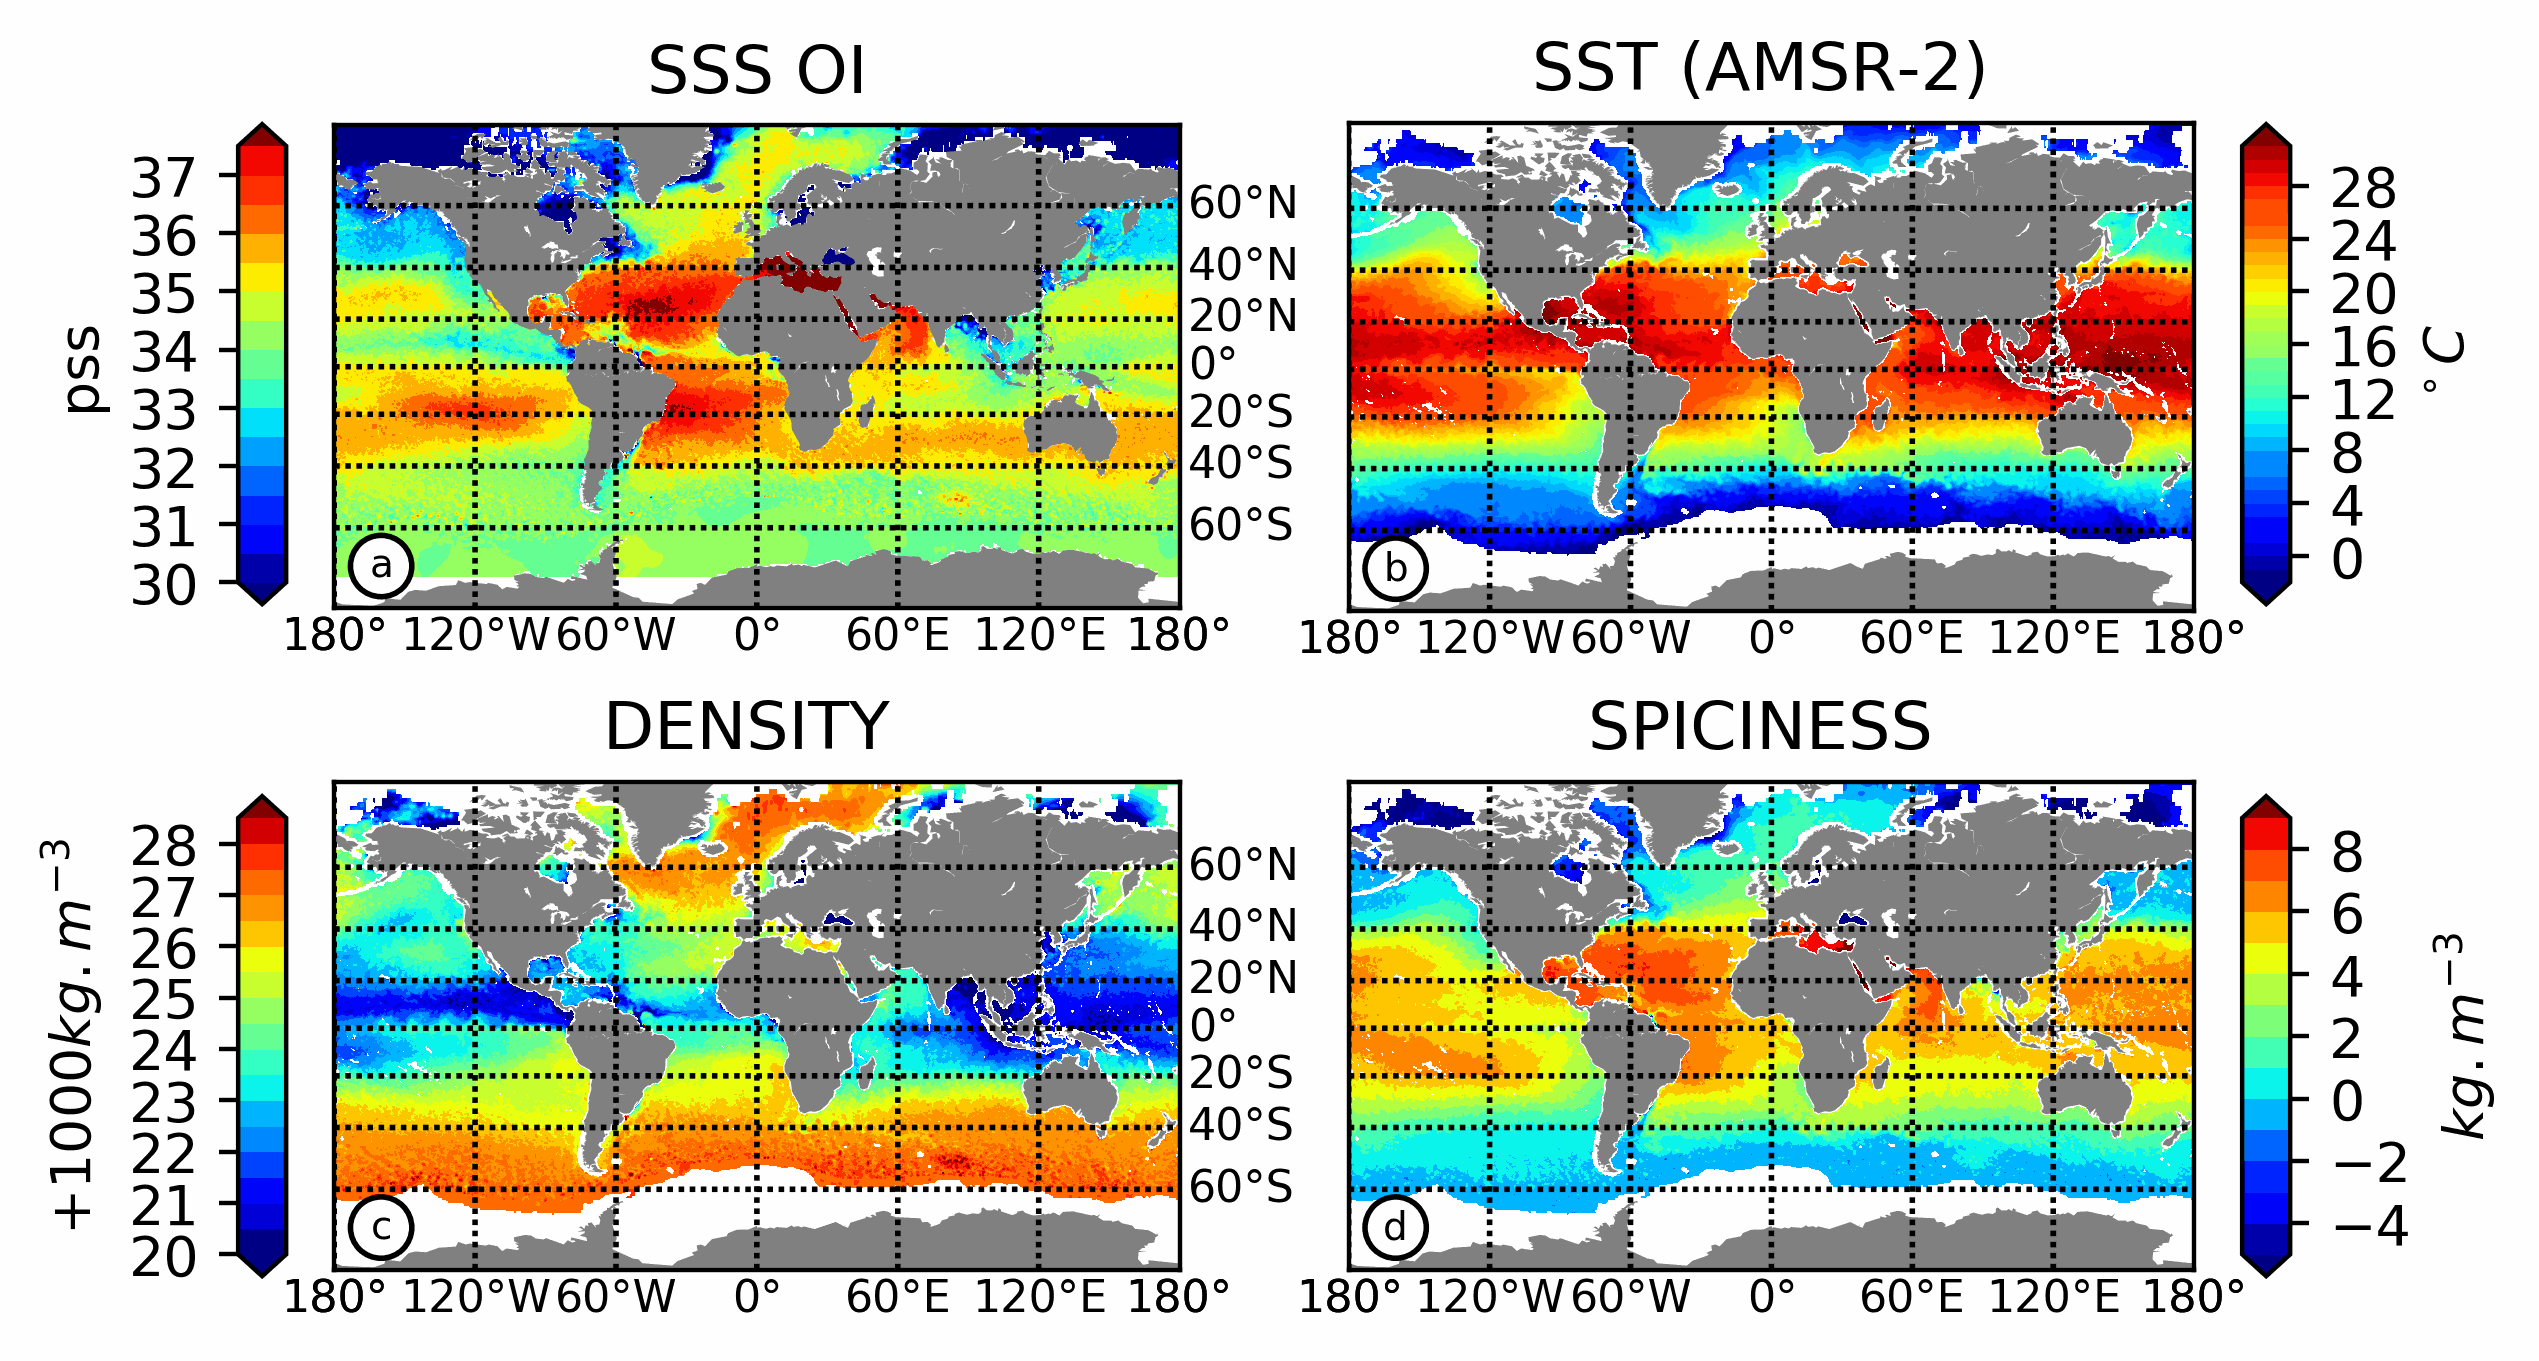
This product contains weekly salinity field, based on SMOS satellite data, and ISAS (In-Situ Analysis System). The L4OS SMOS-OI product contains global Level 4 analyses of the of the Sea Surface Salinity (SSS), Sea Surface Density (SSD) and Sea Surface Spiciness (SSSp), along with Sea Surface Absolute Salinity (SSA), Conservative Temperature (SCT), surface thermal expansion coefficient (alpha) and haline contraction coefficient (beta). The SSS product is obtained using an optimal interpolation (OI) algorithm, that combines ISAS in situ SSS OI analyses and Soil Moisture Ocean Salinity (SMOS) satellite image to reduce large scale and temporally varying bias. The SSS L4 product outcome is then combined with satellite SST products to compute thermodynamic sea water parameters using TEOS-10 (Kolodziejczyk et al., 2021). Products from reprocessing RE07 are available for the period 01/2011 - 05/2021. Products from operational (OPER) processing are available since 06/2021. Reprocessed products and operational products are derived using the same algorithm and configuration, hence ensuring the temporal continuity. The base products, for all the CATDS-PDC (Centre Aval de Traitement des Données SMOS - Production & Dissemination Center) processing chains, are the SMOS L1B products from ESA (European Space Agency). From these, brightness temperatures at various incidence angles are reconstructed. The Sea Surface Salinity (SSS) are retrieved from multi-angular brightness temperatures through a maximum likehood Bayesian approach in which measured Tb and Tb simulated using a forward direct model are compared (see Zine et al. 2008 for a general description of the retrieval method, and pro_con table for a summary of the similarities/differences with respect to ESA level 2 ocean salinity processing).
-
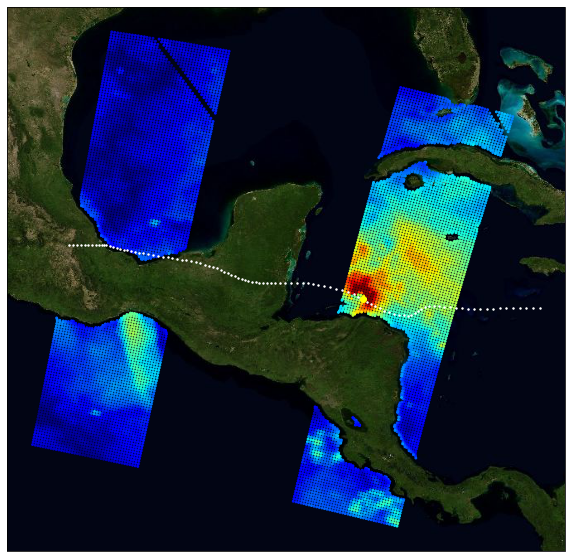
The primary objective of the ESA Marine Atmosphere eXtreme Satellite Synergy (MAXSS) project is to provide guidance and innovative methodologies to maximize the synergetic use of available Earth Observation data (satellite, in situ) to improve understanding about the multi-scale dynamical characteristics of extreme air-sea interaction. This dataset, produced in the frame of MAXSS project, provides multi-variate observations for Arctic polar lows (PL), for a selection of storm tracks extracted from Rojo et al (2019) during the period 2010-2018. The observations are taken from more than 35 satellite, numerical model and in situ sources, providing the inner and surface ocean conditions for a comprehensive range of parameters (sea surface height, surface winds, waves, precipitation, temperature, salinity, ocean colour, ...) before, during and after the storm passage. Different colocation radii and time windows are used depending on the parameter and observation dataset. The assembled data are stored in a standardized NetCDF4 file format and organised per basin, year, and storm name to ease data manipulation for users that are not used to work with this wealth of data.