 Catalogue PIGMA
NetCDF
Type of resources
Available actions
Topics
Keywords
Contact for the resource
Provided by
Years
Formats
Representation types
Update frequencies
status
Scale
Resolution
-

This product contains daily salinity fields over Arctic from a 9 days temporal gaussian average, corrected from land-sea contamination and latitudinal bias, based on L2Q over Arctic products, mixing ascending and descending orbits.
-
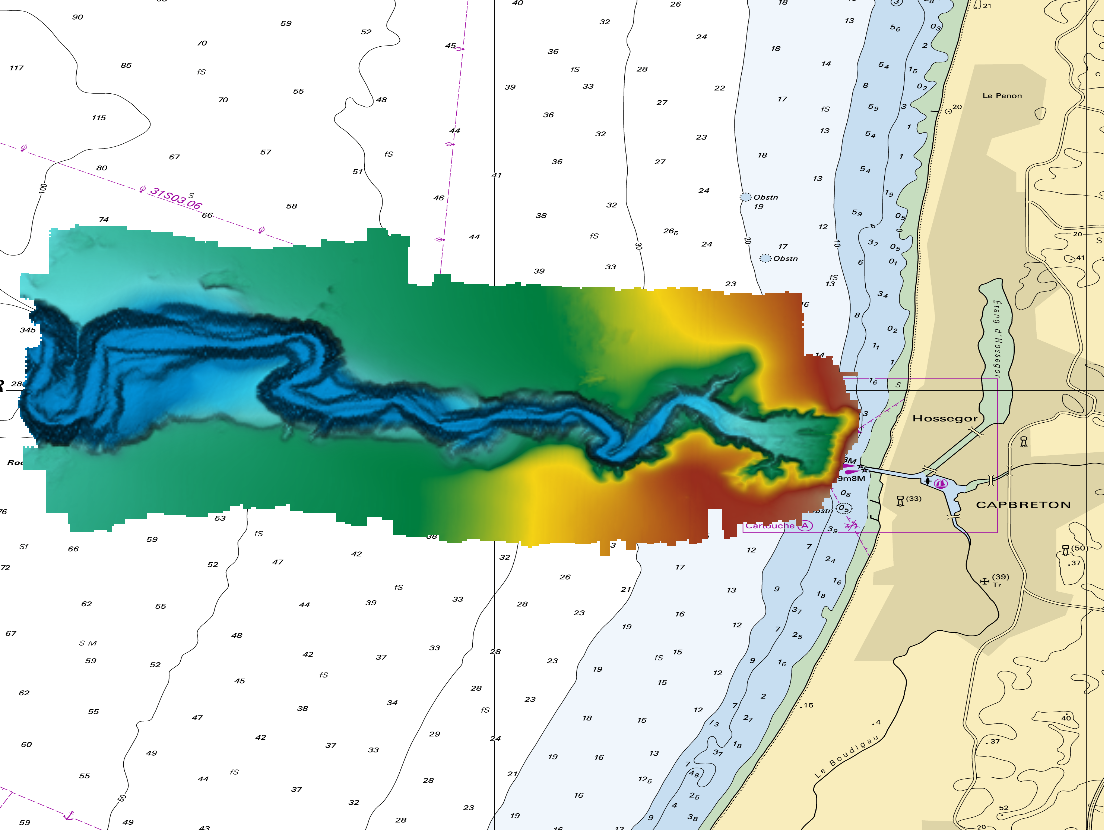
The DTM is a compilation of multibeam echosounder surveys acquired in 2013. The resolution is 1/64 arc-minutes (~30m). Surveys are located on the Capbreton Submarine Canyon (France) with depths from -4.7m to -344.9m. Depths are referenced to the Lowest Astronomical Tide and the coordinates are expressed into the WGS84 reference frame. The surveys which compose the DTM are S201306500-09 and S201306500-11. Data and metadata associated to these surveys are available on the website http://diffusion.shom.fr/pro/lots-bathy.html. The DTM is not to be used for navigation.
-

These gridded products are produced from the following upstream data: - for satellites SARAL/AltiKa, Cryosat-2, HaiYang-2B, Jason-3, Copernicus Sentinel-3A/B, Sentinel-6 MF, SWOT Nadir => NRT (Near-Real-Time) Nadir along-track (or Level-3) SEA LEVEL products (DOI: https://doi.org/10.48670/moi-00147) delivered by the Copernicus Marine Service (http://marine.copernicus.eu/ ). The gridded product is based on near-real-time (NRT) Level-3 Nadir datasets for the period from July 7, 2025, to December 31, 2025. => MY (Multi-Year) Nadir along-track (or Level-3) SEA LEVEL products (DOI: https://doi.org/10.48670/moi-00146 ) delivered by the Copernicus Marine Service (CMEMS, http://marine.copernicus.eu/ ). The gridded product is based on MY Level-3 Nadir datasets for the period from March 28, 2023, to July 6, 2025. - for SWOT KaRIn : the L3_LR_SSH Expert v3.0 product distributed by AVISO (DOI: https://doi.org/10.24400/527896/A01-2023.018) from March 28, 2023 to December 31, 2025. One mapping algorithm is proposed: the MIOST approach which provides which provides global Sea Surface Height (SSH) solutions. The MIOST method is capable of accounting for various modes of ocean surface topography variability (e.g., geostrophic, barotropic, equatorial wave dynamics) by constructing multiple independent components within a predefined covariance model.
-

The Sentinel-6 Level-2P skewness products was developed to estimate the skewness from Sentinel-6 LR (Low Resolution Mode) and HR (High Resolution Mode) acquisitions. That demonstration product is generated by different retracking processes, provides an initial estimation of such a phenomenon and allows a finer description of the sea state.
-
-
-

The SWOT KaRIn Level-3 Wind Wave product (L3_LR_WIND_WAVE) is an innovative product derived from the Unsmoothed L3_LR_SSH product (DOI: 10.24400/527896/A01-2024.003), which is based on the algorithm presented by Ardhuin et al. (2024). L3_LR_WIND_WAVE takes advantage of the KaRIn Low Rate (LR) chain's ability to resolve waves with wavelengths greater than 500 meters (approximately 18 seconds) and provides detailed information on the characteristics of these wave regimes. This includes significant wave height (SWH), dominant wavelength, and wave propagation direction. These regimes are associated with long-period swells and extreme events that play a critical role in ocean dynamics, coastal processes, and maritime operations. The SWOT L3_LR_WIND_WAVE product is organized into two subproducts, "Light" and "Extended". The L2_LR_SSH "Light" product is described in this metadata sheet. The "Light" L3_LR_WIND_WAVE (also known as the "lightweight" product) includes the SWOT L3_LR_SSH 250-m SSHA spectrum, corrected for instrumental effects and expressed in both Cartesian and polar coordinates. It also includes the swell partition of the spectrum and the wave parameters integrated over this partition, for both the WW3 model and the KaRIn model (significant wave height, wavelength, and direction). The "Extended" L3_LR_WIND_WAVE includes the aforementioned variables plus the WW3 spectrum in the same frequency grid as the KaRIn spectrum and the KaRIn transfer functions used for correction, as well as some parameters derived from KaRIn observations (e.g., coherence, mean backscatter).
-
These products contain global near real time (NRT) Level 2P skin Sea Surface Temperature (SST) derived from SLSTR-A on Copernicus Sentinel-3 at full-resolution swath (1 km at nadir) in GHRSST compliant NetCDF format. All SSTs from the Sea and Land Surface Temperature Radiometer (SLSTR) series of instruments are SST skin measurements. For more details please see “What is SST?” on the GHRSST web pages. At night, the skin temperature is typically a few tenths of a degree cooler than the temperature measured by in situ systems; in the day, the skin can be considerably higher if strong diurnal warming is present. The SLSTRs are dual-view self-calibrating radiometers with SST retrieved from spectral bands at nominally 3.74, 10.85 and 12 µm (referred to as S7, S8 & S9). Corrections for water vapour atmospheric absorption are performed using a triple window at night, and a split window during the day as the 3.7 µm channel is not used due to solar contamination. All pixels in the dual-view part of the swath are viewed twice, via nadir and oblique views with different atmospheric path lengths, allowing for correction for aerosol effects. Consequently, there are four possible retrieved SSTs, referred to as N2 (nadir-only 11 µm and 12 µm), N3 (nadir-only 3.7 µm, 11 µm and 12 µm), D2 (dual-view 11 µm and 12 µm) and D3 (dual-view 3.7 µm, 11 µm and 12 µm). The L2P file contains the best SST available for each pixel and flags are included to identify which retrieval is used. If the observation is in the nadir-only / single-view part of swath then "sst_algorithm_types" is N2 or N3, and if the observation is in the dual-view part of swath then "sst_algorithm_types" is D2 or D3. For D2 or D3 pixels it is possible to generate their N2 or N3 equivalent by subtracting the value in the "dual_nadir_sst_difference" field. Users are advised to use only QL = 5 dual-view SSTs for reference sensor applications and to use single-view (all quality levels) and quality level 3 and 4 dual-view data only for other qualitative analysis. Users are reminded to apply the SSES bias adjustments as SLSTR-B is harmonised to SLSTR-A through SSES. Users can consider using the "theoretical_uncertainty" for weighting observations rather than the simple SSES standard deviation values. Primary access to data is via the EUMETSAT Data Store (linked below). Other access methods can be found in the EUMETSAT Product Navigator https://navigator.eumetsat.int/product/EO:EUM:DAT:SENTINEL-3:SL_2_WST___NRT?query=slstr&results=22&s=advanced. Please also read the EUMETSAT SLSTR Product Notices (linked below) as they provide a lot of useful information. All products currently contain SLSTRA-MAR-L2P-v1.0 as the GHRSST Collection ID in the file metadata, which will be revised in a future release.
-

-
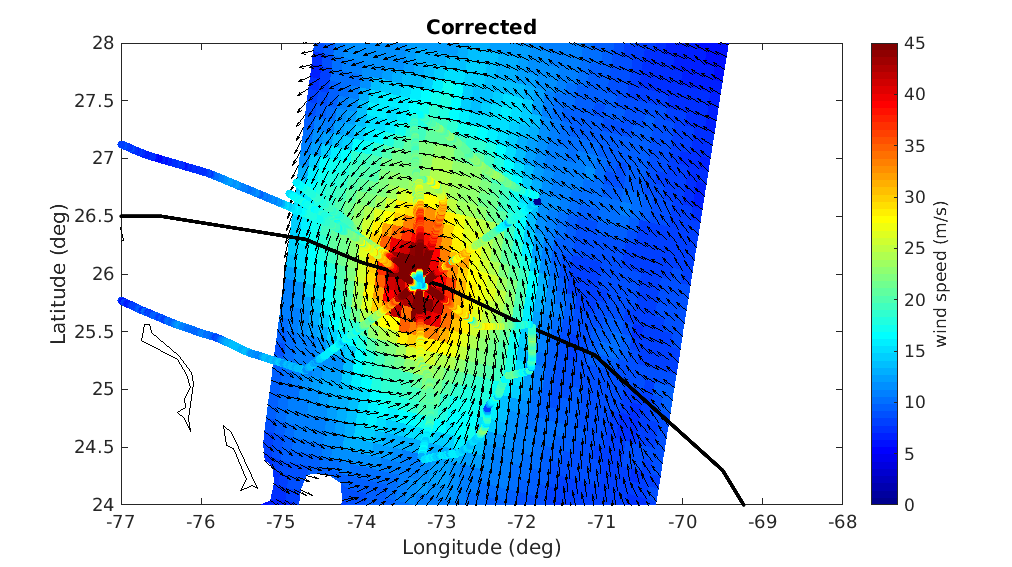
A prerequisite for a successful development of a multi-mission wind dataset is to ensure good inter-calibration of the different extreme wind datasets to be integrated in the product. Since the operational hurricane community is working with the in-situ dropsondes as wind speed reference, which are in turn used to calibrate the NOAA Hurricane Hunter Stepped Frequency Microwave Radiometer (SFMR) wind data, MAXSS has used the latter to ensure extreme-wind inter-calibration among the following scatterometer and radiometer systems: the Advanced Scatterometers onboard the Metop series (i.e., ASCAT-A, -B, and -C), the scatterometers onboard Oceansat-2 (OSCAT) and ScatSat-1 (OSCAT-2), and onboard the HY-2 series (HSCAT-A, -B); the Advanced Microwave Scanning Radiometer 2 onboard GCOM-W1(AMSR-2), the multi-frequency polarimetric radiometer (Windsat), and the L-band radiometers onboard the Soil Moisture and Ocean Salinity (SMOS) and the Soil Moisture Active Passive (SMAP) missions. In summary, a two-step strategy has been followed to adjust the high and extreme wind speeds derived from the mentioned scatterometer and radiometer systems, available in the period 2009-2020. First, the C-band ASCATs have been adjusted against collocated storm-motion centric SFMR wind data. Then, both SFMR winds and ASCAT adjusted winds have been used to adjust all the other satellite wind systems. In doing so, a good inter-calibration between all the systems is ensured not only under tropical cyclone (TC) conditions, but also elsewhere. This dataset was produced in the frame of the ESA funded Marine Atmosphere eXtreme Satellite Synergy (MAXSS) project. The primary objective of the ESA Marine Atmosphere eXtreme Satellite Synergy (MAXSS) project is to provide guidance and innovative methodologies to maximize the synergetic use of available Earth Observation data (satellite, in situ) to improve understanding about the multi-scale dynamical characteristics of extreme air-sea interaction.