 Catalogue PIGMA
Type of resources
Available actions
Topics
Keywords
Contact for the resource
Provided by
Years
Formats
Representation types
Update frequencies
status
Service types
Scale
Resolution
-
Ammonium and ammonia concentration parameters in water bodies | Concentration of ammonia | IFREMER |

-

'''Short description:''' Global Ocean- in-situ Near Real time Carbon observations. The In Situ Thematic Assembly Centre (INS TAC) integrates near real-time in situ observation data. This Near-Real Time product contains observations of temperature, salinity and fugacity of carbon dioxide from the surface ocean. These data are collected from ICOS Ocean Thematic Centre (https://otc.icos-cp.eu/home) operational stations, using Standard Operating Procedures for the ocean carbon community. The data are quality controlled using the software QuinCe, which provides automatic Quality Control in the form of range checks, constant value and excessive gradient detection. This product is updated with new observations at a maximum frequency of once a day, depending on the connection capabilities of the platform.
-
Annual time series of Total Nitrogen/Nitrates [mg/l] from in situ and model data
-
-
Auteur(s): Buron Anne , Projet d'un équipement culturel dans les îlots des écluses 'Lesieur Céréol' et de l'îlot 'Tête de pont' dans le secteur des bassins à flots de Bordeaux.
-
This product displays the stations where anthracene has been measured and the values present in EMODnet Chemistry infrastructure are always below the limit of detection or quantification (LOD/LOQ), i.e quality values found in EMODnet validated dataset can be equal to 6 or Q. It is necessary to take into account that LOD/LOQ can change with time. These products aggregate data by station, producing only one final value for each station (above, below or above/below). EMODnet Chemistry has included the gathering of contaminants data since the beginning of the project in 2009. For the maps for EMODnet Chemistry Phase III, it was requested to plot data per matrix (water,sediment, biota), per biological entity and per chemical substance. The series of relevant map products have been developed according to the criteria D8C1 of the MSFD Directive, specifically focusing on the requirements under the new Commission Decision 2017/848 (17th May 2017). The Commission Decision points to relevant threshold values that are specified in the WFD, as well as relating how these contaminants should be expressed (units and matrix etc.) through the related Directives i.e. Priority substances for Water. EU EQS Directive does not fix any threshold values in sediments. On the contrary Regional Sea Conventions provide some of them, and these values have been taken into account for the development of the visualization products. To produce the maps the following process has been followed: 1. Data collection through SeaDataNet standards (CDI+ODV) 2. Harvesting, harmonization, validation and P01 code decomposition of data 3. SQL query on data sets from point 2 4. Production of map with each point representing at least one record that match the criteria The harmonization of all the data has been the most challenging task considering the heterogeneity of the data sources, sampling protocols. Preliminary processing were necessary to harmonize all the data : • For water: contaminants in the dissolved phase; • For sediment: data on total sediment (regardless of size class) or size class < 2000 μm • For biota: contaminant data will focus on molluscs, on fish (only in the muscle), and on crustaceans • Exclusion of data values equal to 0
-
-
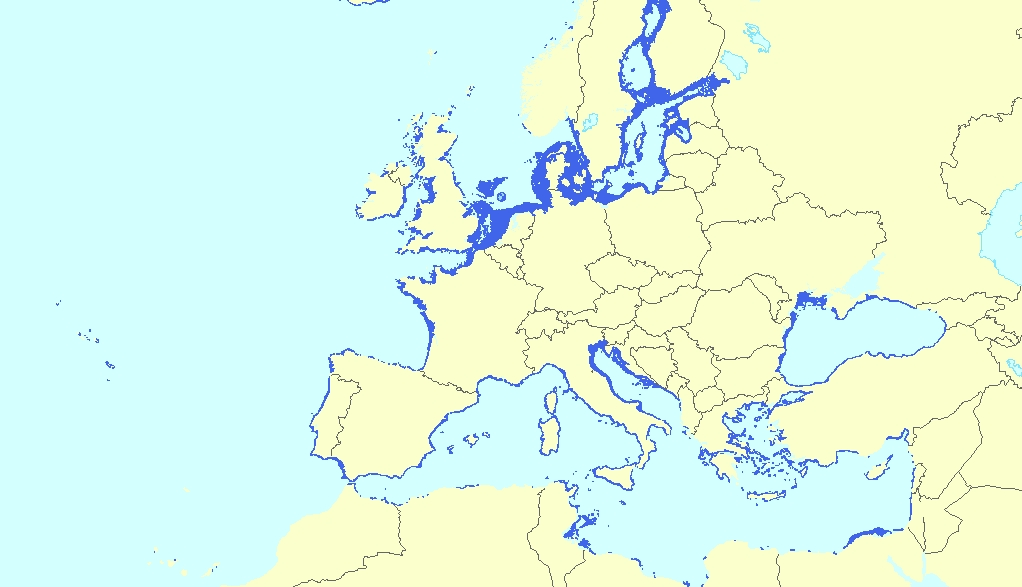
This vector dataset represents the benthic broad habitat types in Europe Seas potentially affected by the ship wakes. When navigating, the propellers of ships generate a turbulent mixing of the water that can produce sediment re-suspension in soft bottoms of shallow areas. This can increase the turbidity in those areas, affecting the seafloor organisms (especially those that are directly dependent on light, such as aquatic plants). It may also contribute to an increase of the the eutrophication level of the ecosystem (since the turbid waters may become warmer, which may turn into a reduction of dissolved oxygen in water). Finally, turbidity can produce an increase in the inputs of contaminants and microbial pathogens, since those can become attached to the suspended solids. The dataset has been prepared in the context of the development of the first European Maritime Transport Environmental Report (https://www.eea.europa.eu/publications/maritime-transport).
-

The CWP, supported by the participating organizations, serves as the premier international and interorganizational forum for agreeing common definitions, classifications and standards for the collection of fishery and aquaculture statistics. It has developed common procedures for statistics collation which have streamlined processes and reduced the burden on the statistical offices of national fisheries and aquaculture production, as well as providing technical advice to participating organizations on fishery-related and aquaculture-related statistical matters, and facilitating the publication of methodological and reference documents. The Coordinating Working Party on Fishery Statistics (CWP) provides a mechanism to coordinate the statistical programmes conducted by regional fishery bodies and other intergovernmental organizations with a remit for fishery statistics. Main function: - To continually review fishery statistics requirements for research, policy-making and management; - To agree on standard concepts, definitions, classifications and methodologies for the collection and collation of fishery statistics; - To submit proposals for the coordination and streamlining of statistical activities among the relevant intergovernmental organizations.
-
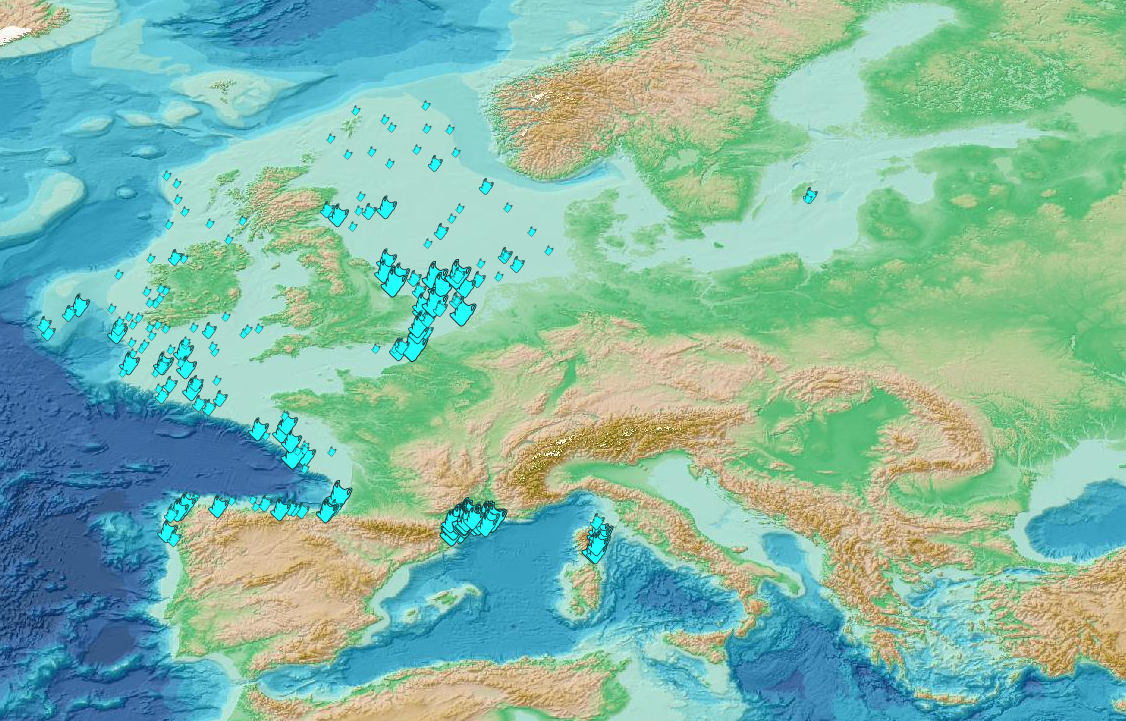
This visualization product displays plastic bags density per trawl. EMODnet Chemistry included the collection of marine litter in its 3rd phase. Since the beginning of 2018, data of seafloor litter collected by international fish-trawl surveys have been gathered and processed in the EMODnet Chemistry Marine Litter Database (MLDB). The harmonization of all the data has been the most challenging task considering the heterogeneity of the data sources, sampling protocols (OSPAR and MEDITS protocols) and reference lists used on a European scale. Moreover, within the same protocol, different gear types are deployed during fishing bottom trawl surveys. In cases where the wingspread and/or number of items were unknown, data could not be used because these fields are needed to calculate the density. Data collected before 2011 are affected by this filter. When the distance reported in the data was null, it was calculated from: - the ground speed and the haul duration using this formula: Distance (km) = Haul duration (h) * Ground speed (km/h); - the trawl coordinates if the ground speed and the haul duration were not filled in. The swept area is calculated from the wingspread (which depends on the fishing gear type) and the distance trawled: Swept area (km²) = Distance (km) * Wingspread (km) Densities have been calculated on each trawl and year using the following computation: Density of plastic bags (number of items per km²) = ∑Number of plastic bags related items / Swept area (km²) Percentiles 50, 75, 95 & 99 have been calculated taking into account data for all years. The list of selected items for this product is attached to this metadata. Information on data processing and calculation is detailed in the attached methodology document. Warning: the absence of data on the map doesn't necessarily mean that they don't exist, but that no information has been entered in the Marine Litter Database for this area.