 Catalogue PIGMA
Régent
Type of resources
Available actions
Topics
Keywords
Contact for the resource
Provided by
Years
Formats
-
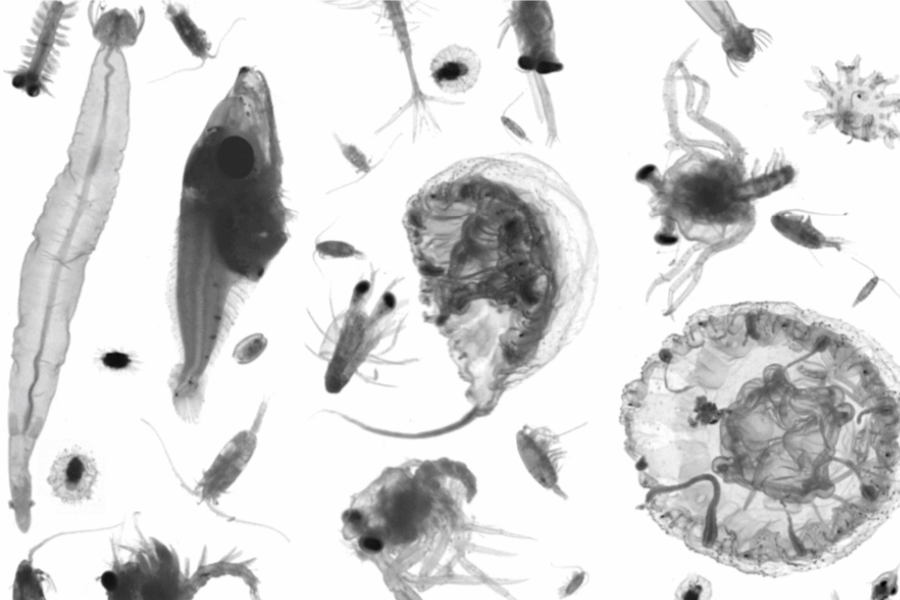
Plankton was sampled with various nets, from bottom or 500m depth to the surface, in many oceans of the world. Samples were imaged with a ZooScan. The full images were processed with ZooProcess which generated regions of interest (ROIs) around each individual object and a set of associated features measured on the object (see Gorsky et al 2010 for more information). The same objects were re-processed to compute features with the scikit-image toolbox http://scikit-image.org. The 1,451,745 resulting objects were sorted by a limited number of operators, following a common taxonomic guide, into 98 taxa, using the web application EcoTaxa http://ecotaxa.obs-vlfr.fr. For the purpose of training machine learning classifiers, the images in each class were split into training, validation, and test sets, with proportions 70%, 15% and 15%. The folder ZooScanNet_data.tar contains : taxa.csv.gz Table of the classification of each object in the dataset, with columns : - objid: unique object identifier in EcoTaxa (integer number) - taxon_level1: taxonomic name corresponding to the level 1 classification - lineage_level1: taxonomic lineage corresponding to the level 1 classification - taxon_level2: name of the taxon corresponding to the level 2 classification - plankton: if the object is a plankton or not (boolean) - set: class of the image corresponding to the taxon (train : training, val : validation, or test) - img_path: local path of the image corresponding to the taxon (of level 1), named according to the object id features_native.csv.gz Table of metadata of each object including the different features processed by ZooProcess. All features are computed on the object only, not the background. All area/length measures are in pixels. All grey levels are in encoded in 8 bits (0=black, 255=white). With columns: - objid: unique object identifier in EcoTaxa (integer number) And 48 features: - area - mean - stddev - mode - min/max - perim. - width,height - major,minor - circ. - feret - intden - median - skew,kurt - %area - area_exc - fractal - skelarea - slope - histcum1,2,3 - nb1,2,3 - symetrieh,symetriev - symetriehc,symetrievc - convperim,convarea - fcons - thickr: - esd - elongation - range - centroids - sr - perimareaexc - feretareaexc - perimferet/perimmajor - circex - cdexc See the “ZooScan” sheet - OBJECT metadata, annotation and measurements - , at https://doi.org/10.5281/zenodo.14704250 for definitions. features_skimage.csv.gz Table of morphological features recomputed with skimage.measure.regionprops on the ROIs produced by ZooProcess. See http://scikit-image.org/docs/dev/api/skimage.measure.html#skimage.measure.regionprops for documentation. inventory.tsv Tree view of the taxonomy and number of images in each taxon, displayed as text. With columns : - lineage_level1: taxonomic lineage corresponding to the level 1 classification - taxon_level1: name of the taxon corresponding to the level 1 classification - n: number of objects in each taxon class 2. Second folder ZooScanNet_imgs.tar contains : imgs Directory containing images of each object, named according to the object id objid and sorted in subdirectories according to their taxon. 3. And : map.png Map of the sampling locations, to give an idea of the diversity sampled in this dataset.