 Catalogue PIGMA
2025
Type of resources
Available actions
Topics
Keywords
Contact for the resource
Provided by
Years
Formats
Representation types
Update frequencies
status
Scale
Resolution
-
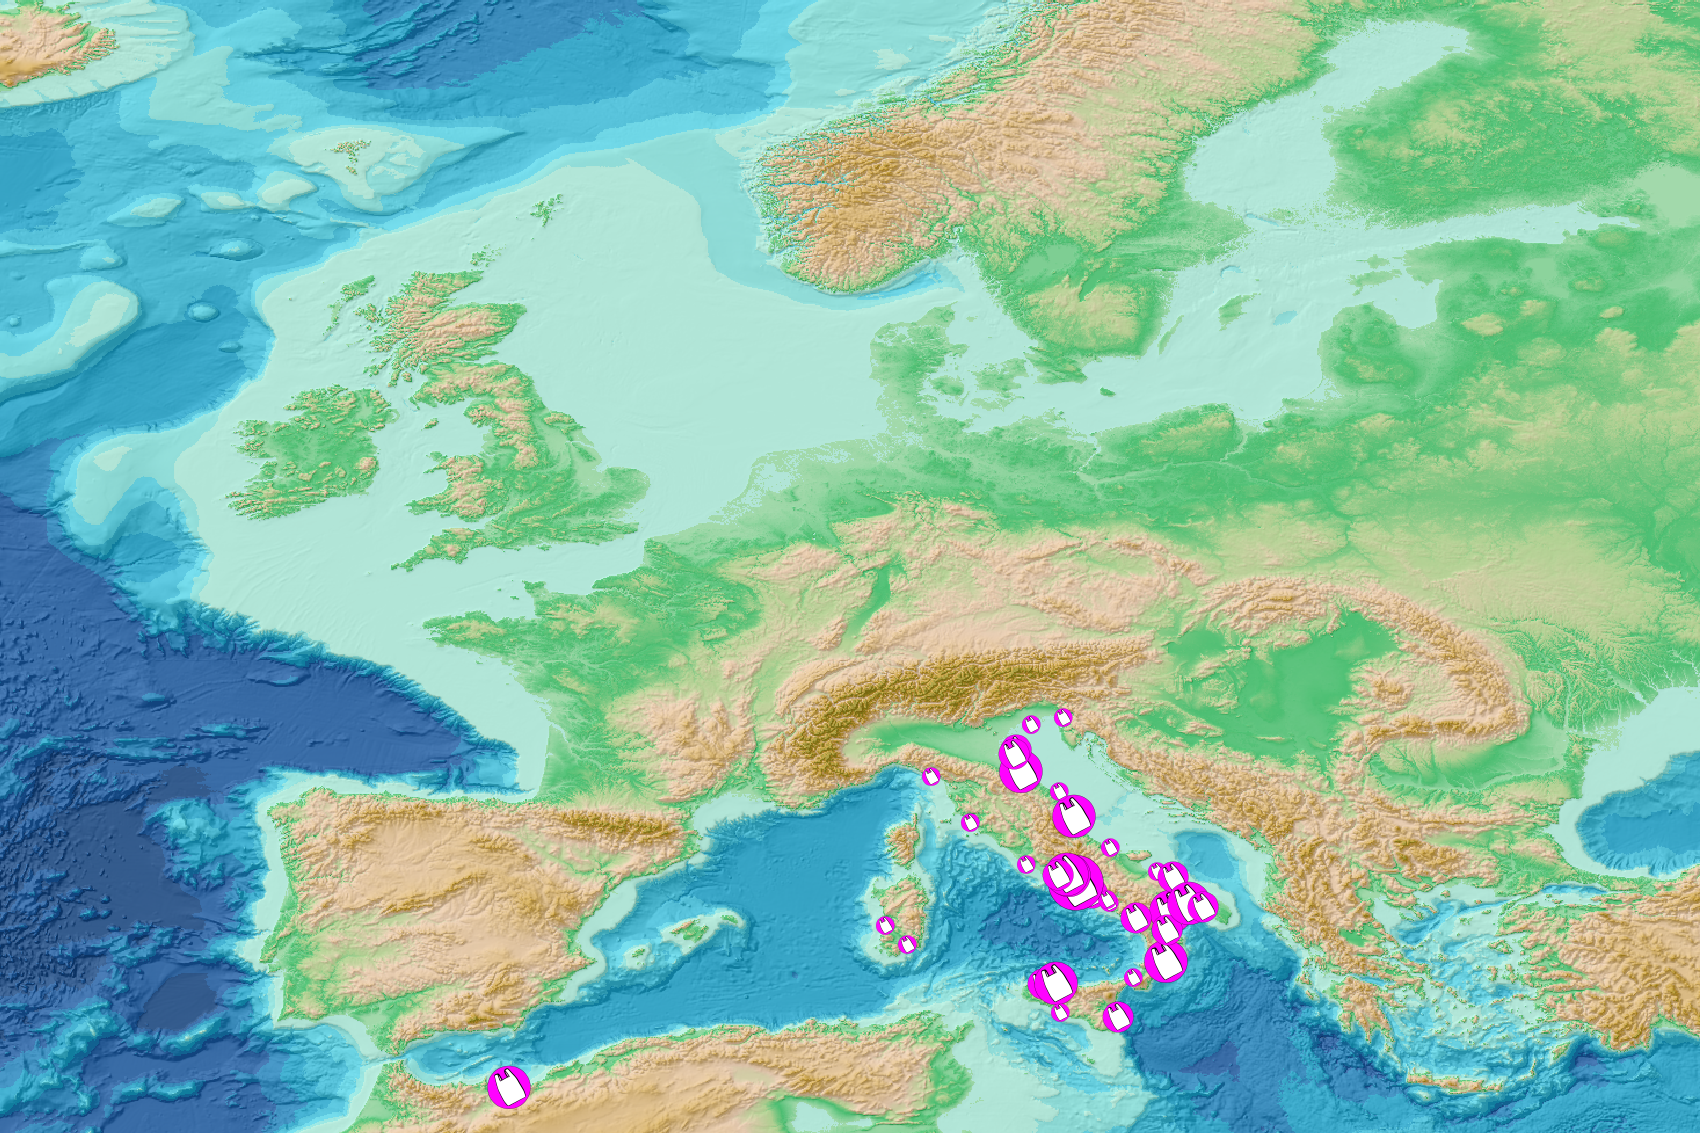
This visualization product displays the cigarette related items abundance of marine macro-litter (> 2.5cm) per beach per year from non-MSFD monitoring surveys, research & cleaning operations without UNEP-MARLIN data. EMODnet Chemistry included the collection of marine litter in its 3rd phase. Since the beginning of 2018, data of beach litter have been gathered and processed in the EMODnet Chemistry Marine Litter Database (MLDB). The harmonization of all the data has been the most challenging task considering the heterogeneity of the data sources, sampling protocols and reference lists used on a European scale. Preliminary processings were necessary to harmonize all the data: - Exclusion of OSPAR 1000 protocol: in order to follow the approach of OSPAR that it is not including these data anymore in the monitoring; - Selection of surveys from non-MSFD monitoring, cleaning and research operations; - Exclusion of beaches without coordinates; - Selection of plastic bags related items only. The list of selected items is attached to this metadata. This list was created using EU Marine Beach Litter Baselines, the European Threshold Value for Macro Litter on Coastlines and the Joint list of litter categories for marine macro-litter monitoring from JRC (these three documents are attached to this metadata); - Exclusion of surveys without associated length; - Normalization of survey lengths to 100m & 1 survey / year: in some case, the survey length was not 100m, so in order to be able to compare the abundance of litter from different beaches a normalization is applied using this formula: Number of plastic bags related items of the survey (normalized by 100 m) = Number of plastic bags related items of the survey x (100 / survey length) Then, this normalized number of plastic bags related items is summed to obtain the total normalized number of plastic bags related items for each survey. Finally, the median abundance of plastic bags related items for each beach and year is calculated from these normalized abundances of plastic bags related items per survey. Percentiles 50, 75, 95 & 99 have been calculated taking into account plastic bags related items from other sources data for all years. More information is available in the attached documents. Warning: the absence of data on the map does not necessarily mean that they do not exist, but that no information has been entered in the Marine Litter Database for this area.
-

Moving 6-year analysis and visualization of Water body silicate in the North Sea. Four seasons (December-February, March-May, June-August, September-November). Data Sources: observational data from SeaDataNet/EMODnet Chemistry Data Network. Description of DIVA analysis: Geostatistical data analysis by DIVAnd (Data-Interpolating Variational Analysis) tool, version 2.7.12. results were subjected to the minfield option in DIVAnd to avoid negative/underestimated values in the interpolated results; error threshold masks L1 (0.3) and L2 (0.5) are included as well as the unmasked field. The depth dimension allows visualizing the gridded field at various depths.
-
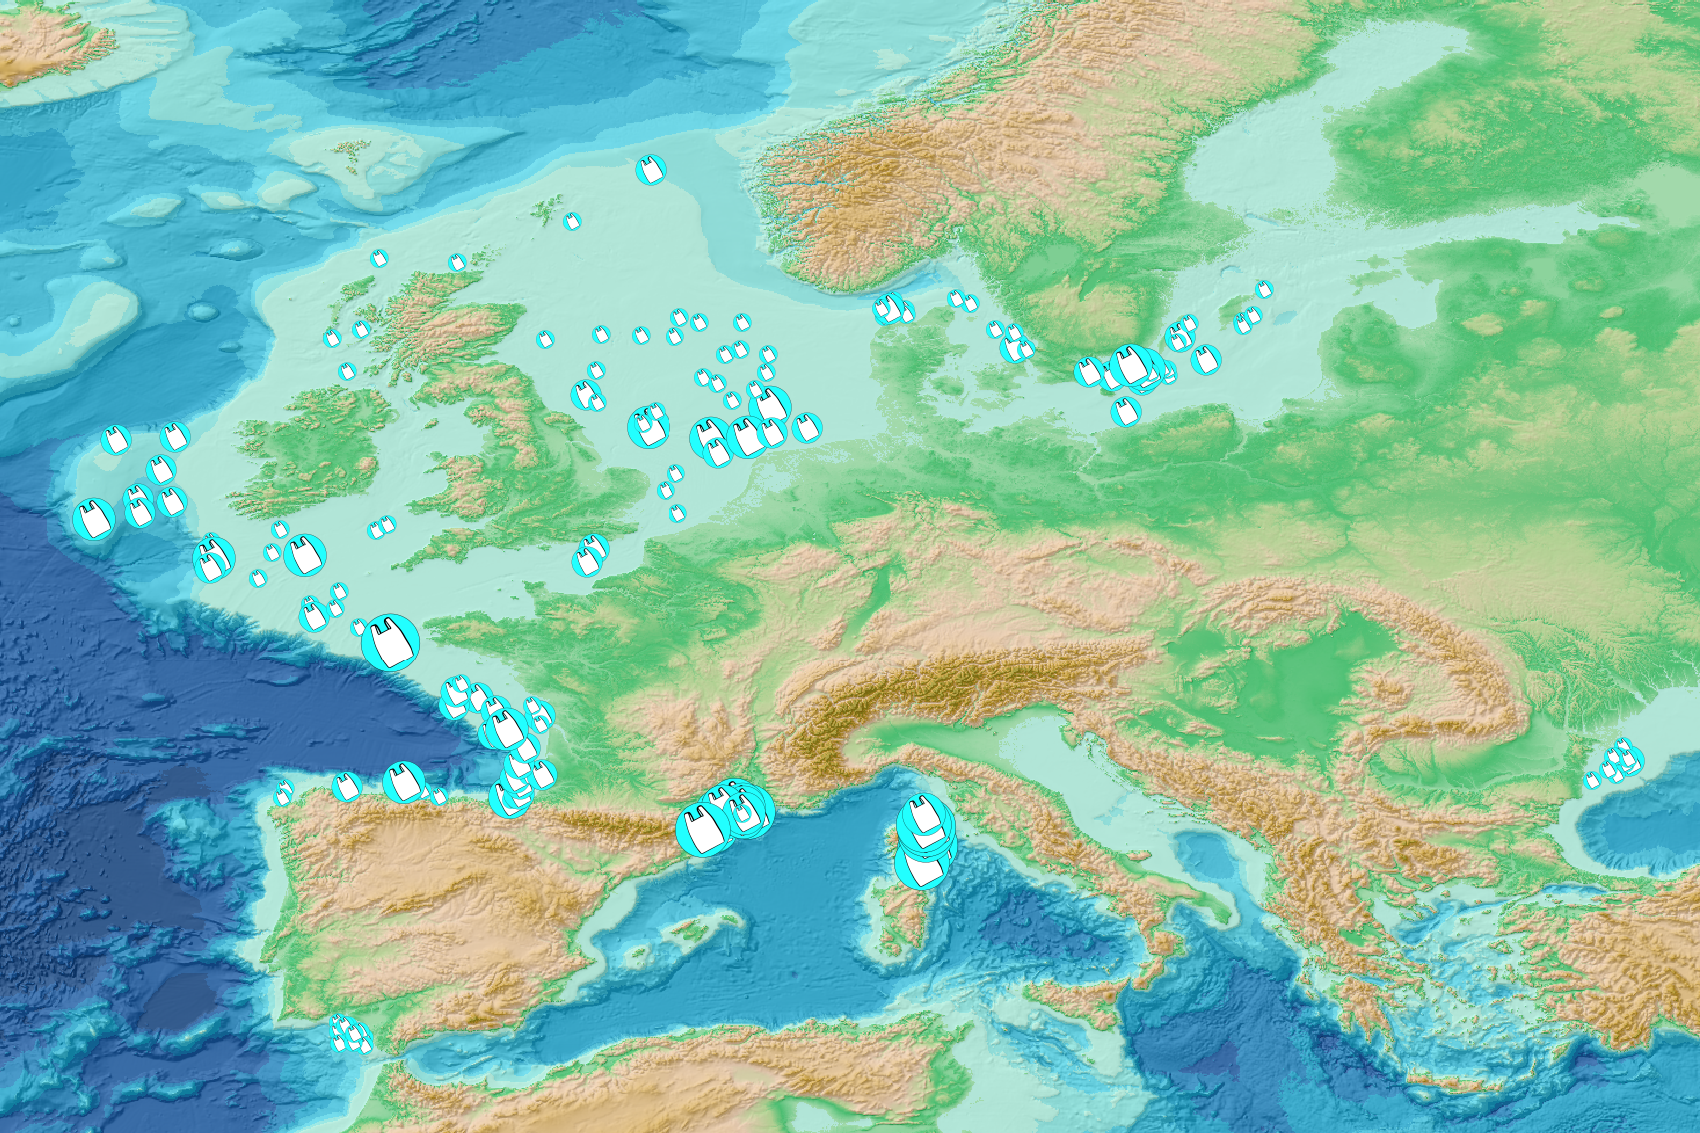
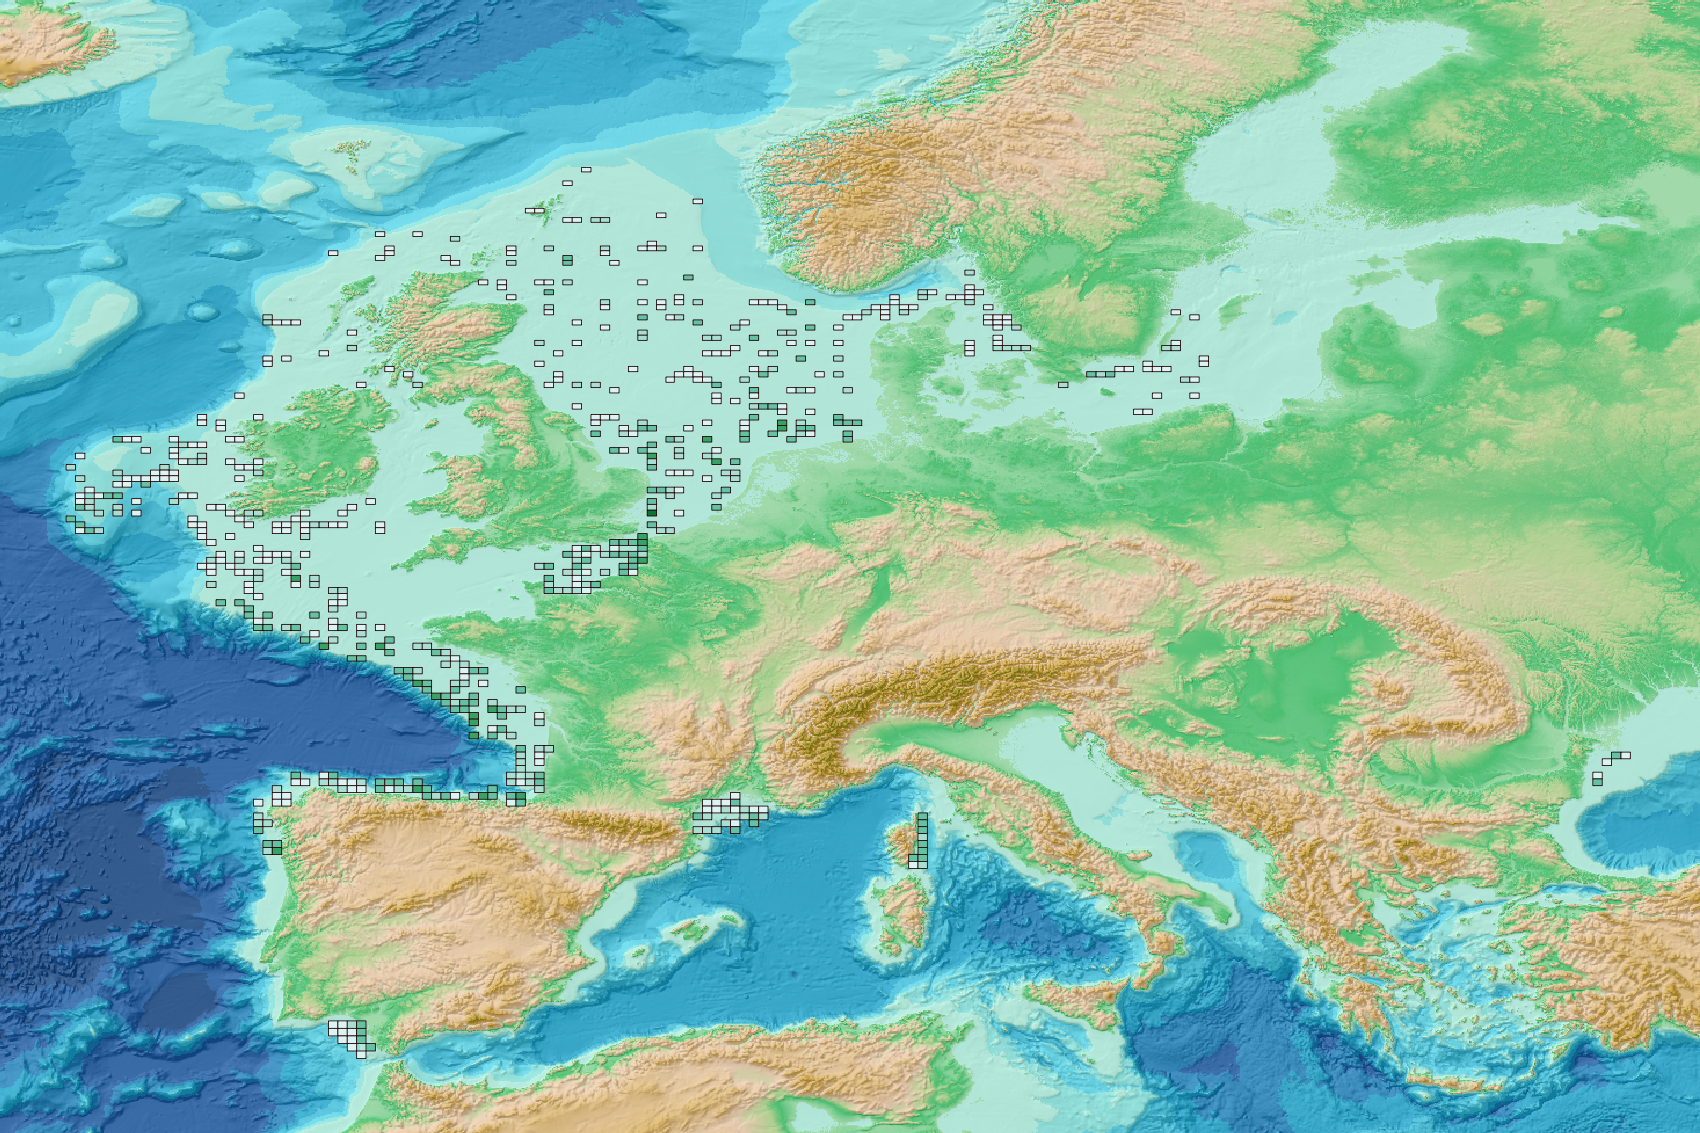
This visualization product displays plastic bags density per trawl. EMODnet Chemistry included the collection of marine litter in its 3rd phase. Since the beginning of 2018, data of seafloor litter collected by international fish-trawl surveys have been gathered and processed in the EMODnet Chemistry Marine Litter Database (MLDB). The harmonization of all the data has been the most challenging task considering the heterogeneity of the data sources, sampling protocols (OSPAR and MEDITS protocols) and reference lists used on a European scale. Moreover, within the same protocol, different gear types are deployed during bottom trawl surveys. In cases where the wingspread and/or number of items were/was unknown, it was not possible to use the data because these fields are needed to calculate the density. Data collected before 2011 are concerned by this filter. When the distance reported in the data was null, it was calculated from: - the ground speed and the haul duration using the following formula: Distance (km) = Haul duration (h) * Ground speed (km/h); - the trawl coordinates if the ground speed and the haul duration were not filled in. The swept area was calculated from the wingspread (which depends on the fishing gear type) and the distance trawled: Swept area (km²) = Distance (km) * Wingspread (km) Densities were calculated on each trawl and year using the following computation: Density of plastic bags (number of items per km²) = ∑Number of plastic bags related items / Swept area (km²) Percentiles 50, 75, 95 & 99 were calculated taking into account data for all years. The list of selected items for this product is attached to this metadata. Information on data processing and calculation is detailed in the attached methodology document. Warning: the absence of data on the map does not necessarily mean that they do not exist, but that no information has been entered in the Marine Litter Database for this area.
-
C-RAID: Comprehensive Reprocessing of Drifting Buoy Data (1979-2018) The C-RAID (Copernicus - Reprocessing of Drifting Buoys) project delivers a comprehensive global reprocessing of historical drifting buoy data and metadata, providing climate-quality observations for marine and atmospheric research. Dataset Overview The C-RAID dataset encompasses metadata from 21 858 drifting buoys deployed between 1979 and 2018. Of these, 17 496 buoys have undergone complete reprocessing with scientific validation in delayed mode, including comparison against ERA5 reanalysis. Project Context Managed by the WMO DBCP Drifting Buoys Global Data Assembly Centre (GDAC) through Ifremer, Météo-France, and Ocean Sciences Division of Fisheries and Oceans Canada, C-RAID focuses on enhanced quality control and delivery of climate-quality drifting buoy data for the Marine Climate Data System (MCDS). Objectives - Complete reprocessing and clean-up of the historical drifting buoy data archive - Recovery and rescue of missing datasets - Reprocessing of Argos data with improved positioning using Kalman filter algorithms - Homogenization of quality control procedures across marine and atmospheric parameters Funding & Governance C-RAID was funded by the Copernicus Programme through the European Environment Agency (Contract # EEA/IDM/15/026/LOT1), supporting cross-cutting coordination activities for the in-situ component of Copernicus Services. Stakeholders & Partnerships The project is led by the DB-GDAC consortium (Ifremer, Météo-France) in collaboration with EUMETNET's E-SURFMAR programme, NOAA AOML, and JCOMMOPS. Key Achievements - Reprocessing of approximately 24 000 buoy-years of observations - Recovery of missing datasets and metadata through data rescue efforts - Implementation of homogeneous, rich metadata and data formats - Enhanced Argos location accuracy using Kalman filter reprocessing - Standardized quality control and validation procedures Data Access & FAIR Principles C-RAID provides FAIR (Findable, Accessible, Interoperable, Reusable) data access through: - Web-based data discovery portal for human users - API services for data discovery, subsetting, and download (machine-to-machine access) Target Users The dataset serves major operational and research programmes including: - Copernicus Climate Change Service (C3S) - Copernicus Marine Environment Monitoring Service (CMEMS) - iQuam (in-situ SST Quality Monitor) - ICOADS (International Comprehensive Ocean-Atmosphere Data Set) - GHRSST (Group for High Resolution Sea Surface Temperature) - ISPD (International Surface Pressure Databank) - ICDC (Integrated Climate Data Center)
-

Moving 6-year analysis of Water body phosphate in the NorthEast Atlantic for each season: - winter: January-March, - spring: April-June, - summer: July-September, - autumn: October-December. Every year of the time dimension corresponds to the 6-year centred average of each season. 6-year periods span from 1950/1955 until 2019/2024. Observation data span from 1950 to 2024. Depth levels (IODE standard depths): [0.0, 5.0, 10.0, 20.0, 30.0, 40.0, 50.0, 75.0, 100.0, 125.0, 150.0, 200.0, 250.0, 300.0, 400.0, 500.0, 600.0, 700.0, 800.0, 900.0, 1000.0, 1100.0, 1200.0, 1300.0, 1400.0, 1500.0, 1750.0, 2000.0]. Data sources: observational data from SeaDataNet/EMODNet Chemistry Data Network. Description of DIVAnd analysis: the computation was done with DIVAnd (Data-Interpolating Variational Analysis in n dimensions), version 2.7.12, using GEBCO 30 sec topography for the spatial connectivity of water masses. The horizontal resolution of the produced DIVAnd maps is 0.1 degrees. Horizontal correlation length varies from 250km in open sea regions to 50km at the coast. Vertical correlation length is defined as twice the vertical resolution. Signal-to-noise ratio was fixed to 1 for vertical profiles and 0.1 for time series to account for the redundancy in the time series observations. A logarithmic transformation (DIVAnd.loglin) was applied to the data prior to the analysis. Background field: a vertically-filtered profile of the seasonal data mean value (including all years) is substracted from the data. Detrending of data: no, advection constraint applied: no. Units: umol/l.
-

As part of the marine water quality monitoring of the “Pertuis” and the “baie de l’Aiguillon” (France), commissioned by the OFB and carried out by setec énergie environnement, three monitoring stations were installed. Two of them were set up at the mouths of the Charente and Seudre rivers on February 6 and 27, 2019, respectively, while a third was deployed in the Bay of Aiguillon on March 24, 2021. The dataset presented here concerns the station installed in the Charente estuary. Measurements are organized into .csv files, with one file per year. Data is collected using a SAMBAT multiparameter probe, which records the following parameters: - Temperature (-5 to 35 °C) - Conductivity (0 to 10 mS/cm) - Pressure (0 to 10 m) - Turbidity (0 to 300 NTU) - Dissolved Oxygen (0 to 20 mg/L & 0 to 200 %) - Fluorescence (0 to 50 µg/l) - PH (0/14)
-
This visualization product displays the cigarette related items abundance of marine macro-litter (> 2.5cm) per beach per year from non-MSFD monitoring surveys, research & cleaning operations without UNEP-MARLIN data. EMODnet Chemistry included the collection of marine litter in its 3rd phase. Since the beginning of 2018, data of beach litter have been gathered and processed in the EMODnet Chemistry Marine Litter Database (MLDB). The harmonization of all the data has been the most challenging task considering the heterogeneity of the data sources, sampling protocols and reference lists used on a European scale. Preliminary processings were necessary to harmonize all the data: - Exclusion of OSPAR 1000 protocol: in order to follow the approach of OSPAR that it is not including these data anymore in the monitoring; - Selection of surveys from non-MSFD monitoring, cleaning and research operations; - Exclusion of beaches without coordinates; - Selection of cigarette related items only. The list of selected items is attached to this metadata. This list was created using EU Marine Beach Litter Baselines, the European Threshold Value for Macro Litter on Coastlines and the Joint list of litter categories for marine macro-litter monitoring from JRC (these three documents are attached to this metadata); - Exclusion of surveys without associated length; - Exclusion of surveys referring to the UNEP-MARLIN list: the UNEP-MARLIN protocol differs from the other types of monitoring in that cigarette butts are surveyed in a 10m square. To avoid comparing abundances from very different protocols, the choice has been made to distinguish in two maps the cigarette related items results associated with the UNEP-MARLIN list from the others; - Normalization of survey lengths to 100m & 1 survey / year: in some case, the survey length was not 100m, so in order to be able to compare the abundance of litter from different beaches a normalization is applied using this formula: Number of cigarette related items of the survey (normalized by 100 m) = Number of cigarette related items of the survey x (100 / survey length) Then, this normalized number of cigarette related items is summed to obtain the total normalized number of cigarette related items for each survey. Finally, the median abundance of cigarette related items for each beach and year is calculated from these normalized abundances of cigarette related items per survey. Percentiles 50, 75, 95 & 99 have been calculated taking into account cigarette related items from other sources data (excluding UNEP-MARLIN protocol) for all years. More information is available in the attached documents. Warning: the absence of data on the map does not necessarily mean that they do not exist, but that no information has been entered in the Marine Litter Database for this area.
-

Moving 6-year analysis of Water body dissolved inorganic nitrogen (DIN) in the Mediterranean Sea for each season: - winter: January-March, - spring: April-June, - summer: July-September, - autumn: October-December. Every year of the time dimension corresponds to the 6-year centered average of the season. 6-years periods span from 1990-1995 until 2018-2023. Description of DIVA analysis: The computation was done with the DIVAnd (Data-Interpolating Variational Analysis in n dimensions), version 2.7.12, using GEBCO 30sec topography for the spatial connectivity of water masses. The horizontal resolution of the produced DIVAnd maps grids is dx=dy=0.125 degrees (around 13.5km and 10.9km accordingly). The vertical resolution is 21 depth levels: [0.,5.,10.,20.,30.,50.,75.,100.,125.,150.,200.,250.,300.,400.,500.,600.,700.,800.,900.,1000.,1100.]. The horizontal correlation length is 200km. The vertical correlation length (in meters) was set twices the vertical resolution: [10.,10.,20.,20.,40.,50.,50.,50.,50.,100.,100.,100.,200.,200.,200.,200.,200.,200.,200.,200.,200.]. Duplicates check was performed using the following criteria for space and time: dlon=0.001deg., dlat=0.001deg., ddepth=1m, dtime=1hour, dvalue=0.1. The error variance (epsilon2) was set equal to 1 for profiles and 10 for time series to reduce the influence of close data near the coasts. An anamorphosis transformation was applied to the data (function DIVAnd.Anam.loglin) to avoid unrealistic negative values: threshold value=200. A background analysis field was used for all years (1990-2023) with correlation length equal to 600km and error variance (epsilon2) equal to 20. Quality control of the observations was applied using the interpolated field (QCMETHOD=3). Residuals (differences between the observations and the analysis (interpolated linearly to the location of the observations) were calculated. Observations with residuals outside the minimum and maximum values of the 99% quantile were discarded from the analysis. Originators of Italian data sets-List of contributors: - Brunetti Fabio (OGS) - Cardin Vanessa, Bensi Manuel doi:10.6092/36728450-4296-4e6a-967d-d5b6da55f306 - Cardin Vanessa, Bensi Manuel, Ursella Laura, Siena Giuseppe doi:10.6092/f8e6d18e-f877-4aa5-a983-a03b06ccb987 - Cataletto Bruno (OGS) - Cinzia Comici Cinzia (OGS) - Civitarese Giuseppe (OGS) - DeVittor Cinzia (OGS) - Giani Michele (OGS) - Kovacevic Vedrana (OGS) - Mosetti Renzo (OGS) - Solidoro C.,Beran A.,Cataletto B.,Celussi M.,Cibic T.,Comici C.,Del Negro P.,De Vittor C.,Minocci M.,Monti M.,Fabbro C.,Falconi C.,Franzo A.,Libralato S.,Lipizer M.,Negussanti J.S.,Russel H.,Valli G., doi:10.6092/e5518899-b914-43b0-8139-023718aa63f5 - Celio Massimo (ARPA FVG) - Malaguti Antonella (ENEA) - Fonda Umani Serena (UNITS) - Bignami Francesco (ISAC/CNR) - Boldrini Alfredo (ISMAR/CNR) - Marini Mauro (ISMAR/CNR) - Miserocchi Stefano (ISMAR/CNR) - Zaccone Renata (IAMC/CNR) - Lavezza, R., Dubroca, L. F. C., Ludicone, D., Kress, N., Herut, B., Civitarese, G., Cruzado, A., Lefèvre, D.,Souvermezoglou, E., Yilmaz, A., Tugrul, S., and Ribera d'Alcala, M.: Compilation of quality controlled nutrient profiles from the Mediterranean Sea, doi:10.1594/PANGAEA.771907, 2011.
-
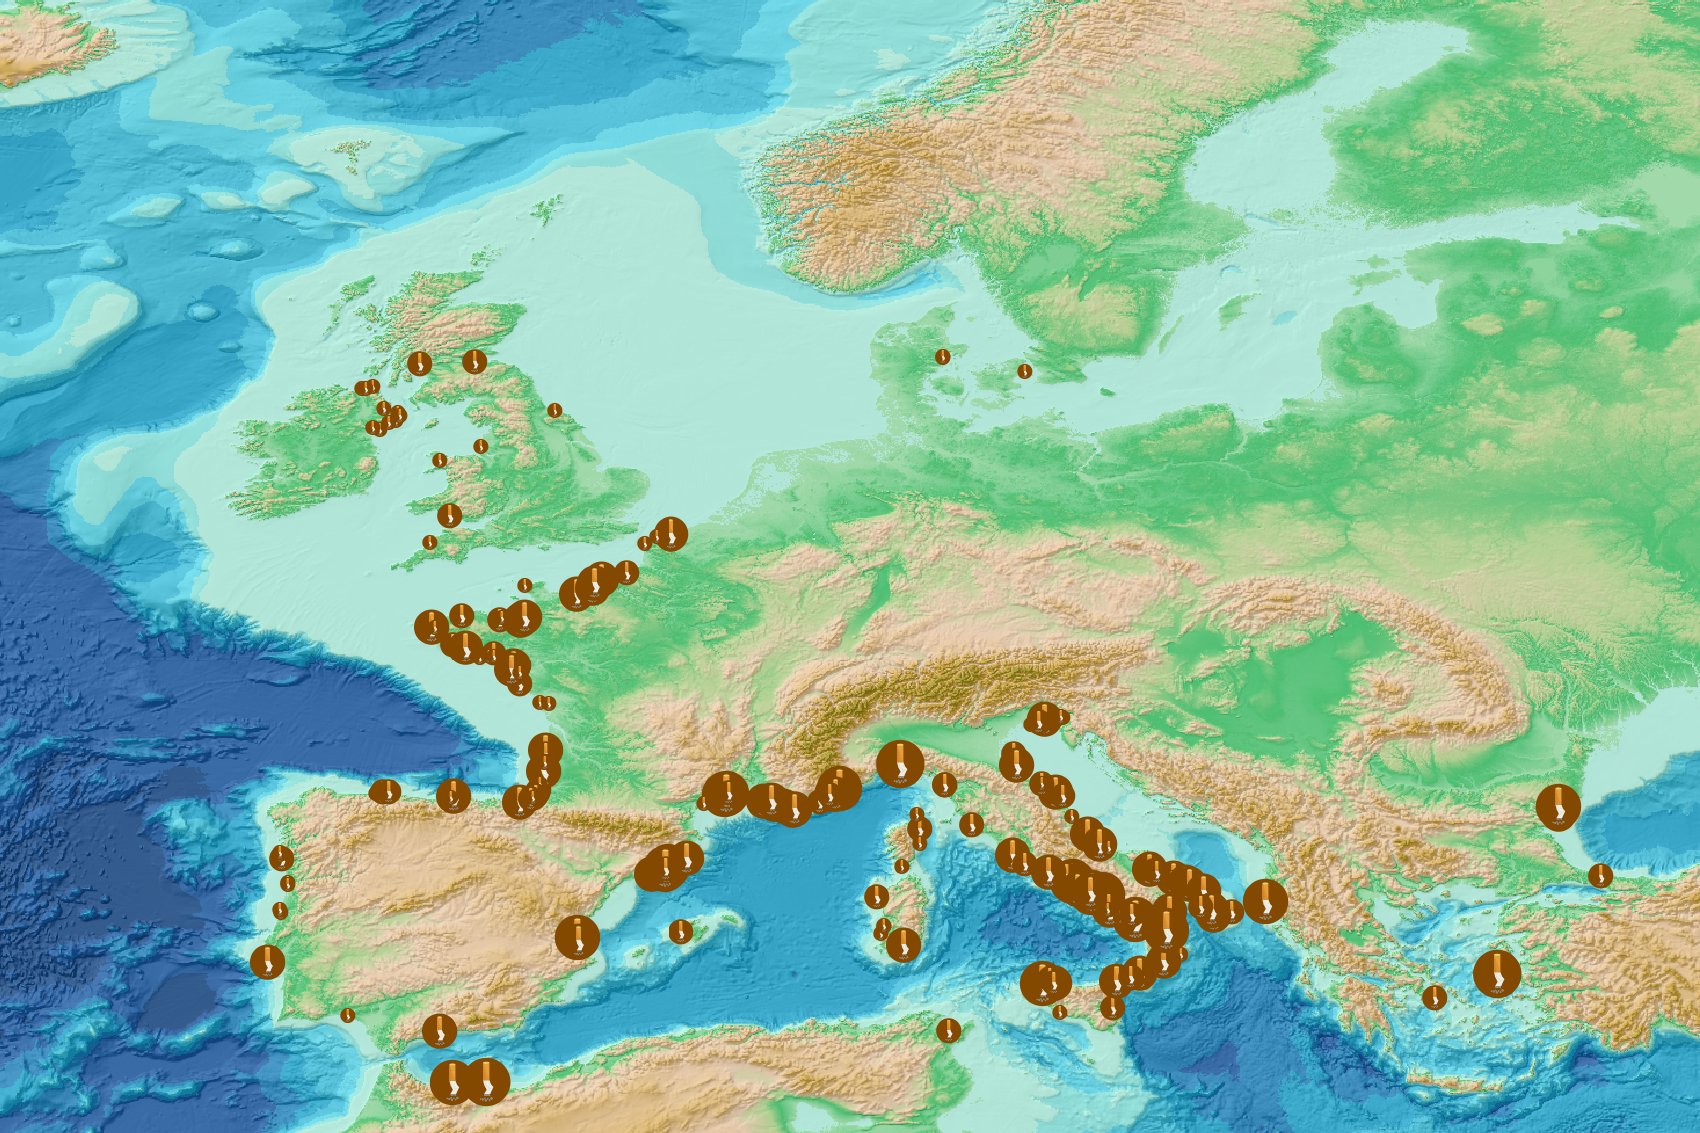
This visualization product displays the spatial distribution of fishing related items density per trawl. EMODnet Chemistry included the collection of marine litter in its 3rd phase. Since the beginning of 2018, data of seafloor litter collected by international fish-trawl surveys have been gathered and processed in the EMODnet Chemistry Marine Litter Database (MLDB). The harmonization of all the data has been the most challenging task considering the heterogeneity of the data sources, sampling protocols (OSPAR and MEDITS protocols) and reference lists used on a European scale. Moreover, within the same protocol, different gear types are deployed during bottom trawl surveys. In cases where the wingspread and/or number of items were/was unknown, it was not possible to use the data because these fields are needed to calculate the density. Data collected before 2011 are concerned by this filter. When the distance reported in the data was null, it was calculated from: - the ground speed and the haul duration using the following formula: Distance (km) = Haul duration (h) * Ground speed (km/h); - the trawl coordinates if the ground speed and the haul duration were not filled in. The swept area was calculated from the wingspread (which depends on the fishing gear type) and the distance trawled: Swept area (km²) = Distance (km) * Wingspread (km) Densities were calculated on each trawl and year using the following computation: Density of fishing related items (number of items per km²) = ∑Number of fishing related items / Swept area (km²) Then a grid with 30km x 30km cells was used to calculate the weighted mean of densities in each cell from the formula : Weighted mean (number of items per km²) = ∑ (Distance (km) * Density (number of items per km²)) / ∑ Distance (km) Percentiles 50, 75, 95 & 99 were calculated taking into account data for all years. More information on data processing and calculation are detailed in the attached methodology document. Warning: the absence of data on the map does not necessarily mean that they do not exist, but that no information has been entered in the Marine Litter Database for this area. This work is based on the work presented in the following scientific article: O. Gerigny, M. Brun, M.C. Fabri, C. Tomasino, M. Le Moigne, A. Jadaud, F. Galgani, Seafloor litter from the continental shelf and canyons in French Mediterranean Water: Distribution, typologies and trends, Marine Pollution Bulletin, Volume 146, 2019, Pages 653-666, ISSN 0025-326X, https://doi.org/10.1016/j.marpolbul.2019.07.030.
-

This visualization product displays the single use plastics (SUP) related items abundance of marine macro-litter (> 2.5cm) per beach per year from non-MSFD monitoring surveys, research & cleaning operations. EMODnet Chemistry included the collection of marine litter in its 3rd phase. Since the beginning of 2018, data of beach litter have been gathered and processed in the EMODnet Chemistry Marine Litter Database (MLDB). The harmonization of all the data has been the most challenging task considering the heterogeneity of the data sources, sampling protocols and reference lists used on a European scale. Preliminary processing were necessary to harmonize all the data: - Exclusion of OSPAR 1000 protocol: in order to follow the approach of OSPAR that it is not including these data anymore in the monitoring; - Selection of surveys from non-MSFD monitoring, cleaning and research operations; - Exclusion of beaches without coordinates; - Selection of SUP related items only. The list of selected items is attached to this metadata. This list was created using EU Marine Beach Litter Baselines, the European Threshold Value for Macro Litter on Coastlines and the Joint list of litter categories for marine macro-litter monitoring from JRC (these three documents are attached to this metadata). The selection was adapted to the Joint list of litter categories SUP identification and therefore contains some differences with the selection made for previously published versions of this product; - Exclusion of surveys without associated length; - Normalization of survey lengths to 100m & 1 survey / year: in some case, the survey length was not 100m, so in order to be able to compare the abundance of litter from different beaches a normalization is applied using this formula: Number of SUP related items of the survey (normalized by 100 m) = Number of SUP related items of the survey x (100 / survey length) Then, this normalized number of SUP related items is summed to obtain the total normalized number of SUP related items for each survey. Finally, the median abundance of SUP related items for each beach and year is calculated from these normalized abundances of SUP related items per survey. Percentiles 50, 75, 95 & 99 have been calculated taking into account SUP related items from other sources data for all years. More information is available in the attached documents. Warning: the absence of data on the map does not necessarily mean that they do not exist, but that no information has been entered in the Marine Litter Database for this area.