Catalogue PIGMA
Type of resources
Available actions
Topics
Keywords
Contact for the resource
Provided by
Years
Formats
Representation types
Update frequencies
status
Service types
Scale
Resolution
-
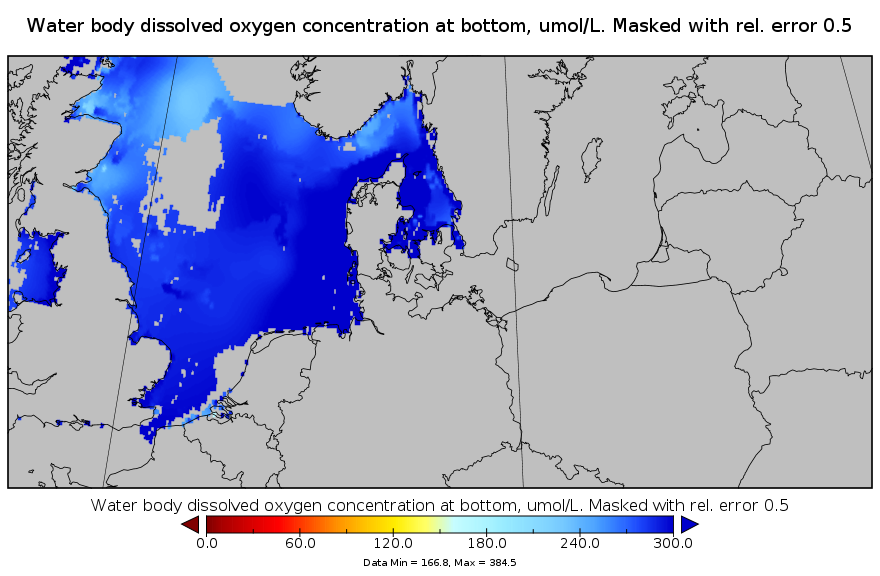
This gridded product visualizes 1960 - 2014 water body dissolved oxygen concentration (umol/l) in the North Sea domain, for each season (winter: December – February; spring: March – May; summer: June – August; autumn: September – November). It is produced as a Diva 4D analysis, version 4.6.11: a reference field of all seasonal data between 1960-2014 was used; results were logit transformed to avoid negative/underestimated values in the interpolated results; error threshold masks L1 (0.3) and L2 (0.5) are included as well as the unmasked field. Every step of the time dimension corresponds to a 10-year moving average for each season. The depth dimension allows visualizing the gridded field at various depths.
-
Temporal series (annual mean values) and Long Term Average (LTA) of sediment load for each river mouth where in situ data is available. Different sources can be mixed if any.
-
Rapport final ONF
-

Species distribution models (GAM, Maxent and Random Forest ensemble) predicting the distribution of discrete Lophelia pertusa - Desmophylum pertusum colonies assemblage in the Celtic Sea. This community is considered ecologically coherent according to the cluster analysis conducted by Parry et al. (2015) on image samples. Modelling its distribution complements existing work on their definition and offers a representation of the extent of the areas of the North East Atlantic where they can occur based on the best available knowledge. This work was performed at the University of Plymouth in 2021.
-

This deliverable presents the main components of the final and most important result of the project, namely the integrated suite of design tools for ocean energy systems innovation, development and deployment. The toolset includes: installer, catalogues, online documentation and example test cases.
-

Cost reductions in nascent forms of Renewable Energy Technology (RET) are essential for them to contribute to the energy mix. Policy intervention can facilitate this cost reduction; however, this may require a significant investment from the public sector. These cost reductions fall into two broad categories: (1) incremental cost reductions through continual improvements to existing technologies, and (2) radical innovation where technologies that significantly differ from the incumbents are developed. This study presents a modelling methodology to integrate radical innovation in RET experience curve and learning investment analysis, using wave energy as an example nascent RET. This aims to quantify the potential effects of radical innovation on the learning investment, allowing the value of successful innovation to be better analysed. The study highlights the value offered by radical innovations in long-term deployment scenarios for wave energy. This suggests that high-risk R&D efforts in nascent RET sectors, even with low success rates, could still present significant expected value in offsetting future revenue support.
-
'''This product has been archived''' For operationnal and online products, please visit https://marine.copernicus.eu '''Short description:''' For the Global ocean, the ESA Ocean Colour CCI surface Chlorophyll (mg m-3, 4 km resolution) using the OC-CCI recommended chlorophyll algorithm is made available in CMEMS format. Phytoplankton functional types (PFT) products provide daily chlorophyll concentrations of three size-classes, consisting of nano, pico and micro-phytoplankton. L3 products are daily files, while the L4 are monthly composites. ESA-CCI data are provided by Plymouth Marine Laboratory at 4km resolution. These are processed using the same in-house software as in the operational processing. Standard masking criteria for detecting clouds or other contamination factors have been applied during the generation of the Rrs, i.e., land, cloud, sun glint, atmospheric correction failure, high total radiance, large solar zenith angle (actually a high air mass cutoff, but approximating to 70deg zenith), coccolithophores, negative water leaving radiance, and normalized water leaving radiance at 555 nm 0.15 Wm-2 sr-1 (McClain et al., 1995). Ocean colour technique exploits the emerging electromagnetic radiation from the sea surface in different wavelengths. The spectral variability of this signal defines the so called ocean colour which is affected by the presence of phytoplankton. By comparing reflectances at different wavelengths and calibrating the result against in-situ measurements, an estimate of chlorophyll content can be derived. A detailed description of calibration & validation is given in the relevant QUID, associated validation reports and quality documentation. '''Processing information:''' ESA-CCI data are provided by Plymouth Marine Laboratory at 4km resolution. These are processed using the same in-house software as in the operational processing. The entire CCI data set is consistent and processing is done in one go. Both OC CCI and the REP product are versioned. Standard masking criteria for detecting clouds or other contamination factors have been applied during the generation of the Rrs, i.e., land, cloud, sun glint, atmospheric correction failure, high total radiance, large solar zenith angle (actually a high air mass cutoff, but approximating to 70deg zenith), coccolithophores, negative water leaving radiance, and normalized water leaving radiance at 555 nm 0.15 Wm-2 sr-1 (McClain et al., 1995). '''Description of observation methods/instruments:''' Ocean colour technique exploits the emerging electromagnetic radiation from the sea surface in different wavelengths. The spectral variability of this signal defines the so called ocean colour which is affected by the presence of phytoplankton. By comparing reflectances at different wavelengths and calibrating the result against in-situ measurements, an estimate of chlorophyll content can be derived. '''Quality / Accuracy / Calibration information:''' Detailed description of cal/val is given in the relevant QUID, associated validation reports and quality documentation.''' '''Suitability, Expected type of users / uses:''' This product is meant for use for educational purposes and for the managing of the marine safety, marine resources, marine and coastal environment and for climate and seasonal studies. '''DOI (product) :''' https://doi.org/10.48670/moi-00097
-

This document briefly presents the methodology used to build the Ecosim and Ecospace models representing the extended Seine Bay ecosystem as well as the main results.
-

DNA sequencing of Crassostrea gigas Pacific oyster spat experimentally infected with OsHV-1 virus from oyster basin of Marennes-Oleron
-