 Catalogue PIGMA
Ifremer, Fisheries Science and Technology (Plouzane)
Type of resources
Available actions
Topics
Keywords
Contact for the resource
Provided by
Years
Formats
Representation types
Resolution
-
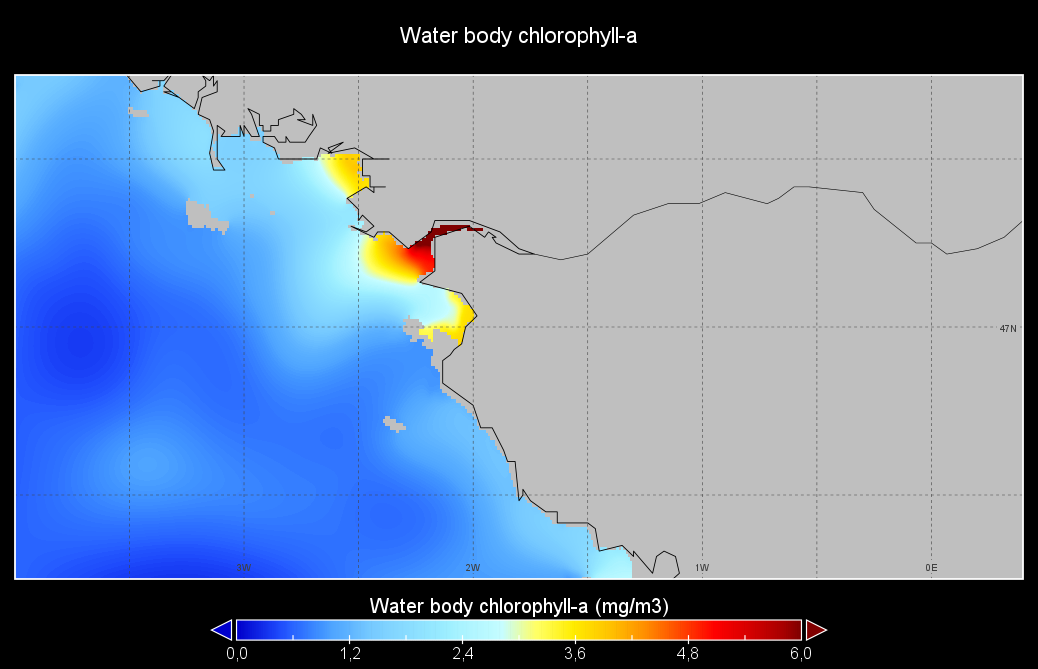
Seasonal climatology of Water body chlorophyll-a for Loire river for the period 1971-2021 and for the following seasons: - winter: January-March, - spring: April-June, - summer: July-September, - autumn: October-December. Observation data span from 1971 to 2021. Depth levels (m): [0.0, 2.0, 4.0, 6.0, 8.0, 10.0, 15.0, 20.0, 25.0, 30.0, 35.0, 40.0, 45.0, 50.0, 60.0, 70.0, 80.0, 90.0, 100.0, 110.0, 120.0, 130.0]. Data sources: observational data from SeaDataNet/EMODNet Chemistry Data Network. Description of DIVAnd analysis: the computation was done with DIVAnd (Data-Interpolating Variational Analysis in n dimensions), version 2.7.4, using GEBCO 15 sec topography for the spatial connectivity of water masses. The horizontal resolution of the produced DIVAnd maps is 0.01 degrees. Horizontal correlation length is defined seasonally (in meters): 14000 (winter), 52000 (spring), 42000 (summer), 125000 (autumn). Vertical correlation length was optimized and vertically filtered and a seasonally-averaged profile was used (DIVAnd.fitvertlen). Signal-to-noise ratio was fixed to 1 for vertical profiles and 0.1 for time series to account for the redundancy in the time series observations. A logarithmic transformation (DIVAnd.Anam.loglin) was applied to the data prior to the analysis to avoid unrealistic negative values. Background field: the vertically-filtered data mean profile is substracted from the data. Detrending of data: no, advection constraint applied: no. Units: mg/m3.
-
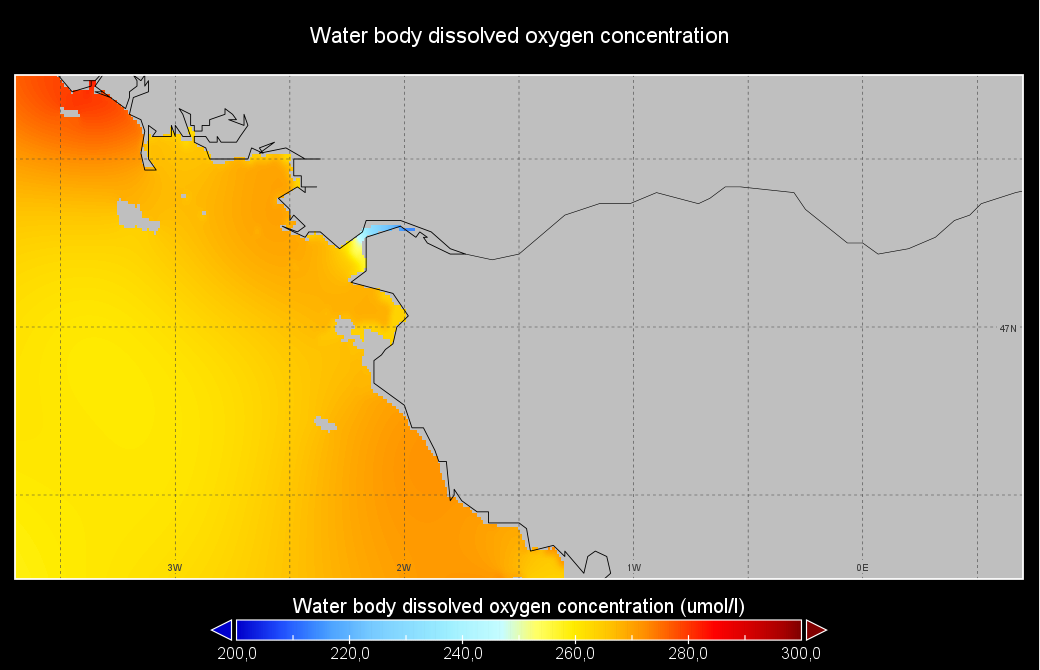
Seasonal climatology of Water body dissolved oxygen concentration for Loire river for the period 1950-2021 and for the following seasons: - winter: January-March, - spring: April-June, - summer: July-September, - autumn: October-December. Observation data span from 1950 to 2021. Depth levels (m): [0.0, 2.0, 4.0, 6.0, 8.0, 10.0, 15.0, 20.0, 25.0, 30.0, 35.0, 40.0, 45.0, 50.0, 60.0, 70.0, 80.0, 90.0, 100.0, 110.0, 120.0, 130.0]. Data sources: observational data from SeaDataNet/EMODNet Chemistry Data Network. Description of DIVAnd analysis: the computation was done with DIVAnd (Data-Interpolating Variational Analysis in n dimensions), version 2.7.4, using GEBCO 15 sec topography for the spatial connectivity of water masses. The horizontal resolution of the produced DIVAnd maps is 0.01 degrees. Horizontal correlation length is defined seasonally (in meters): 150000 (winter), 100000 (spring), 70000 (summer), 115000 (autumn). Vertical correlation length was optimized and vertically filtered and a seasonally-averaged profile was used (DIVAnd.fitvertlen). Signal-to-noise ratio was fixed to 1 for vertical profiles and 0.1 for time series to account for the redundancy in the time series observations. A logarithmic transformation (DIVAnd.Anam.loglin) was applied to the data prior to the analysis to avoid unrealistic negative values. Background field: the vertically-filtered data mean profile is substracted from the data. Detrending of data: no, advection constraint applied: no. Units: umol/l.
-
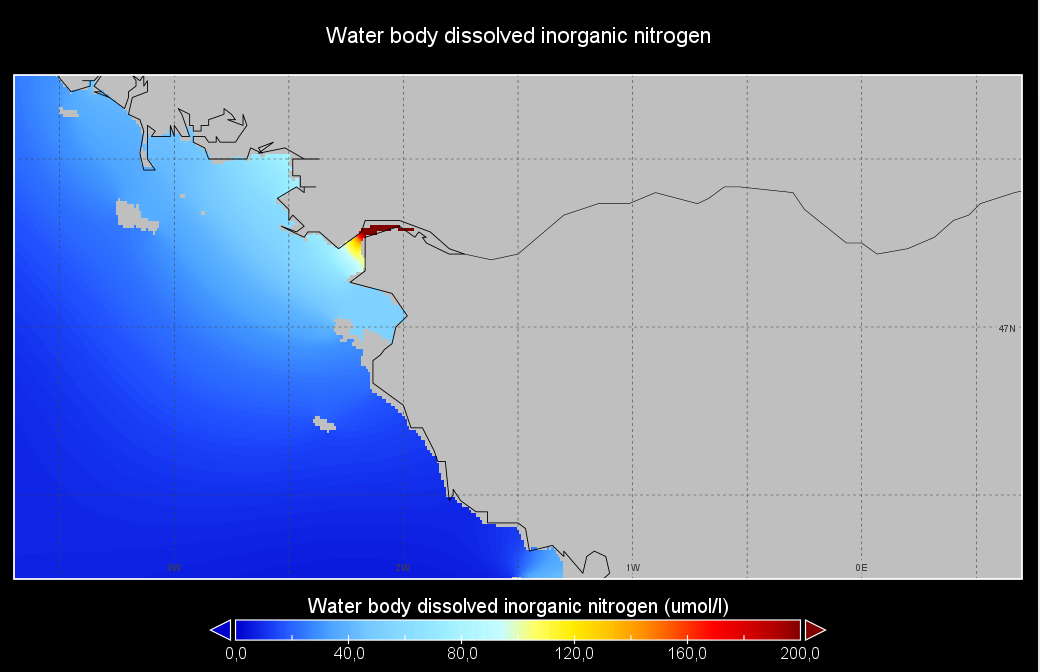
Seasonal climatology of Water body dissolved inorganic nitrogen for Loire river for the period 1971-2021 and for the following seasons: - winter: January-March, - spring: April-June, - summer: July-September, - autumn: October-December. Observation data span from 1971 to 2021. Depth levels (m): [0.0, 2.0, 4.0, 6.0, 8.0, 10.0, 15.0, 20.0, 25.0, 30.0, 35.0, 40.0, 45.0, 50.0, 60.0, 70.0, 80.0, 90.0, 100.0, 110.0, 120.0, 130.0]. Data sources: observational data from SeaDataNet/EMODNet Chemistry Data Network. Description of DIVAnd analysis: the computation was done with DIVAnd (Data-Interpolating Variational Analysis in n dimensions), version 2.7.4, using GEBCO 15 sec topography for the spatial connectivity of water masses. The horizontal resolution of the produced DIVAnd maps is 0.01 degrees. Horizontal correlation length is defined seasonally (in meters): 72000 (winter), 43000 (spring), 215000 (summer), 150000 (autumn). Vertical correlation length was optimized and vertically filtered and a seasonally-averaged profile was used (DIVAnd.fitvertlen). Signal-to-noise ratio was fixed to 1 for vertical profiles and 0.1 for time series to account for the redundancy in the time series observations. A logarithmic transformation (DIVAnd.Anam.loglin) was applied to the data prior to the analysis to avoid unrealistic negative values. Background field: the vertically-filtered data mean profile is substracted from the data. Detrending of data: no, advection constraint applied: no. Units: umol/l.
-
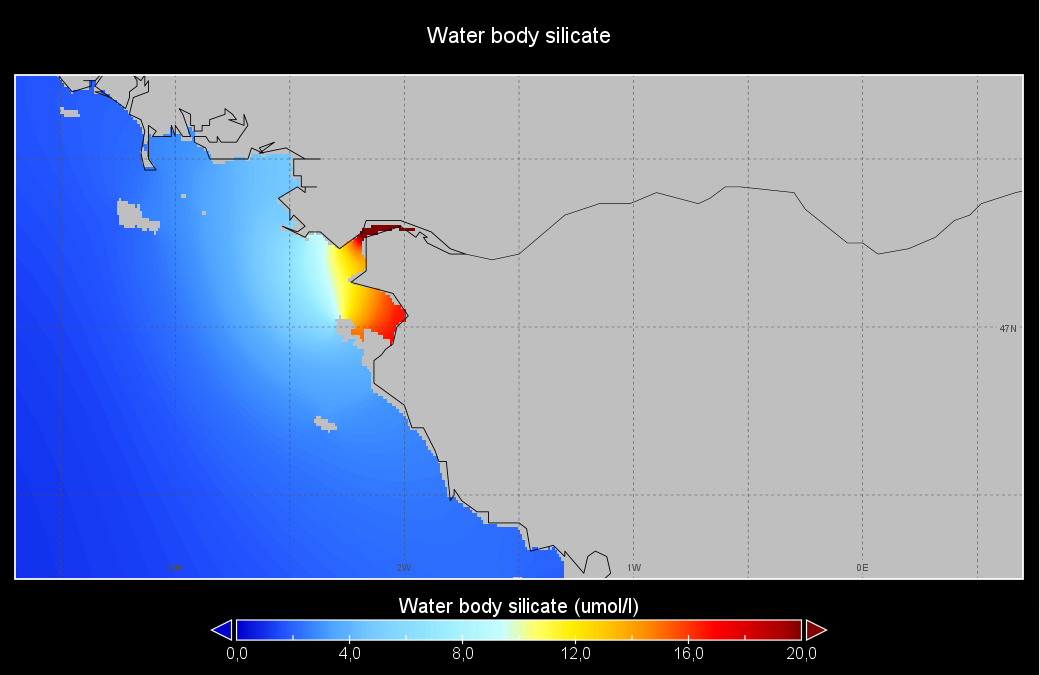
Seasonal climatology of Water body silicate for Loire river for the period 1950-2021 and for the following seasons: - winter: January-March, - spring: April-June, - summer: July-September, - autumn: October-December. Observation data span from 1950 to 2021. Depth levels (m): [0.0, 2.0, 4.0, 6.0, 8.0, 10.0, 15.0, 20.0, 25.0, 30.0, 35.0, 40.0, 45.0, 50.0, 60.0, 70.0, 80.0, 90.0, 100.0, 110.0, 120.0, 130.0]. Data sources: observational data from SeaDataNet/EMODNet Chemistry Data Network. Description of DIVAnd analysis: the computation was done with DIVAnd (Data-Interpolating Variational Analysis in n dimensions), version 2.7.4, using GEBCO 15 sec topography for the spatial connectivity of water masses. The horizontal resolution of the produced DIVAnd maps is 0.01 degrees. Horizontal correlation length is defined seasonally (in meters): 133000 (winter), 180000 (spring), 150000 (summer), 210000 (autumn). Vertical correlation length was optimized and vertically filtered and a seasonally-averaged profile was used (DIVAnd.fitvertlen). Signal-to-noise ratio was fixed to 1 for vertical profiles and 0.1 for time series to account for the redundancy in the time series observations. A logarithmic transformation (DIVAnd.Anam.loglin) was applied to the data prior to the analysis to avoid unrealistic negative values. Background field: the vertically-filtered data mean profile is substracted from the data. Detrending of data: no, advection constraint applied: no. Units: umol/l.
-

Seasonal climatology of Water body dissolved oxygen concentration for Loire river for the period 1950-2024 and for the following seasons: - winter: January-March, - spring: April-June, - summer: July-September, - autumn: October-December. Observation data span from 1950 to 2024. Depth levels (m): [0.0, 2.0, 4.0, 6.0, 8.0, 10.0, 15.0, 20.0, 25.0, 30.0, 35.0, 40.0, 45.0, 50.0, 60.0, 70.0, 80.0, 90.0, 100.0, 110.0, 120.0, 130.0]. Data sources: observational data from SeaDataNet/EMODNet Chemistry Data Network. Description of DIVAnd analysis: the computation was done with DIVAnd (Data-Interpolating Variational Analysis in n dimensions), version 2.7.12, using GEBCO 15 sec topography for the spatial connectivity of water masses. The horizontal resolution of the produced DIVAnd maps is 0.01 degrees. Horizontal correlation length is defined seasonally (in meters): 150000 (winter), 100000 (spring), 70000 (summer), 115000 (autumn). Vertical correlation length was optimized and vertically filtered and a seasonally-averaged profile was used (DIVAnd.fitvertlen). Signal-to-noise ratio was fixed to 1 for vertical profiles and 0.1 for time series to account for the redundancy in the time series observations. A logarithmic transformation (DIVAnd.loglin) was applied to the data prior to the analysis. Background field: the vertically-filtered data mean profile is substracted from the data. Detrending of data: no, advection constraint applied: no. Units: umol/l.
-

Seasonal climatology of Water body silicate for Loire river for the period 1950-2024 and for the following seasons: - winter: January-March, - spring: April-June, - summer: July-September, - autumn: October-December. Observation data span from 1950 to 2024. Depth levels (m): [0.0, 2.0, 4.0, 6.0, 8.0, 10.0, 15.0, 20.0, 25.0, 30.0, 35.0, 40.0, 45.0, 50.0, 60.0, 70.0, 80.0, 90.0, 100.0, 110.0, 120.0, 130.0]. Data sources: observational data from SeaDataNet/EMODNet Chemistry Data Network. Description of DIVAnd analysis: the computation was done with DIVAnd (Data-Interpolating Variational Analysis in n dimensions), version 2.7.12, using GEBCO 15 sec topography for the spatial connectivity of water masses. The horizontal resolution of the produced DIVAnd maps is 0.01 degrees. Horizontal correlation length is defined seasonally (in meters): 133000 (winter), 180000 (spring), 150000 (summer), 210000 (autumn). Vertical correlation length was optimized and vertically filtered and a seasonally-averaged profile was used (DIVAnd.fitvertlen). Signal-to-noise ratio was fixed to 1 for vertical profiles and 0.1 for time series to account for the redundancy in the time series observations. A logarithmic transformation (DIVAnd.loglin) was applied to the data prior to the analysis. Background field: the vertically-filtered data mean profile is substracted from the data. Detrending of data: no, advection constraint applied: no. Units: umol/l.
-

Seasonal climatology of Water body dissolved inorganic nitrogen for Loire river for the period 1971-2024 and for the following seasons: - winter: January-March, - spring: April-June, - summer: July-September, - autumn: October-December. Observation data span from 1971 to 2024. Depth levels (m): [0.0, 2.0, 4.0, 6.0, 8.0, 10.0, 15.0, 20.0, 25.0, 30.0, 35.0, 40.0, 45.0, 50.0, 60.0, 70.0, 80.0, 90.0, 100.0, 110.0, 120.0, 130.0]. Data sources: observational data from SeaDataNet/EMODNet Chemistry Data Network. Description of DIVAnd analysis: the computation was done with DIVAnd (Data-Interpolating Variational Analysis in n dimensions), version 2.7.12, using GEBCO 15 sec topography for the spatial connectivity of water masses. The horizontal resolution of the produced DIVAnd maps is 0.01 degrees. Horizontal correlation length is defined seasonally (in meters): 72000 (winter), 43000 (spring), 215000 (summer), 150000 (autumn). Vertical correlation length was optimized and vertically filtered and a seasonally-averaged profile was used (DIVAnd.fitvertlen). Signal-to-noise ratio was fixed to 1 for vertical profiles and 0.1 for time series to account for the redundancy in the time series observations. A logarithmic transformation (DIVAnd.loglin) was applied to the data prior to the analysis. Background field: the vertically-filtered data mean profile is substracted from the data. Detrending of data: no, advection constraint applied: no. Units: umol/l.
-

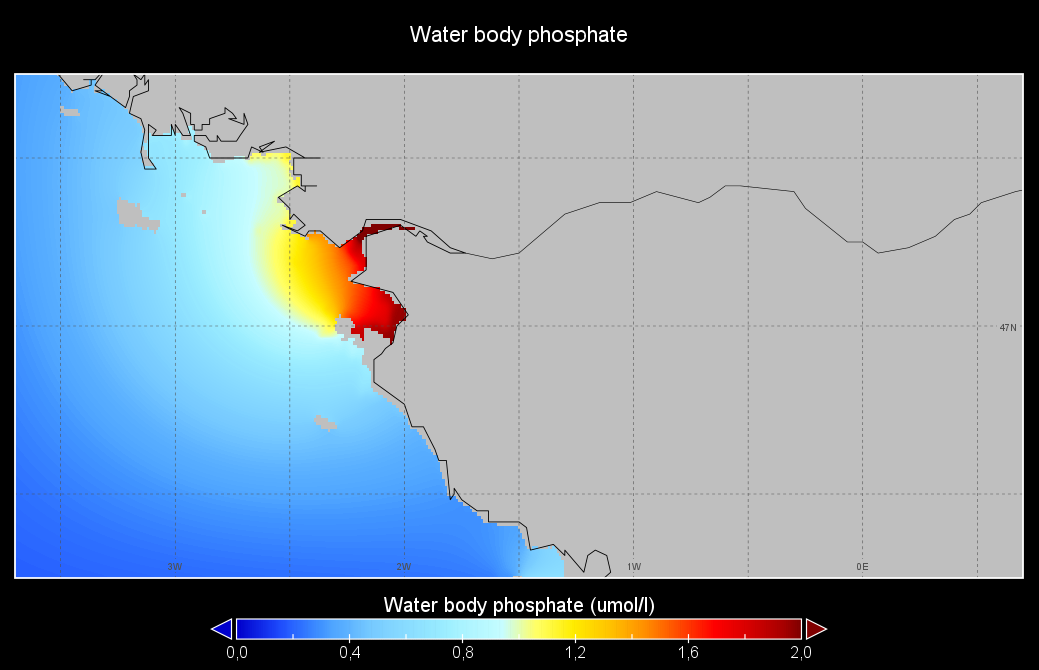
Seasonal climatology of Water body phosphate for Loire river for the period 1950-2024 and for the following seasons: - winter: January-March, - spring: April-June, - summer: July-September, - autumn: October-December. Observation data span from 1950 to 2024. Depth levels (m): [0.0, 2.0, 4.0, 6.0, 8.0, 10.0, 15.0, 20.0, 25.0, 30.0, 35.0, 40.0, 45.0, 50.0, 60.0, 70.0, 80.0, 90.0, 100.0, 110.0, 120.0, 130.0]. Data sources: observational data from SeaDataNet/EMODNet Chemistry Data Network. Description of DIVAnd analysis: the computation was done with DIVAnd (Data-Interpolating Variational Analysis in n dimensions), version 2.7.12, using GEBCO 15 sec topography for the spatial connectivity of water masses. The horizontal resolution of the produced DIVAnd maps is 0.01 degrees. Horizontal correlation length is defined seasonally (in meters): 230000 (winter), 264000 (spring), 140000 (summer), 135000 (autumn). Vertical correlation length was optimized and vertically filtered and a seasonally-averaged profile was used (DIVAnd.fitvertlen). Signal-to-noise ratio was fixed to 1 for vertical profiles and 0.1 for time series to account for the redundancy in the time series observations. A logarithmic transformation (DIVAnd.loglin) was applied to the data prior to the analysis. Background field: the vertically-filtered data mean profile is substracted from the data. Detrending of data: no, advection constraint applied: no. Units: umol/l.
-

Seasonal climatology of Water body chlorophyll-a for Loire river for the period 1971-2024 and for the following seasons: - winter: January-March, - spring: April-June, - summer: July-September, - autumn: October-December. Observation data span from 1971 to 2024. Depth levels (m): [0.0, 2.0, 4.0, 6.0, 8.0, 10.0, 15.0, 20.0, 25.0, 30.0, 35.0, 40.0, 45.0, 50.0, 60.0, 70.0, 80.0, 90.0, 100.0, 110.0, 120.0, 130.0]. Data sources: observational data from SeaDataNet/EMODNet Chemistry Data Network. Description of DIVAnd analysis: the computation was done with DIVAnd (Data-Interpolating Variational Analysis in n dimensions), version 2.7.12, using GEBCO 15 sec topography for the spatial connectivity of water masses. The horizontal resolution of the produced DIVAnd maps is 0.01 degrees. Horizontal correlation length is defined seasonally (in meters): 14000 (winter), 52000 (spring), 42000 (summer), 125000 (autumn). Vertical correlation length was optimized and vertically filtered and a seasonally-averaged profile was used (DIVAnd.fitvertlen). Signal-to-noise ratio was fixed to 1 for vertical profiles and 0.1 for time series to account for the redundancy in the time series observations. A logarithmic transformation (DIVAnd.loglin) was applied to the data prior to the analysis. Background field: the vertically-filtered data mean profile is substracted from the data. Detrending of data: no, advection constraint applied: no. Units: mg/m3.
-
Seasonal climatology of Water body phosphate for Loire river for the period 1950-2021 and for the following seasons: - winter: January-March, - spring: April-June, - summer: July-September, - autumn: October-December. Observation data span from 1950 to 2021. Depth levels (m): [0.0, 2.0, 4.0, 6.0, 8.0, 10.0, 15.0, 20.0, 25.0, 30.0, 35.0, 40.0, 45.0, 50.0, 60.0, 70.0, 80.0, 90.0, 100.0, 110.0, 120.0, 130.0]. Data sources: observational data from SeaDataNet/EMODNet Chemistry Data Network. Description of DIVAnd analysis: the computation was done with DIVAnd (Data-Interpolating Variational Analysis in n dimensions), version 2.7.4, using GEBCO 15 sec topography for the spatial connectivity of water masses. The horizontal resolution of the produced DIVAnd maps is 0.01 degrees. Horizontal correlation length is defined seasonally (in meters): 230000 (winter), 264000 (spring), 140000 (summer), 135000 (autumn). Vertical correlation length was optimized and vertically filtered and a seasonally-averaged profile was used (DIVAnd.fitvertlen). Signal-to-noise ratio was fixed to 1 for vertical profiles and 0.1 for time series to account for the redundancy in the time series observations. A logarithmic transformation (DIVAnd.Anam.loglin) was applied to the data prior to the analysis to avoid unrealistic negative values. Background field: the vertically-filtered data mean profile is substracted from the data. Detrending of data: no, advection constraint applied: no. Units: umol/l.