 Catalogue PIGMA
Data
Type of resources
Available actions
Topics
Keywords
Contact for the resource
Provided by
Years
Formats
Representation types
Update frequencies
status
Scale
Resolution
-
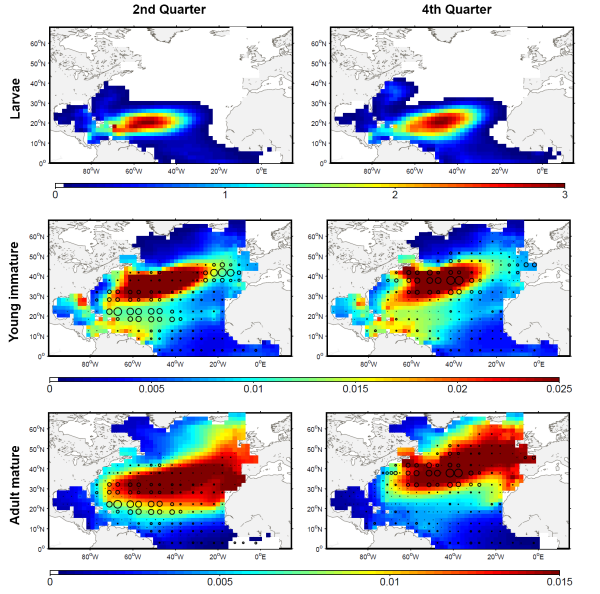
The development of the ecosystem approach and models for the management of ocean marine resources requires easy access to standard validated datasets of historical catch data for the main exploited species. They are used to measure the impact of biomass removal by fisheries and to evaluate the models skills, while the use of standard dataset facilitates models inter-comparison. North Atlantic albacore tuna is exploited all year round by longline and in summer and autumn by surface fisheries and fishery statistics compiled by the International Commission for the Conservation of Atlantic Tunas (ICCAT). Catch and effort with geographical coordinates at monthly spatial resolution of 1° or 5° squares were extracted for this species with a careful definition of fisheries and data screening. In total, thirteen fisheries were defined for the period 1956-2010, with fishing gears longline, troll, mid-water trawl and bait fishing. However, the spatialized catch effort data available in ICCAT database represent a fraction of the entire total catch. Length frequencies of catch were also extracted according to the definition of fisheries above for the period 1956-2010 with a quarterly temporal resolution and spatial resolutions varying from 1°x 1° to 10°x 20°. The resolution used to measure the fish also varies with size-bins of 1, 2 or 5 cm (Fork Length). The screening of data allowed detecting inconsistencies with a relatively large number of samples larger than 150 cm while all studies on the growth of albacore suggest that fish rarely grow up over 130 cm. Therefore, a threshold value of 130 cm has been arbitrarily fixed and all length frequency data above this value removed from the original data set.
-
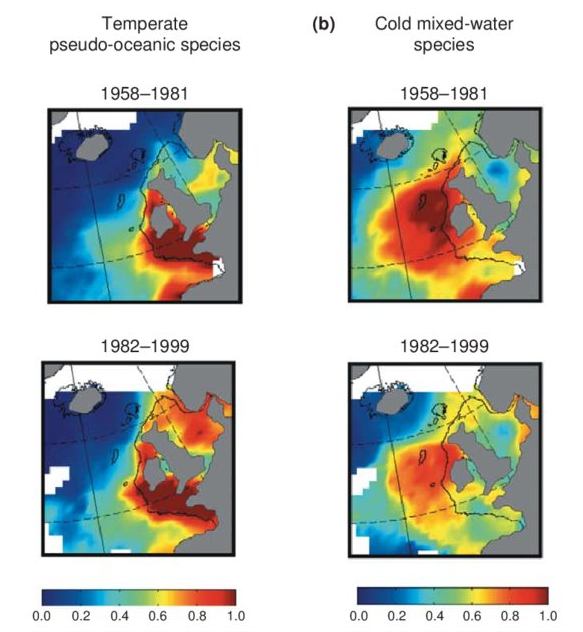
Excel file containing CPR data from Standard Areas B4,C3,C4,D3,D4,D5,E4,F4 for the plankton Calanus finmarchicus and helgolandicus, total traverse (small) copepods, total large copepods, Phytoplankton Colour Index and Cnidaria (presence denoted by a 1, absence by a zero). All taxa are from 1980, except Cnidaria which are from 2011. Dataset is in the format of sample level data, with each row being a discrete sample, with a sample being 3m3 filtered seawater, and 10nm of tow. For each row, a sample has the following information, starting at column a: Standard area of sample, sample id, latitude (decimal degrees) of sample mid point, longitude (decimal degrees) of sample midpoint, sample midpoint date and local time, year of sample, month of sample, then plankton abundance values (or PCI index or cnidaria presence/absence). All taxa have been looked for during the period this dataset spans, so zero values represent true absence.
-

NOAA High-resolution Blended Analysis of Daily SST and Ice. Data is from Sep 1981 and is on a 1/4 deg global grid.
-
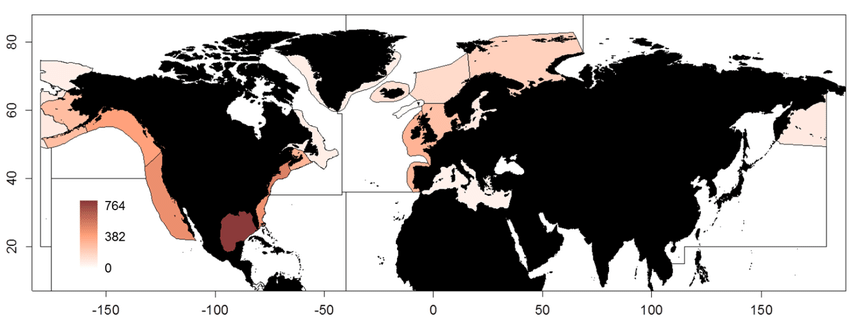
This dataset containing traits of marine fish is based on fish taxa observed during international scientific bottom-trawl surveys regularly conducted in the Northeast Atlantic, Northwest Atlantic and the Northeast Pacific. These scientific surveys target primarily demersal (bottom-dwelling) fish species, but pelagic species are also regularly recorded. The overarching aim of this dataset was to collect information on ecological traits for as many fish taxa as possible and to find area-specific trait values to account for intraspecific variation in traits, especially for widely distributed species. We collected traits for species, genera and families. The majority of trait values were sourced from FishBase (Froese and Pauly, 2019), and have been supplemented with values from the primary literature.
-
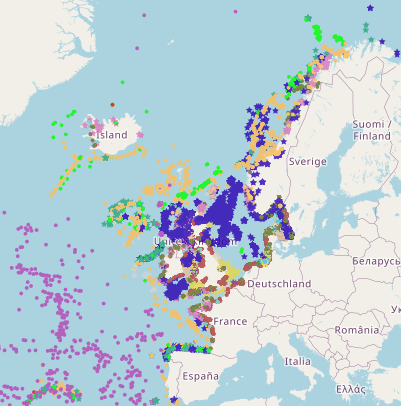
This is a compilation of OSPAR habitat point data for the northeast Atlantic submitted by OSPAR contracting parties. The compilation is coordinated by the UK's Joint Nature Conservation Committee, working with a representative from each of the OSPAR coastal contracting parties. This public dataset does not contain records relating to sensitive species (e.g. Ostrea edulis) in specific areas, or where data are restricted from public release by the owner's use limitations. This version (v2020) was published in July 2021.
-
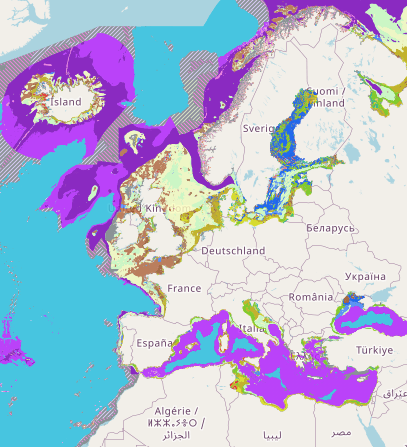
Output of the 2019 EUSeaMap broad-scale predictive model, produced by EMODnet Seabed Habitats and aggregated into the Benthic Broad Habitat Types of the Marine Strategy Framework Directive (as defined in the Commission Decision 17 May 2017). The extent of the mapped area includes the Mediterranean Sea, Black Sea, Baltic Sea, and areas of the North Eastern Atlantic extending from the Canary Islands in the south to the Barents Sea in the north. The map was produced using a "top-down" modelling approach using classified habitat descriptors to determine a final output habitat. Habitat descriptors differ per region but include: - Biological zone - Energy class - Oxygen regime - Salinity regime - Seabed substrate - Riverine input Habitat descriptors (excepting Substrate) are calculated using underlying physical data and thresholds derived from statistical analyses or expert judgement on known conditions.
-
The principal component (PC)-based indices of the North Atlantic Oscillation (NAO) are the time series of the leading Empirical Orthogonal Function (EOF) of SLP anomalies over the Atlantic sector, 20°-80°N, 90°W-40°E. These indices are used to measure the NAO throughout the year, tracking the seasonal movements of the Icelandic low and Azores high. These movements are illustrated in the Figures on this page. Positive values of the NAO index are typically associated with stronger-than-average westerlies over the middle latitudes, more intense weather systems over the North Atlantic and wetter/milder weather over western Europe.
-
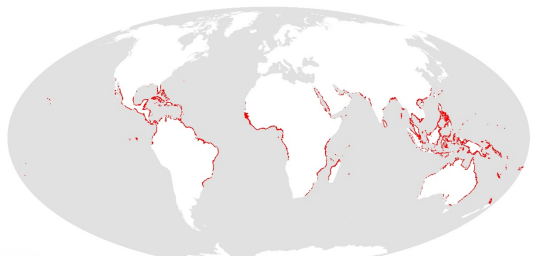
This dataset shows the global distribution of mangroves, and was produced as joint initiatives of the International Tropical Timber Organization (ITTO), International Society for Mangrove Ecosystems (ISME), Food and Agriculture Organization of the United Nations (FAO), UN Environment World Conservation Monitoring Centre (UNEP-WCMC), United Nations Educational, Scientific and Cultural Organization’s Man and the Biosphere Programme (UNESCO-MAB), United Nations University Institute for Water, Environment and Health (UNU-INWEH) and The Nature Conservancy (TNC). Major funding was provided by ITTO through a Japanese Government project grant; the project was implemented by ISME.
-

All statistics of UNCTAD are harmonized and integrated into UNCTADstat- free to use dissemination platform. It gives access to basic and derived indicators built upon common rules, harmonized environment and clear methodology supported by powerful data browsing system. The statistical series are regularly updated and classified into easy-to-navigate themes. UNCTADstat offers ready-to-use analytical groupings, with a unique coverage for countries and products and a particular focus on developing and transition economies. This approach ensures data consistency across multiple data series, and enables users to harness its full potential by mixing and matching data from various domains. The navigation browser allows table or graphic presentations, easy selection and reorganization of data, personalized functionalities and several straightforward extraction options.
-

The International Whaling Commission was set up under the International Convention for the Regulation of Whaling which was signed in Washington DC on 2nd December 1946. The preamble to the Convention states that its purpose is to provide for the proper conservation of whale stocks and thus make possible the orderly development of the whaling industry. The Commission undertakes extensive study and research on cetacean populations, develops and maintains scientific databases, and publishes its own peer reviewed scientific journal, the Journal of Cetacean Research and Management. A list of catches since the moratorium came into place (in the 1985/6 Antarctic Season) up to 2019 (download link).