 Catalogue PIGMA
2024
Type of resources
Available actions
Topics
Keywords
Contact for the resource
Provided by
Years
Formats
Representation types
Update frequencies
status
Scale
Resolution
-
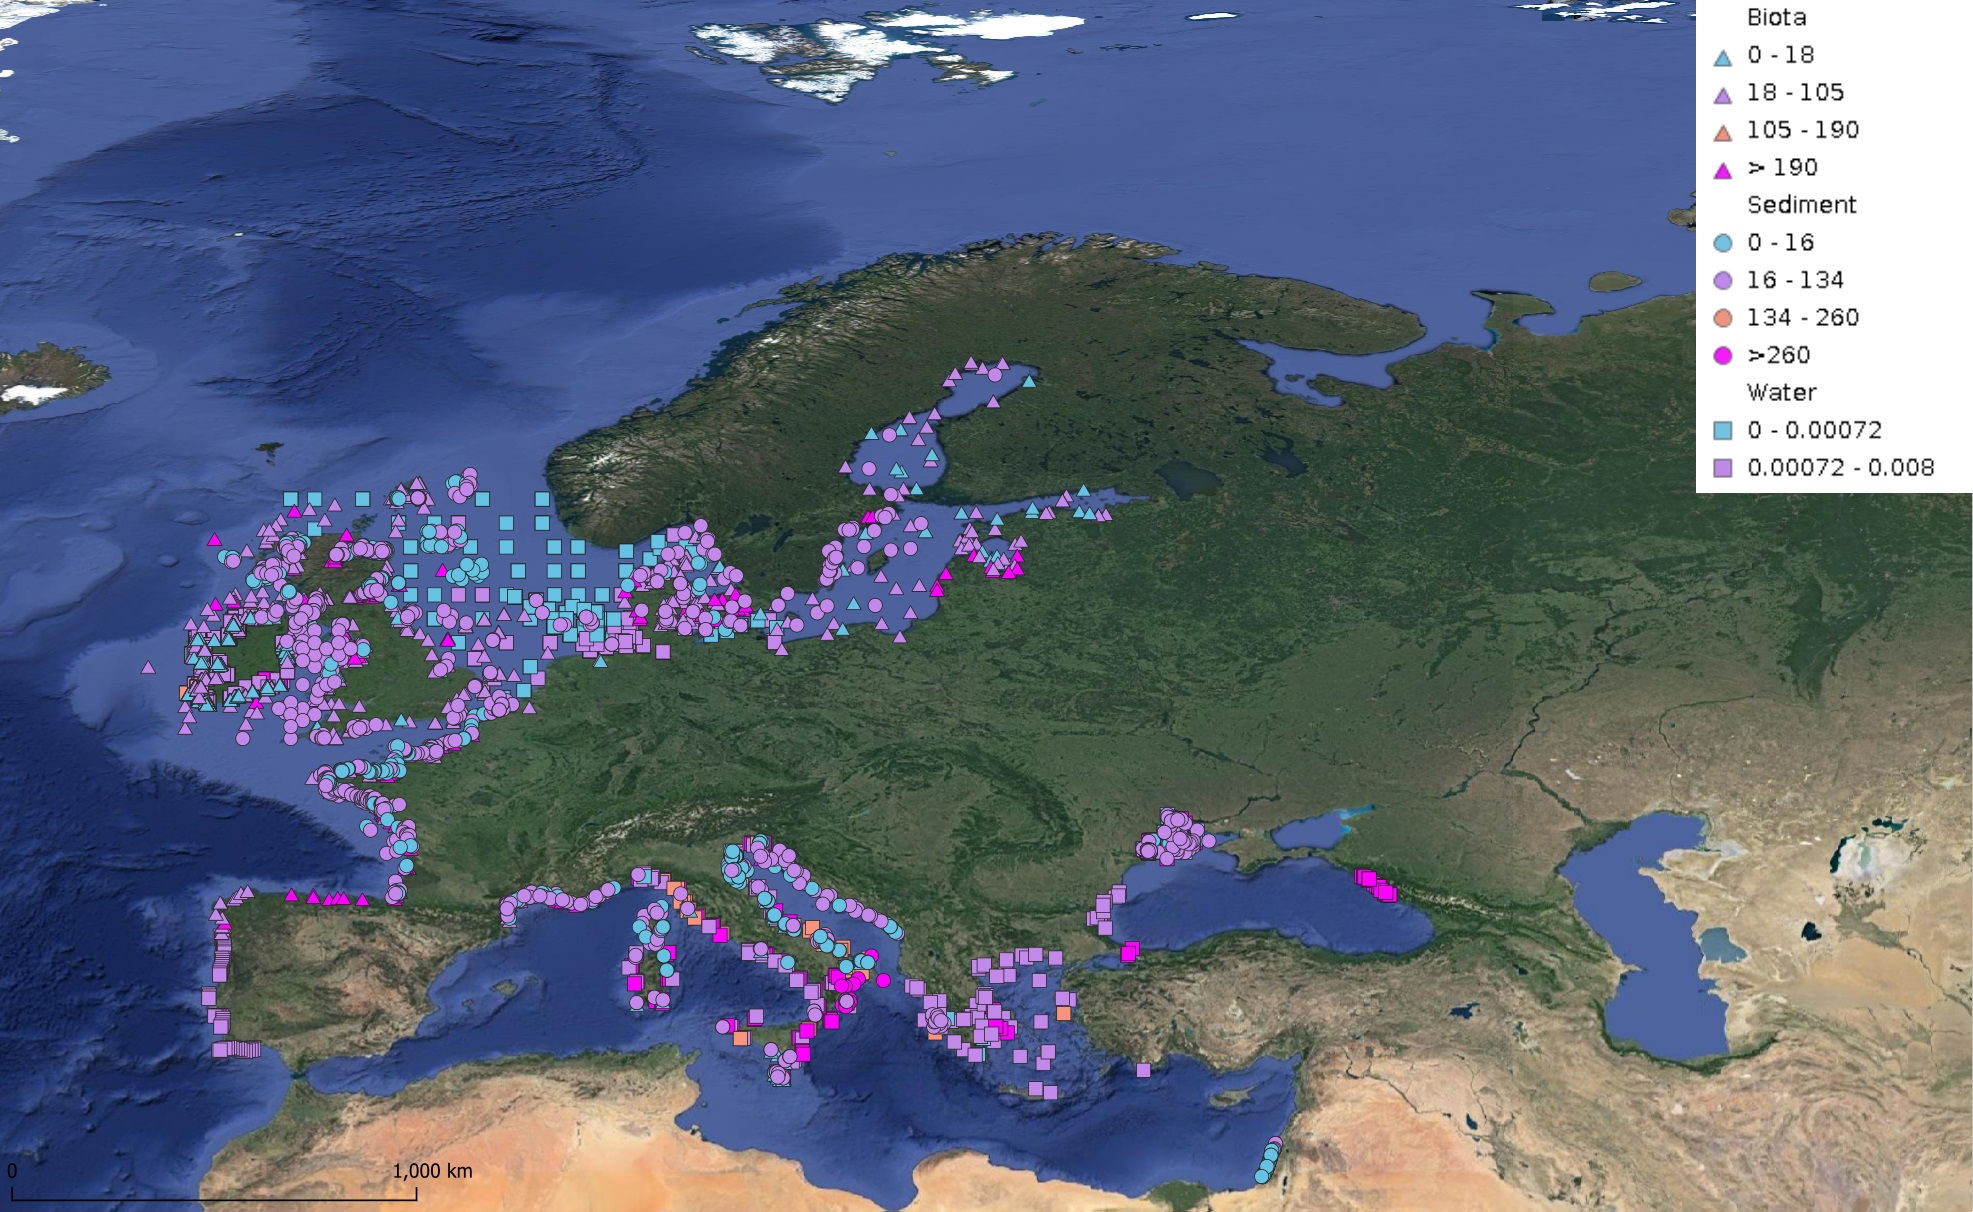
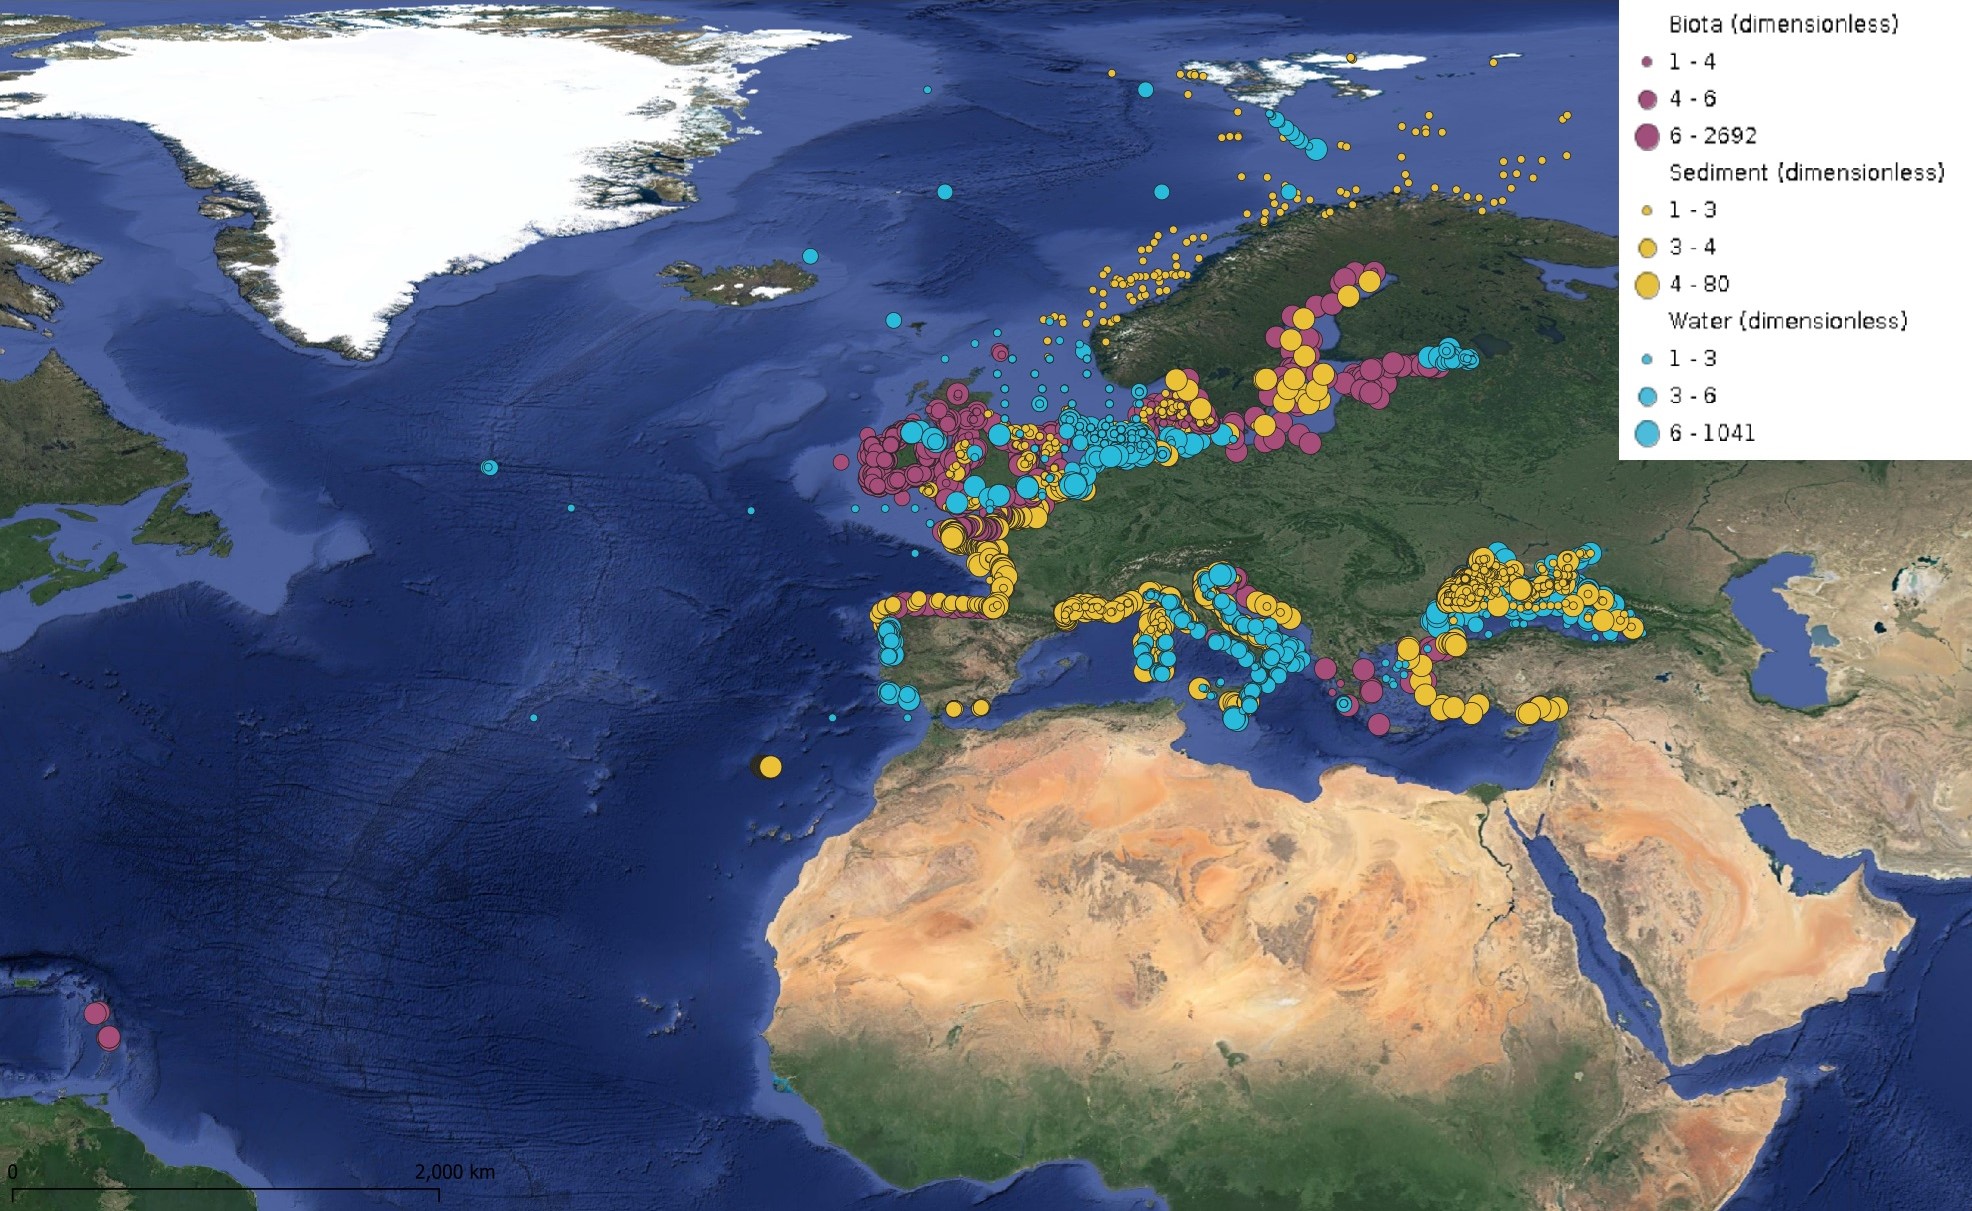
This product displays for Naphthalene, median values since 2012 that have been measured per matrix and are present in EMODnet regional contaminants aggregated datasets, v2024. The median values ranges are derived from the following percentiles: 0-25%, 25-75%, 75-90%, >90%. Only "good data" are used, namely data with Quality Flag=1, 2, 6, Q (SeaDataNet Quality Flag schema). For water, only surface values are used (0-15 m), for sediment and biota data at all depths are used.
-

This dataset contains the high-frequency total horizontal current at 15m depth on a global grid at 1/4° resolution. It is composed by the addition of two components, the first is the Geostrophic current derived by Altimetry, from the DT-2018 CMEMS database, and the second is the unsteady-Ekman ageostrophic component forced by the wind. All the details about the algorithm and the physical content of this ageostrophy component are given in the ATBD. The data are available through HTTP and FTP; access to the data is free and open. This dataset was generated by Datlas Ocean and is distributed by Ifremer / CERSAT in the frame of the World Ocean Circulation (WOC) project funded by the European Space Agency (ESA).
-
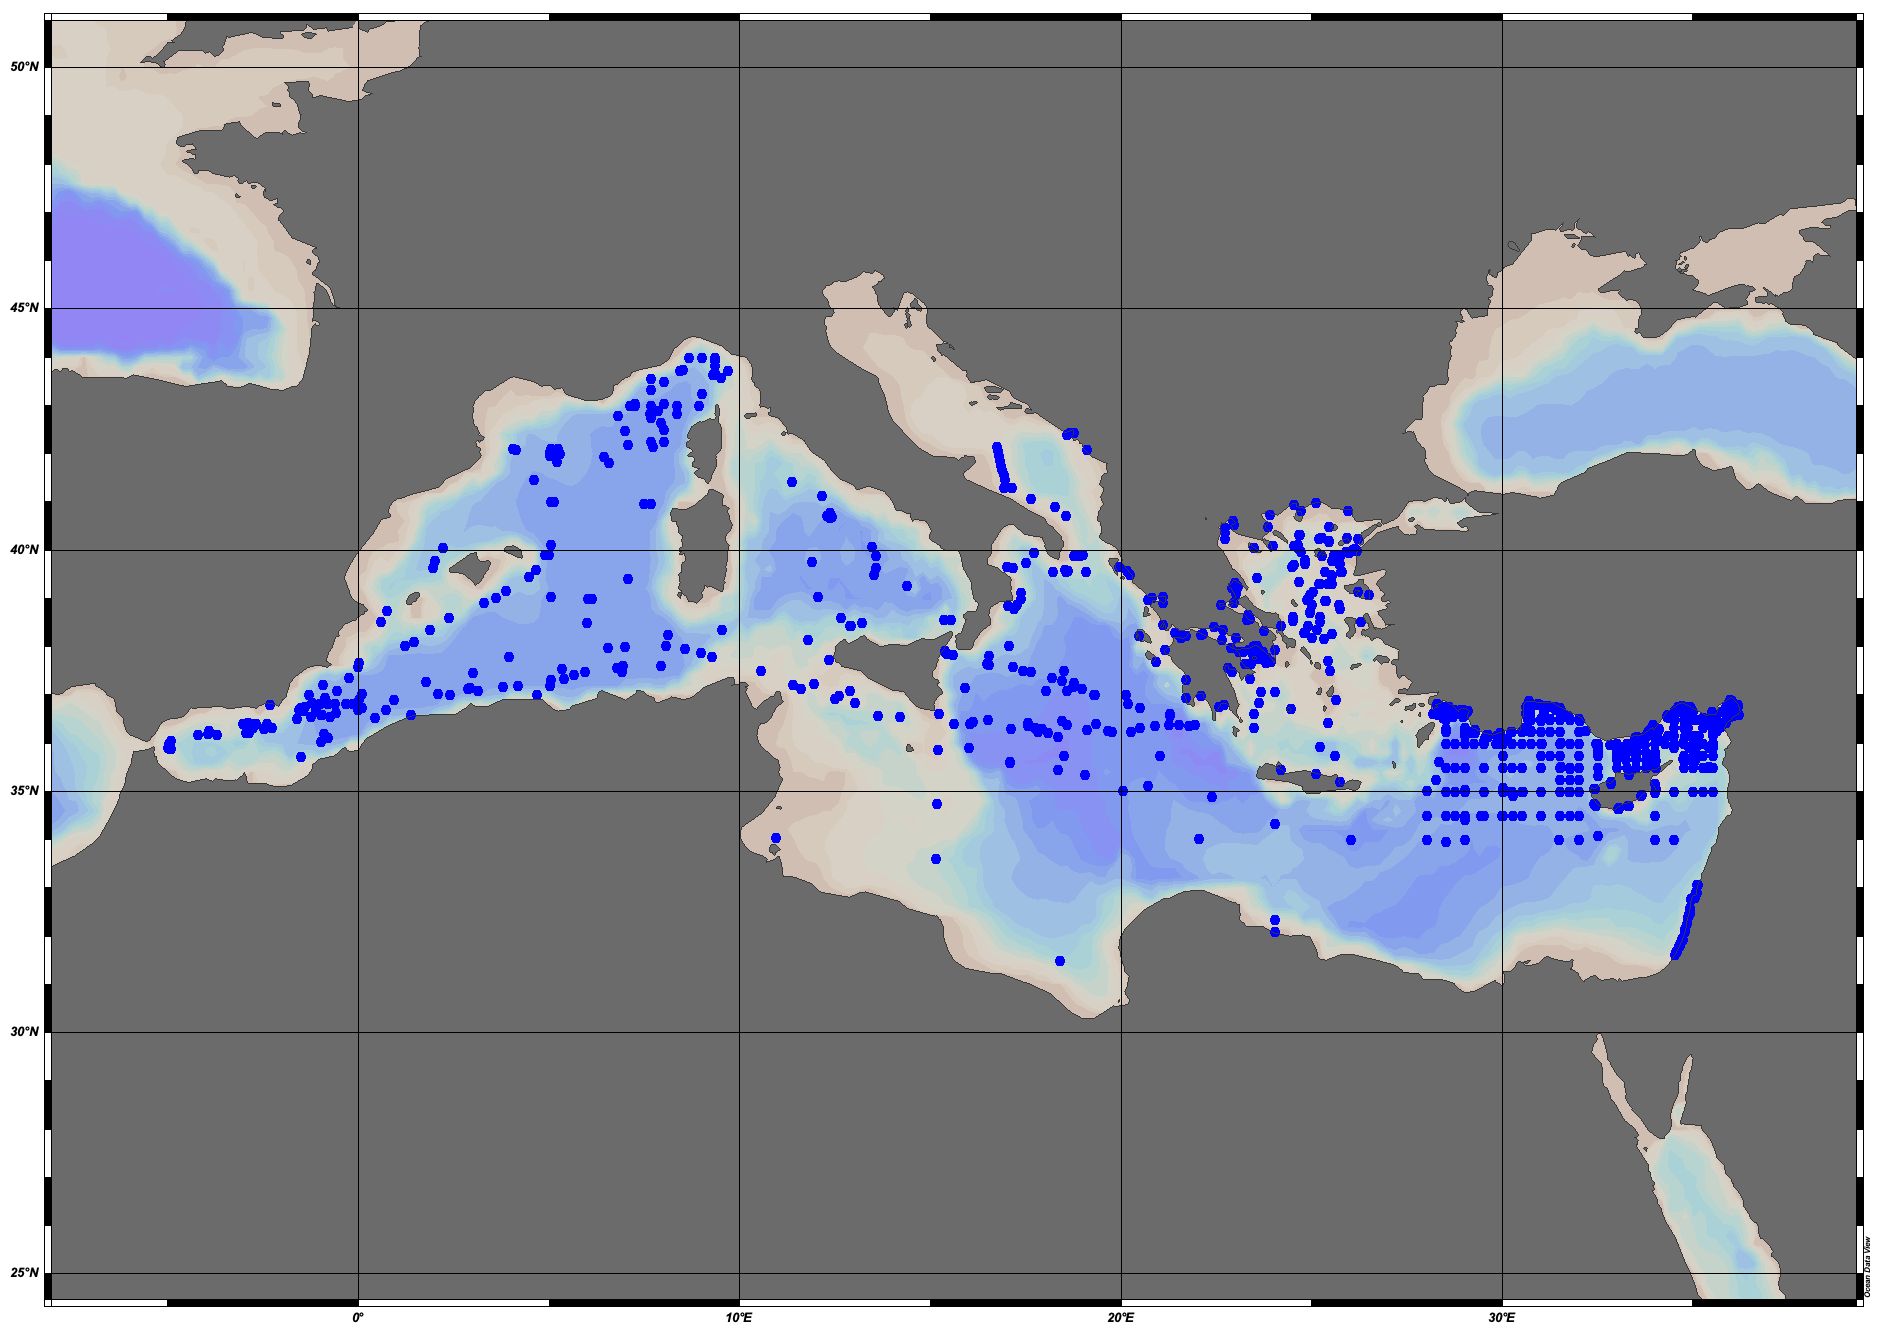
EMODnet Chemistry aims to provide access to marine chemistry data sets and derived data products concerning eutrophication, ocean acidification and contaminants. The chemicals chosen EMODnet Chemistry aims to provide access to marine chemistry datasets and derived data products concerning eutrophication, acidity and contaminants. The importance of the selected substances and other parameters relates to the Marine Strategy Framework Directive (MSFD). This aggregated dataset contains all unrestricted EMODnet Chemistry data on potential hazardous substances, despite the fact that some data might not be related to pollution (e.g. collected by deep corer). Temperature, salinity and additional parameters are included when available. It covers the Mediterranean Sea. Data were harmonised and validated by the ‘Hellenic Centre for Marine Research, Hellenic National Oceanographic Data Centre (HCMR/HNODC)’ in Greece. The dataset contains water, sediment and biota profiles and timeseries. The temporal coverage is 1974–2020 for water measurements, 1971–2020 for sediment measurements and 1979-2022 for biota measurements. Regional datasets concerning contaminants are automatically harvested and the resulting collections are harmonised and validated using ODV Software and following a common methodology for all sea regions ( https://doi.org/10.6092/8b52e8d7-dc92-4305-9337-7634a5cae3f4 ). Parameter names are based on P01 vocabulary, which relates to BODC Parameter Usage Vocabulary and is available at: https://vocab.nerc.ac.uk/search_nvs/P01/ . The harmonised dataset can be downloaded as as an ODV spreadsheet, which is composed of a metadata header followed by tab separated values. This spreadsheet can be imported into ODV Software for visualisation (more information can be found at: https://www.seadatanet.org/Software/ODV ). In addition, the same dataset is offered also as a txt file in a long/vertical format, in which each P01 measurement is a record line. Additionally, there are a series of columns that split P01 terms into subcomponents (substance, CAS number, matrix...).This transposed format is more adapted to worksheet applications (e.g. LibreOffice Calc).
-
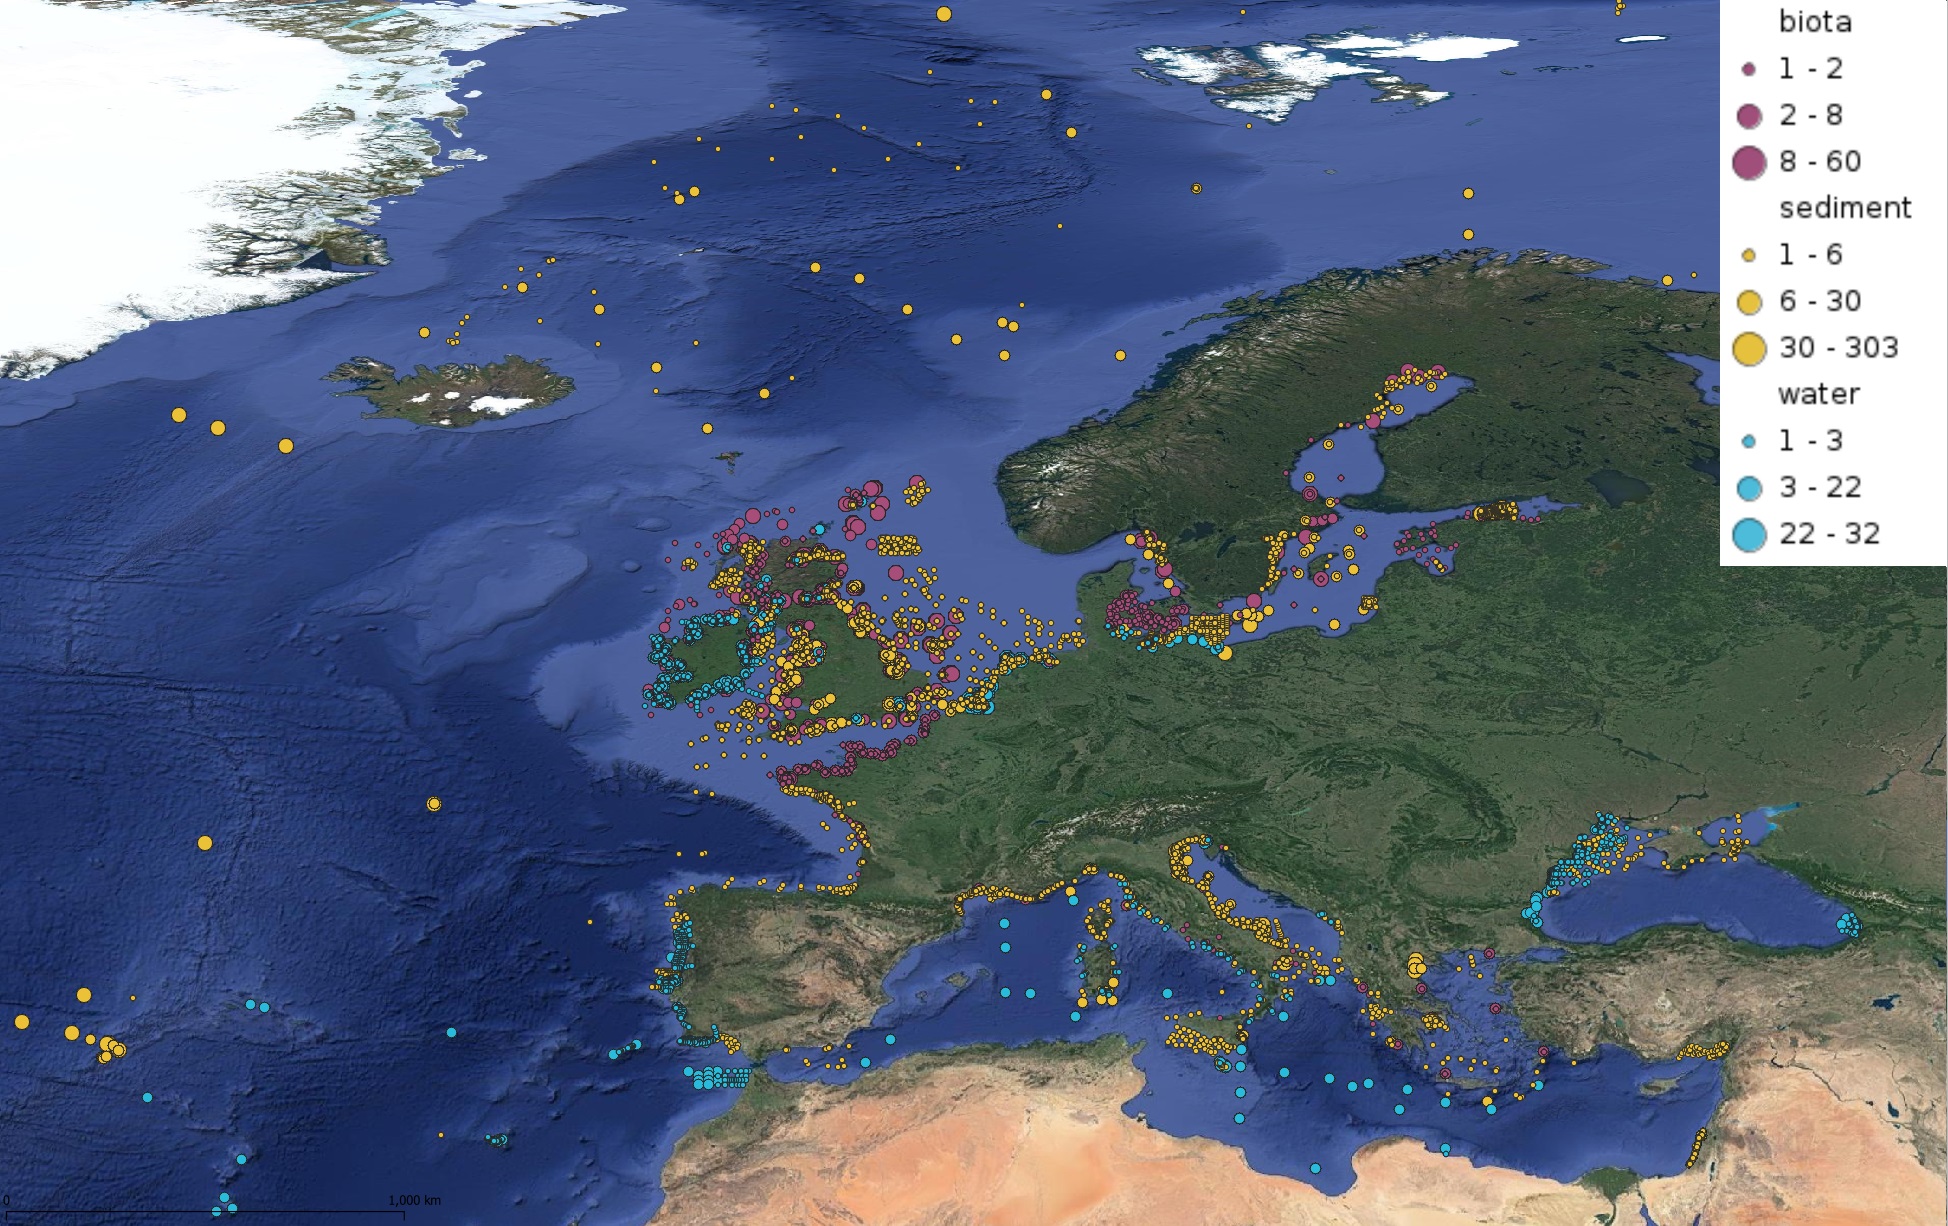
This product displays for Nickel, positions with values counts that have been measured per matrix and are present in EMODnet regional contaminants aggregated datasets, v2022. The product displays positions for all available years.
-
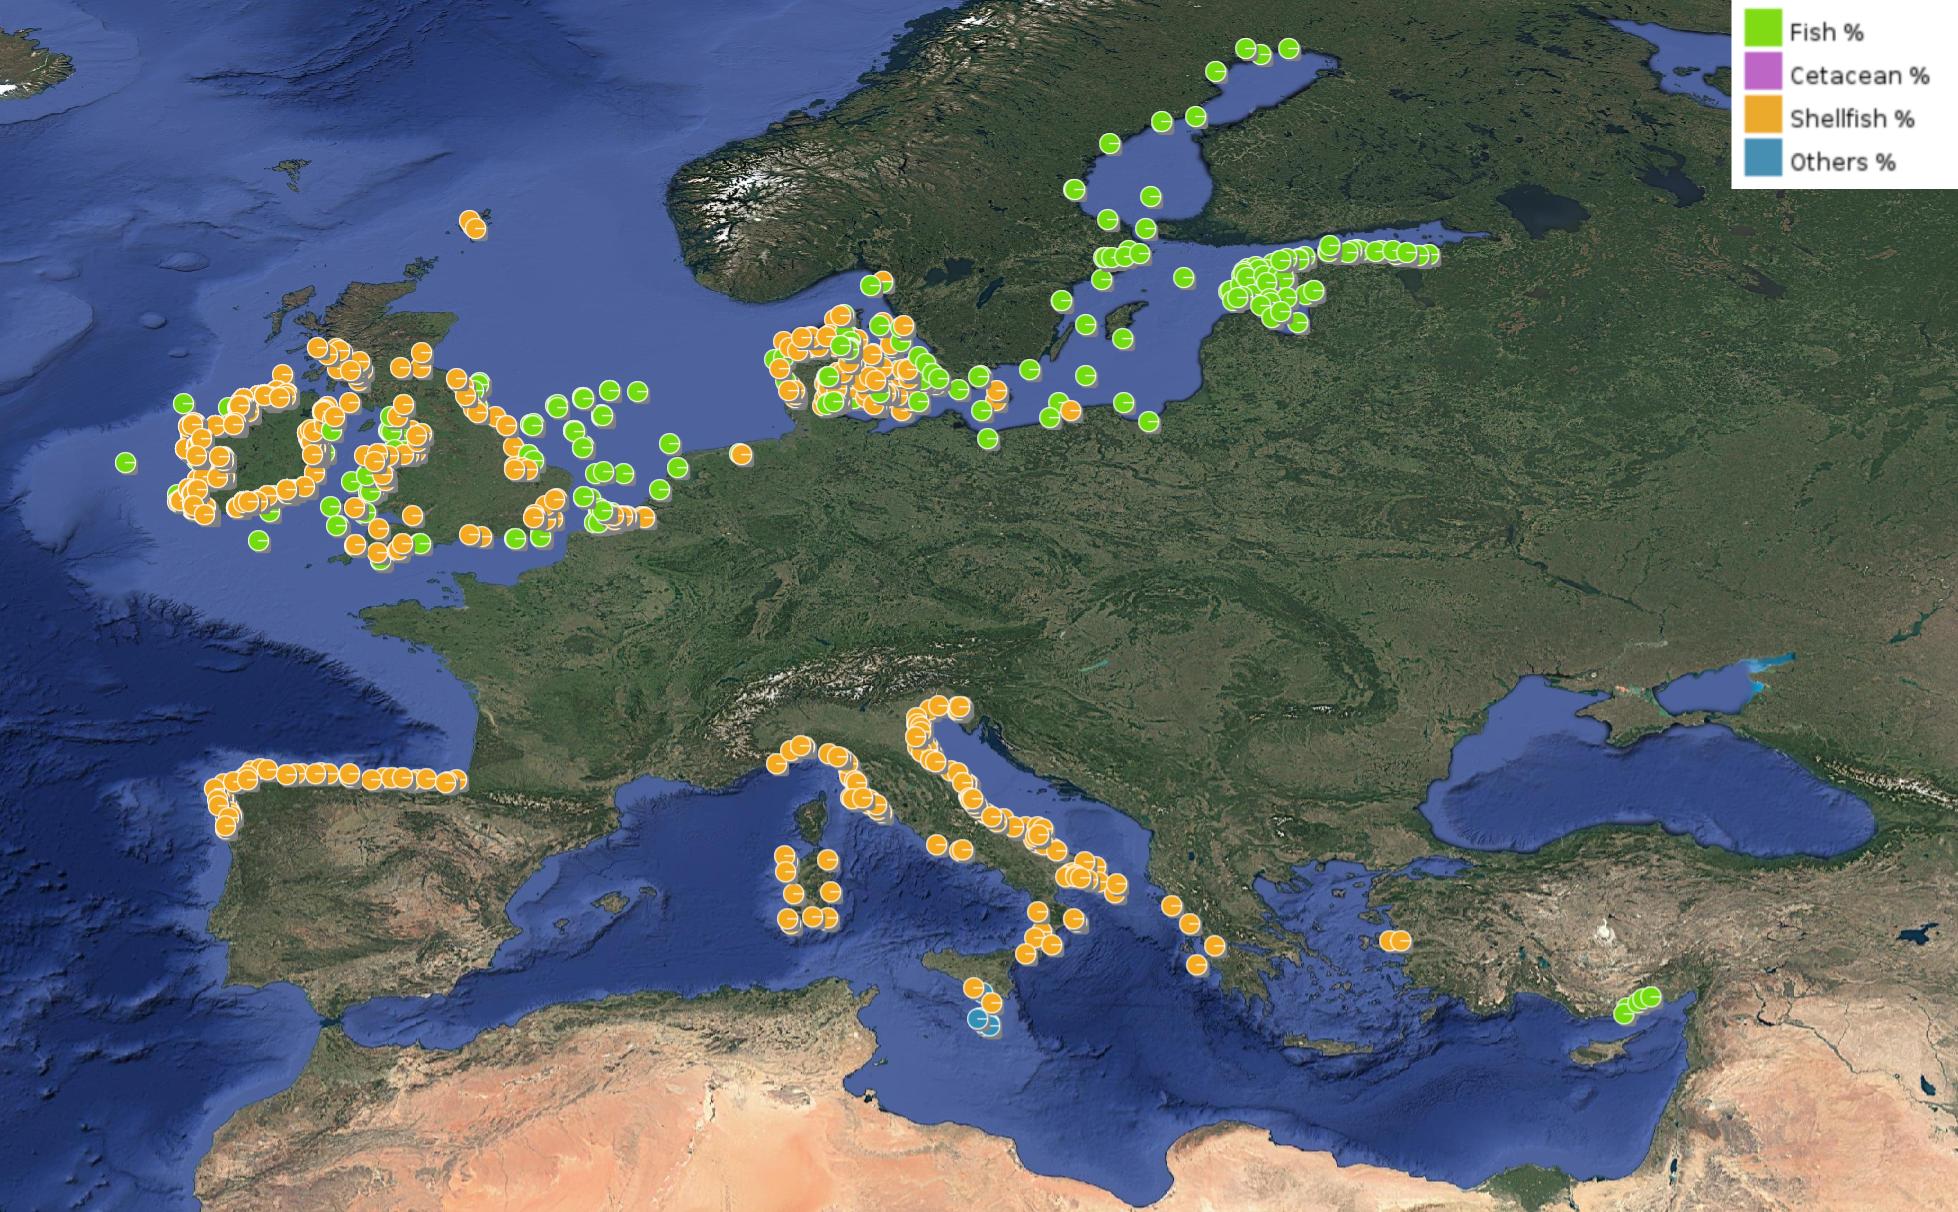
This product displays for Hexachlorobenzene, positions with percentages of all available data values per group of animals that are present in EMODnet regional contaminants aggregated datasets, v2024. The product displays positions for all available years.
-
This product displays for DDT, DDE, and DDD, positions with values counts that have been measured per matrix for each year and are present in EMODnet regional contaminants aggregated datasets, v2024. The product displays positions for every available year.
-
Unveiling the implications of hybridization on fitness stands as a primary focus in the realms of ecology and evolution. Numerous investigations elucidate how evolutionary mechanisms regulate the intricate pattern of introgression across genomes, yet few have examined the consequential impact of genetic admixture on fitness attributes. Leveraging the Western Mediterranean population of the European seabass (Dicentrarchus labrax), a population formed through hybridization of the Atlantic and Mediterranean lineages in the Alboran Sea, we utilized the Axiom Sea Bass 57k SNP DlabChip array to genotype 1850 hybrid individuals. This enabled us to evaluate the correlation between individual admixture levels and fitness traits under varying thermal conditions (19°C, 21°C, 23°C, and 25°C). Our initial findings unveil a male-biased sex ratio and high temperature sensitivity among admixed individuals with a greater proportion of Atlantic ancestry. Subsequently, our analysis demonstrates that individuals with a higher Atlantic genetic background also exhibit reduced body weight (a parameter linked to fecundity in fish) compared to those with lower Atlantic ancestry. These outcomes underscore the disadvantageous nature of Atlantic ancestry introgression in the Mediterranean region, aligning with previous observations of the elimination of Atlantic ancestry segments subsequent to hybridization.
-
The Surface Ocean CO₂ Atlas (SOCAT) is a synthesis activity for quality-controlled, surface ocean fCO₂ (fugacity of carbon dioxide) observations by the international marine carbon research community (>100 contributors). SOCAT data is publicly available, discoverable and citable. SOCAT enables quantification of the ocean carbon sink and ocean acidification and evaluation of ocean biogeochemical models. SOCAT, which celebrated its 10th anniversary in 2017, represents a milestone in biogeochemical and climate research and in informing policy. SOCAT data are released in versions. Each succeeding version contains new data sets as well as updates of older ones. The first version of SOCAT was released in 2011, the second and third version followed biennially. Automation allowed annual public releases since version 4. The latest SOCAT version (version 2022) has 35.6 million observations from 1957 to 2022 for the global oceans and coastal seas. 7.2 million calibrated sensor observations are also available. SOCAT version 2023 was released on the 20th of June 2023, containing data submitted on or before 15th of January 2023. New data submissions are welcome at any time, and will be included in the next SOCAT release. The submission deadline for v2024 is 15 January 2024. SOCAT is a core Global Ocean Observing System data product for biogeochemistry endorsed by the Global Ocean Observing System GOOS.
-

'''Short description:''' Arctic L3 sea ice product providing concentration, stage-of-development and floe size information retrieved from Sentinel-1 and RCM SAR imagery and GCOM-W AMSR2 microwave radiometer data using a deep learning algorithm and delivered on a 0.5 km grid. '''DOI (product) :''' https://doi.org/10.48670/mds-00343
-

'''Short description:''' Arctic L4 sea ice concentration product based on a L3 sea ice concentration product retrieved from Sentinel-1 and RCM SAR imagery and GCOM-W AMSR2 microwave radiometer data using a deep learning algorithm (SEAICE_ARC_PHY_AUTO_L3_MYNRT_011_023), gap-filled with OSI SAF EUMETSAT sea ice concentration products and delivered on a 1 km grid. '''DOI (product) :''' https://doi.org/10.48670/mds-00344