 Catalogue PIGMA
environment
Type of resources
Available actions
Topics
Keywords
Contact for the resource
Provided by
Years
Formats
Representation types
Update frequencies
status
Scale
Resolution
-
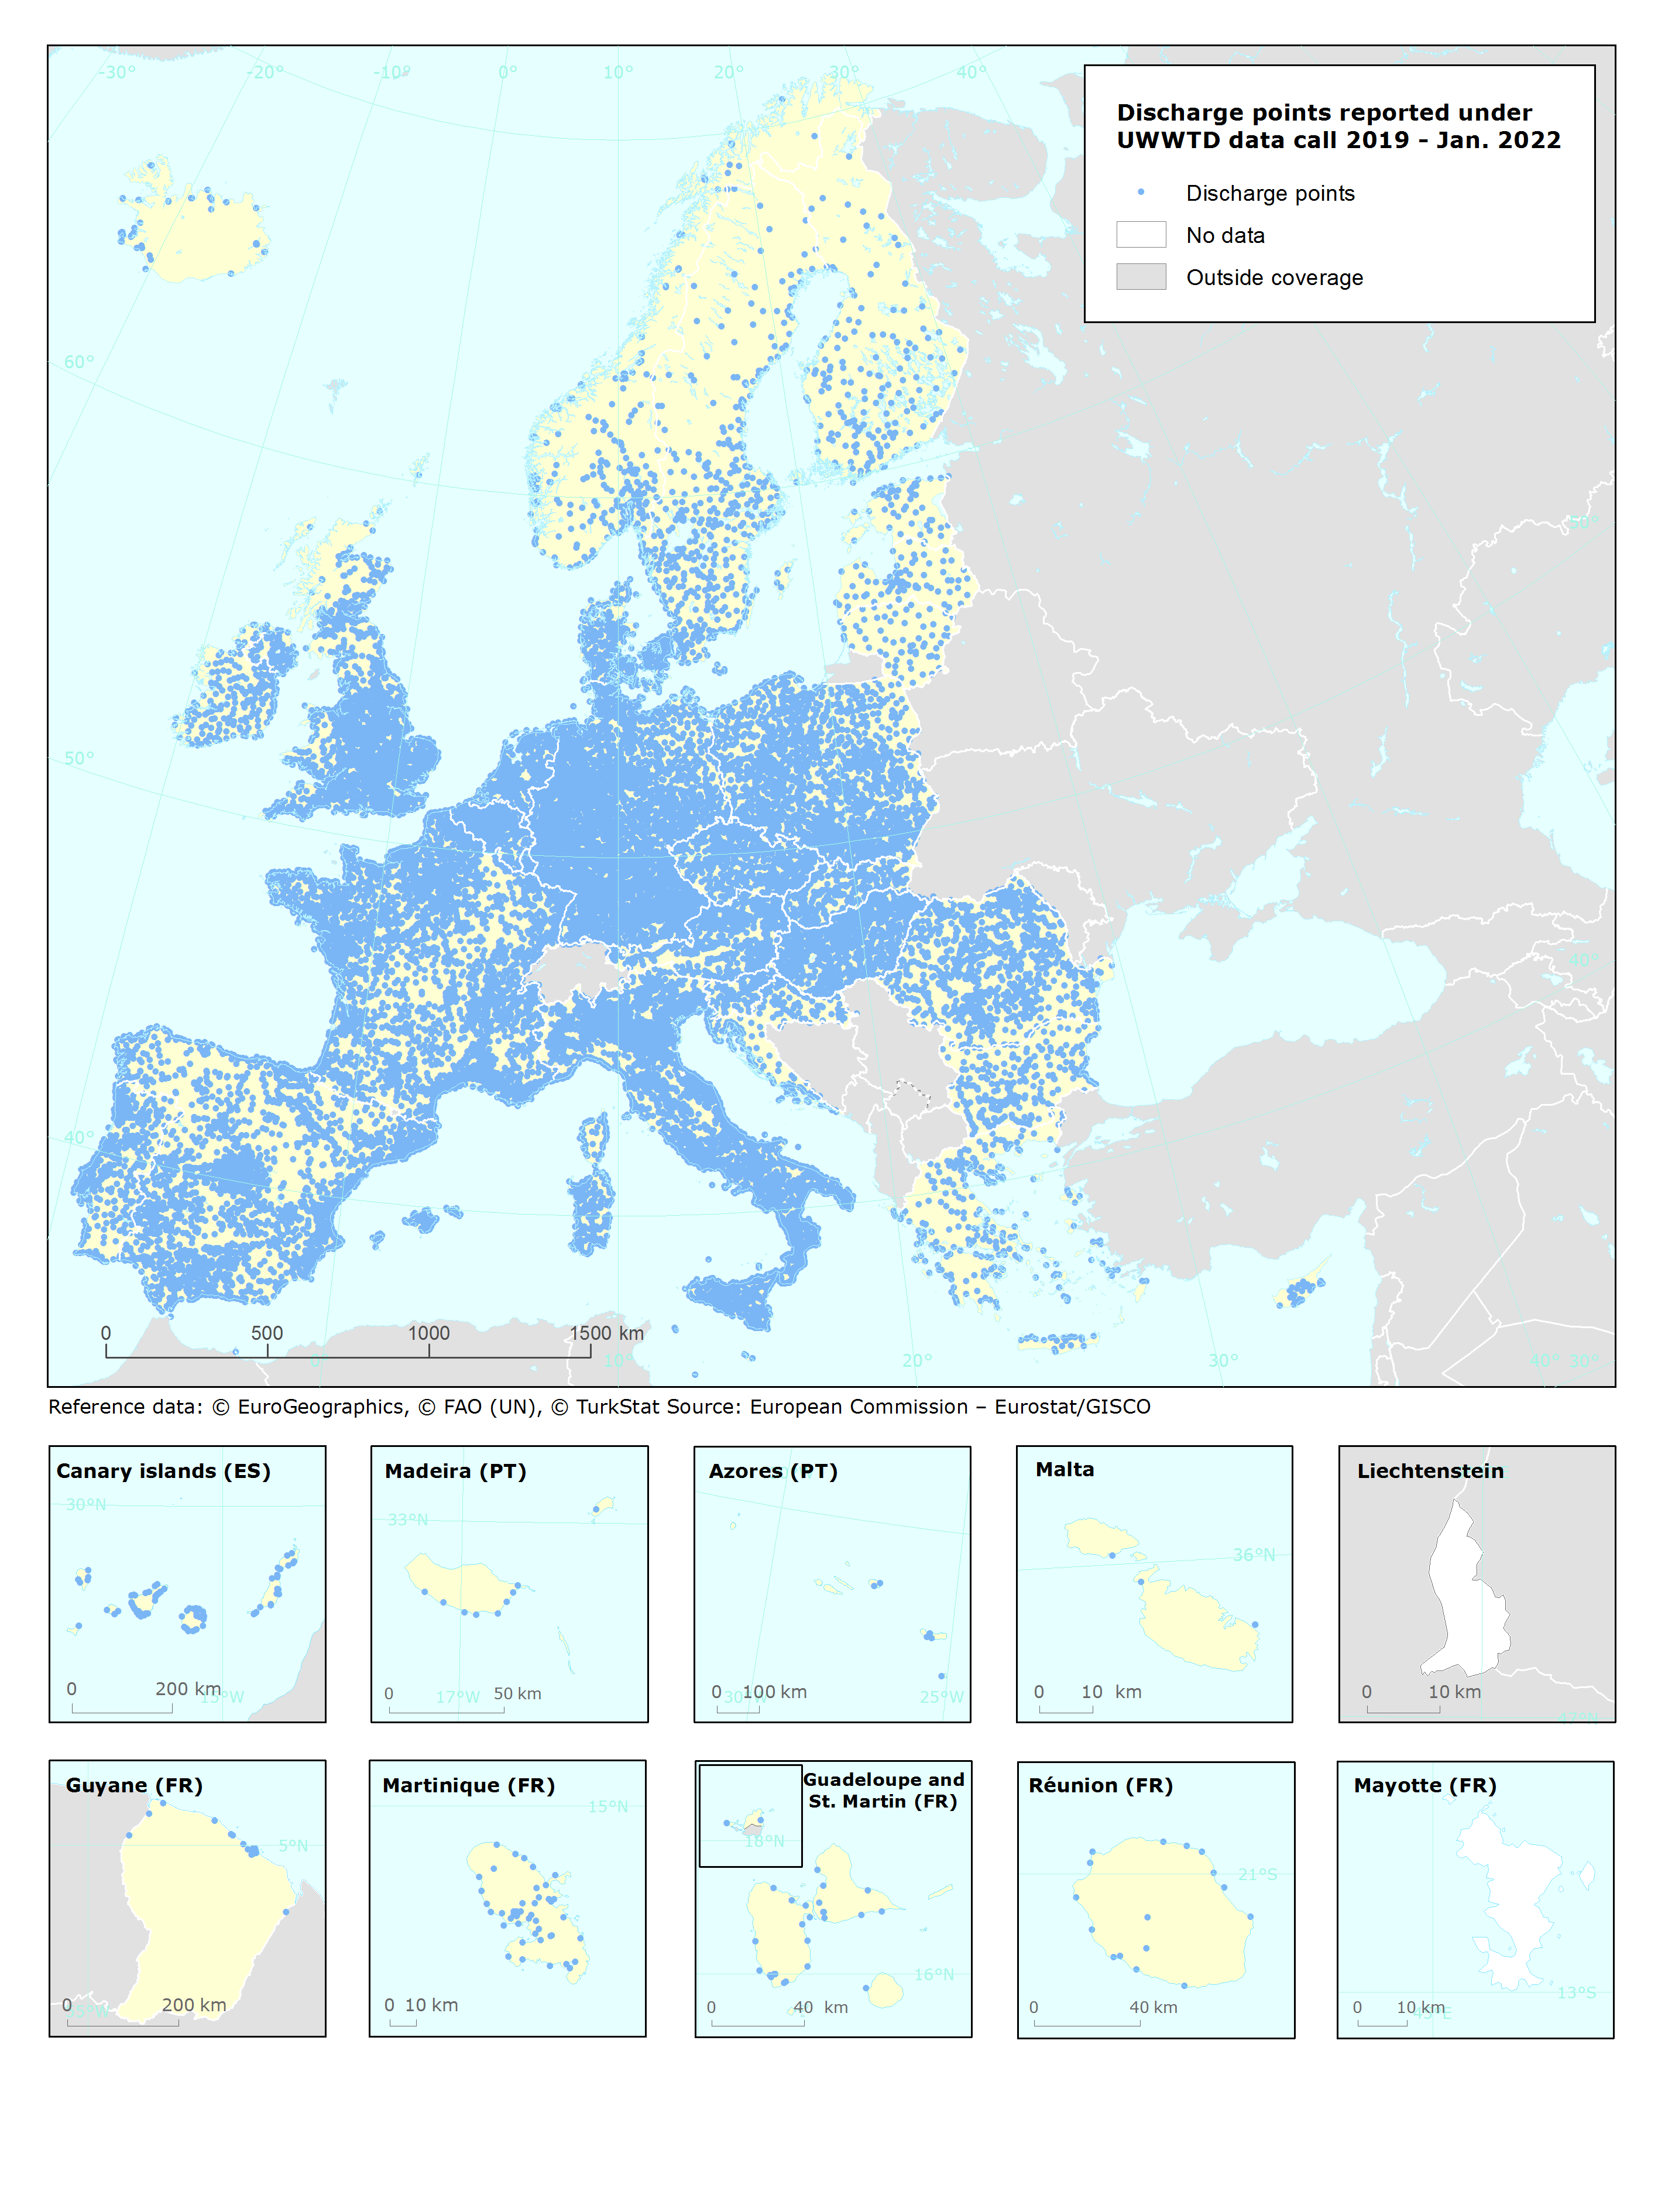
UWWTD Discharge Points, Jan. 2022 is one of the datasets produced within the frame of the reporting under 11th UWWTD Art.15 reporting period (UWWTD data call 2019). The Urban Waste Water Treatment Directive (UWWTD) (91/271/EEC) obliges Member States to report data on the implementation of the Directive upon request from the European Commission bi-annually. Reported data include receiving areas as designated under UWWTD, agglomerations, urban waste water treatment plants serving the agglomerations and points of discharges. Dataset UWWTD_DischargePoints contains information on individual points of discharge from urban waste water treatment plants or collecting systems, including their coordinates of discharge, link to specific treatment plant, type of receiving area into which the effluent / wastewater is discharged, related waterbody (or river basin), information on the discharge on land and potential reuse of the treated waste water. This dataset includes the reported discharge points which are displayed on the UWWTD maps (https://www.eea.europa.eu/themes/water/european-waters/water-use-and-environmental-pressures/uwwtd/interactive-maps/urban-waste-water-treatment-maps-3). The active discharge points with correct coordinates in the reported data were selected from the source European UWWTD tabular dataset, which is available on the download link https://www.eea.europa.eu/data-and-maps/data/waterbase-uwwtd-urban-waste-water-treatment-directive-7. The definition of the UWWTD Discharge Points dataset attributes (fields) is available on the link https://dd.eionet.europa.eu/datasets/latest/UWWTDArt15/tables/DischargePoints The full (internal) dataset including inactive discharge points is available under "Urban Waste Water Treatment Directive, Discharge points reported under UWWTD data call 2019 - INTERNAL VERSION, Jan. 2022". In comparison to the previous version (Nov. 2020), late redeliveries and corrections provided by several countries during 2021 are included in current revision. Next, the dataset is provided in GeoPackage and ESRI File geodatabase formats instead of shapefile used up to now, to avoid truncation of attribute names.
-

Ce document se décompose en deux parties: La première énonce les valeurs et fonctions du massif forestier communes à tous les acteurs concernés par son avenir. La seconde présente les pressions et les enjeux qui pèsent sur le massif forestier des Landes de Gascogne.
-

Les ministères chargés de l'écologie (Meeddm) et de l'agriculture (Maap) ont confié au Gip Ecofor une mission d'expertise collective scientifique et technique à visée prospective sur « l'avenir du massif forestier des Landes de Gascogne ». Son objectif est de mobiliser la connaissance autour d'options envisageables pour assurer l'avenir du massif forestier landais et de la partager avec l'ensemble des parties intéressées. Les document disponibles sont les rapports finaux des groupes de travail et d'experts.
-
Shom manages a network of permanent digital coastal tide-gauges on French coasts: the RONIM Sea Level Observation Network. Most tide-gauge observatories are partnered with one or more local partners.<br /><br /> Four main types of data are available for download:<br /> - “Raw high frequency" data: raw observations neither validated nor evaluated, obtained directly from the sensor. 1-minute measurement; integration time 15 seconds (on the minute); sampling period: 1 second.<br /><br /> - "Raw non-real time" data: raw observations neither validated nor evaluated, obtained directly from the sensor. 10-minute measurement; integration time 121 seconds (around every 10 minutes); sampling period: 1 second.<br /><br /> - "Validated non-real time" data: observations checked and validated by Shom from the "Raw non-real time" data. 10-minute measurement; integration time 121 seconds (around every 10 minutes); sampling period: 1 second.<br /><br /> - "Validated hourly" data: observations checked and validated by Shom, generated from "Validated non-real time" data. Hourly measurement obtained from the Vondrak filter with triangular weighting. The hourly height cannot be calculated in the event of an observation gap greater than 1.5 hours.
-
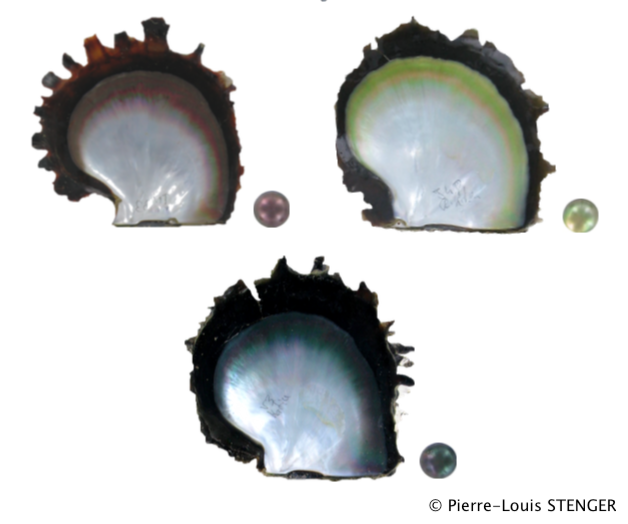
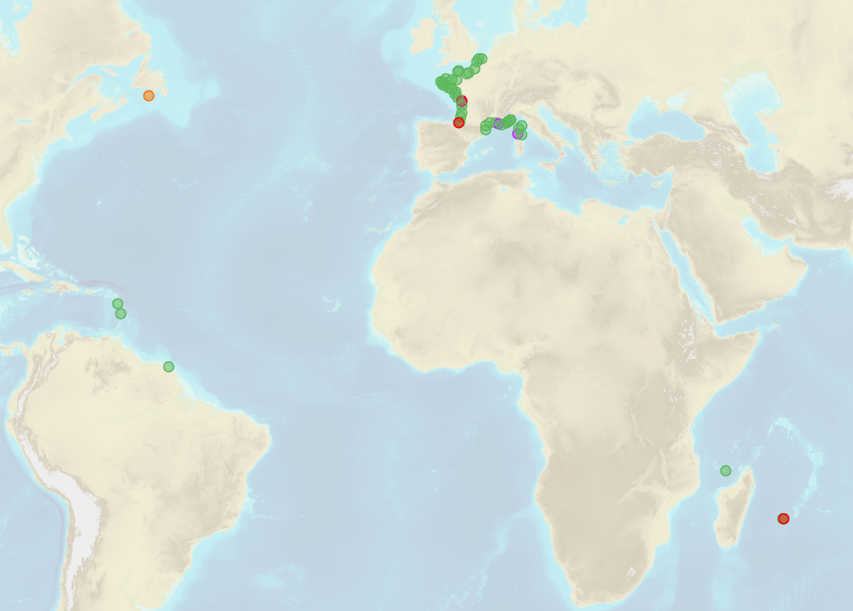
Whole genome pooled sequencing of individuals from 4 populations and 3 different color phenotype in order to uncover the genetic variants linked to color expression in the pearl oyster P. margaritifera.
-
PPRIF
-
L’objectif de cette étude est d’illustrer à l’aide d’indicateurs les conséquences de choix de gestion imposés par cinq scénarios socioéconomiques prospectifs appliqués à une large zone forestière pour les 60 prochaines années. Le cas d’étude choisi est la zone centrée sur la commune de Pontenx-les-Forges dans le sud-ouest de la France et couvrant 101000 hectares. Cet article présente une description de la zone d’étude et des itinéraires sylvicoles mis en œuvre par les propriétaires forestiers selon des scénarios. À l’aide d’un simulateur pilotant deux modèles de croissance, l’évolution de la zone d’étude à l’échelle de chaque parcelle est synthétisée par 9 indicateurs sur une période de 60 ans : le volume sur pied, le carbone sur pied, le volume total exploité, la valeur commerciale sur pied, le volume de l’arbre moyen, la vulnérabilité au vent et au feu, et des indices de biodiversité. Un des principaux résultats de cette étude est de montrer l’amplitude des changements pour la production et le volume sur pied : selon les scénarios les récoltes annuelles peuvent varier de 50 % dès 2030. Par conséquent, d’autres indicateurs sont impactés comme la biodiversité, la vulnérabilité au vent ou au feu. Pourtant, l’espèce dominante est maintenue et le comportement partiellement conservateur des types de propriétaires est pris en compte. En conclusion, des améliorations pour de futures simulations sont envisagées ; dans ce but, des synergies avec la télédétection sont nécessaires pour la collecte des données d’initialisation sur de larges territoires, ce qui permettra d’améliorer la précision des résultats.
-

Première utilisation du sol, devant l'agriculture et loin devant l'urbanisme, la forêt couvre 45 % du territoire aquitain. La région se caractérise par la domination d'une essence, le pin maritime. Celui-ci couvre plus de la moitié de la surface forestière régionale. Outre sa valeur patrimoniale, cette forêt génère une activité économique qui représente environ 3 milliards d'euros. Ce secteur forêt-bois est donc un formidable gisement d'emplois, principalement en milieu rural. Cet espace occupé par la forêt attise néanmoins des convoitises pour différents types d'usage: l'urbanisation, les installations photovoltaïques ou encore l'agriculture.
-

L’objectif général de ce projet de thèse est d’analyser et d’évaluer les données sources (actuelles et potentielles) des matrices de changements d’occupation du sol afin d’améliorer la robustesse de l’inventaire. Il s’agit d’expertiser par une démarche scientifique la pertinence des travaux réalisés annuellement pour l’inventaire UTCATF. En particulier, il s’agit de comprendre les causes des incertitudes des données sources ; compiler les données disponibles et leurs métadonnées ; étudier qualitativement les dynamiques paysagères décrites ; et redéfinir un cadre méthodologique permettant d’estimer des taux de changements plus pertinent.
-

Here, our study aimed to first assess the influence of plastic on the bacterial community belonging to water, plastic and the microbiome of the giant clam and on the organism's physiology of this putative sentinel species. Our second objective was to identify bacteria whose abundance varies significantly with plastic concentration. Overall, this study will fill the gap towards a better understanding of the impact of plastic pollution on bacterial community assemblages in both inert and living environments.