 Catalogue PIGMA
Type of resources
Available actions
Topics
Keywords
Contact for the resource
Provided by
Years
Formats
Representation types
Update frequencies
status
Service types
Scale
Resolution
-

'''Short description:''' Global Ocean- in-situ Near Real time Carbon observations. The In Situ Thematic Assembly Centre (INS TAC) integrates near real-time in situ observation data. This Near-Real Time product contains observations of temperature, salinity and fugacity of carbon dioxide from the surface ocean. These data are collected from ICOS Ocean Thematic Centre (https://otc.icos-cp.eu/home) operational stations, using Standard Operating Procedures for the ocean carbon community. The data are quality controlled using the software QuinCe, which provides automatic Quality Control in the form of range checks, constant value and excessive gradient detection. This product is updated with new observations at a maximum frequency of once a day, depending on the connection capabilities of the platform.
-
This product displays the stations where anthracene has been measured and the values present in EMODnet Chemistry infrastructure are always below the limit of detection or quantification (LOD/LOQ), i.e quality values found in EMODnet validated dataset can be equal to 6 or Q. It is necessary to take into account that LOD/LOQ can change with time. These products aggregate data by station, producing only one final value for each station (above, below or above/below). EMODnet Chemistry has included the gathering of contaminants data since the beginning of the project in 2009. For the maps for EMODnet Chemistry Phase III, it was requested to plot data per matrix (water,sediment, biota), per biological entity and per chemical substance. The series of relevant map products have been developed according to the criteria D8C1 of the MSFD Directive, specifically focusing on the requirements under the new Commission Decision 2017/848 (17th May 2017). The Commission Decision points to relevant threshold values that are specified in the WFD, as well as relating how these contaminants should be expressed (units and matrix etc.) through the related Directives i.e. Priority substances for Water. EU EQS Directive does not fix any threshold values in sediments. On the contrary Regional Sea Conventions provide some of them, and these values have been taken into account for the development of the visualization products. To produce the maps the following process has been followed: 1. Data collection through SeaDataNet standards (CDI+ODV) 2. Harvesting, harmonization, validation and P01 code decomposition of data 3. SQL query on data sets from point 2 4. Production of map with each point representing at least one record that match the criteria The harmonization of all the data has been the most challenging task considering the heterogeneity of the data sources, sampling protocols. Preliminary processing were necessary to harmonize all the data : • For water: contaminants in the dissolved phase; • For sediment: data on total sediment (regardless of size class) or size class < 2000 μm • For biota: contaminant data will focus on molluscs, on fish (only in the muscle), and on crustaceans • Exclusion of data values equal to 0
-
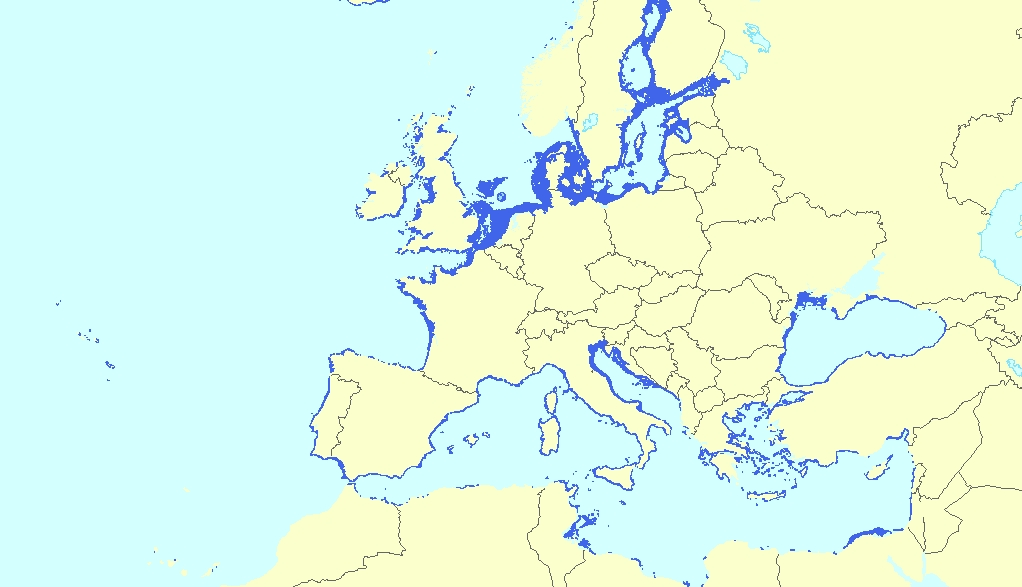
This vector dataset represents the benthic broad habitat types in Europe Seas potentially affected by the ship wakes. When navigating, the propellers of ships generate a turbulent mixing of the water that can produce sediment re-suspension in soft bottoms of shallow areas. This can increase the turbidity in those areas, affecting the seafloor organisms (especially those that are directly dependent on light, such as aquatic plants). It may also contribute to an increase of the the eutrophication level of the ecosystem (since the turbid waters may become warmer, which may turn into a reduction of dissolved oxygen in water). Finally, turbidity can produce an increase in the inputs of contaminants and microbial pathogens, since those can become attached to the suspended solids. The dataset has been prepared in the context of the development of the first European Maritime Transport Environmental Report (https://www.eea.europa.eu/publications/maritime-transport).
-
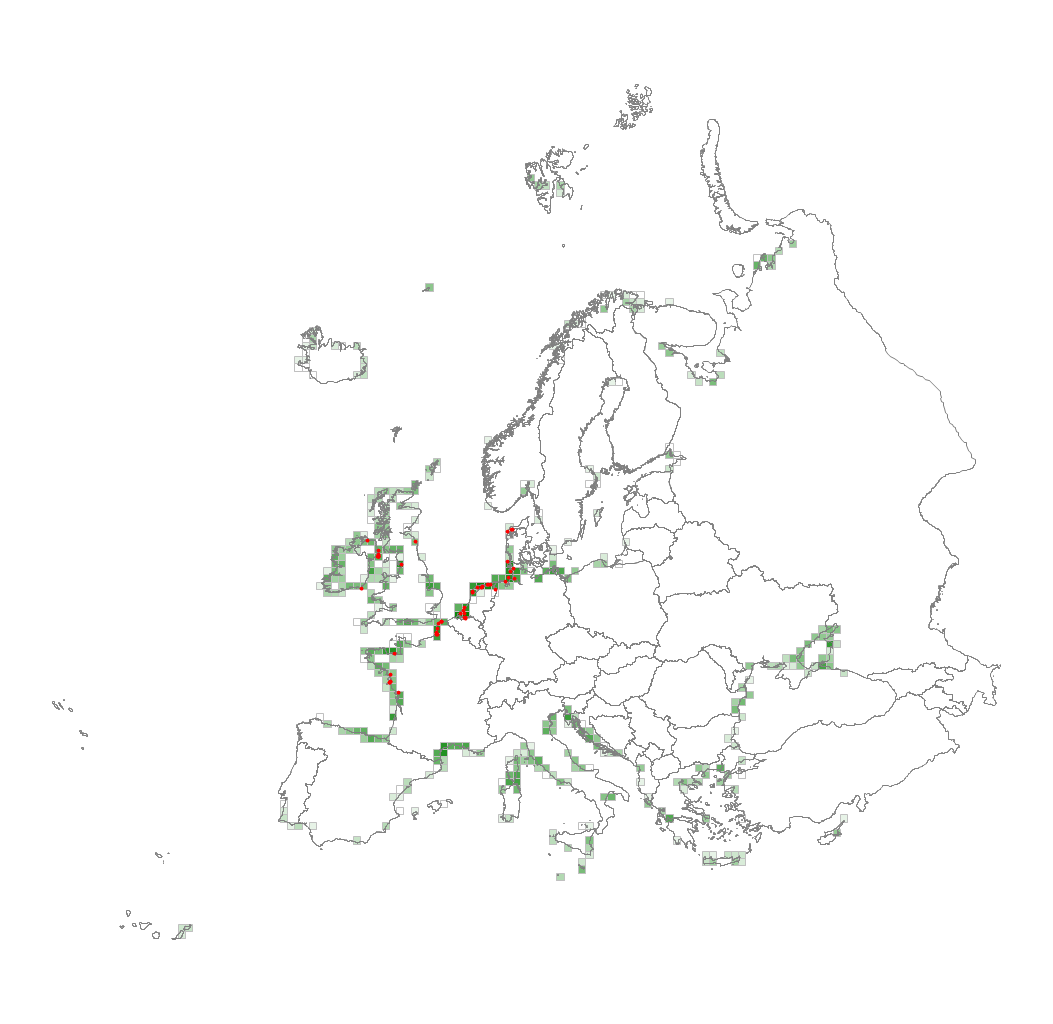
This visualization product displays plastic bags density per trawl. EMODnet Chemistry included the collection of marine litter in its 3rd phase. Since the beginning of 2018, data of seafloor litter collected by international fish-trawl surveys have been gathered and processed in the EMODnet Chemistry Marine Litter Database (MLDB). The harmonization of all the data has been the most challenging task considering the heterogeneity of the data sources, sampling protocols (OSPAR and MEDITS protocols) and reference lists used on a European scale. Moreover, within the same protocol, different gear types are deployed during fishing bottom trawl surveys. In cases where the wingspread and/or number of items were unknown, data could not be used because these fields are needed to calculate the density. Data collected before 2011 are affected by this filter. When the distance reported in the data was null, it was calculated from: - the ground speed and the haul duration using this formula: Distance (km) = Haul duration (h) * Ground speed (km/h); - the trawl coordinates if the ground speed and the haul duration were not filled in. The swept area is calculated from the wingspread (which depends on the fishing gear type) and the distance trawled: Swept area (km²) = Distance (km) * Wingspread (km) Densities have been calculated on each trawl and year using the following computation: Density of plastic bags (number of items per km²) = ∑Number of plastic bags related items / Swept area (km²) Percentiles 50, 75, 95 & 99 have been calculated taking into account data for all years. The list of selected items for this product is attached to this metadata. Information on data processing and calculation is detailed in the attached methodology document. Warning: the absence of data on the map doesn't necessarily mean that they don't exist, but that no information has been entered in the Marine Litter Database for this area.
-
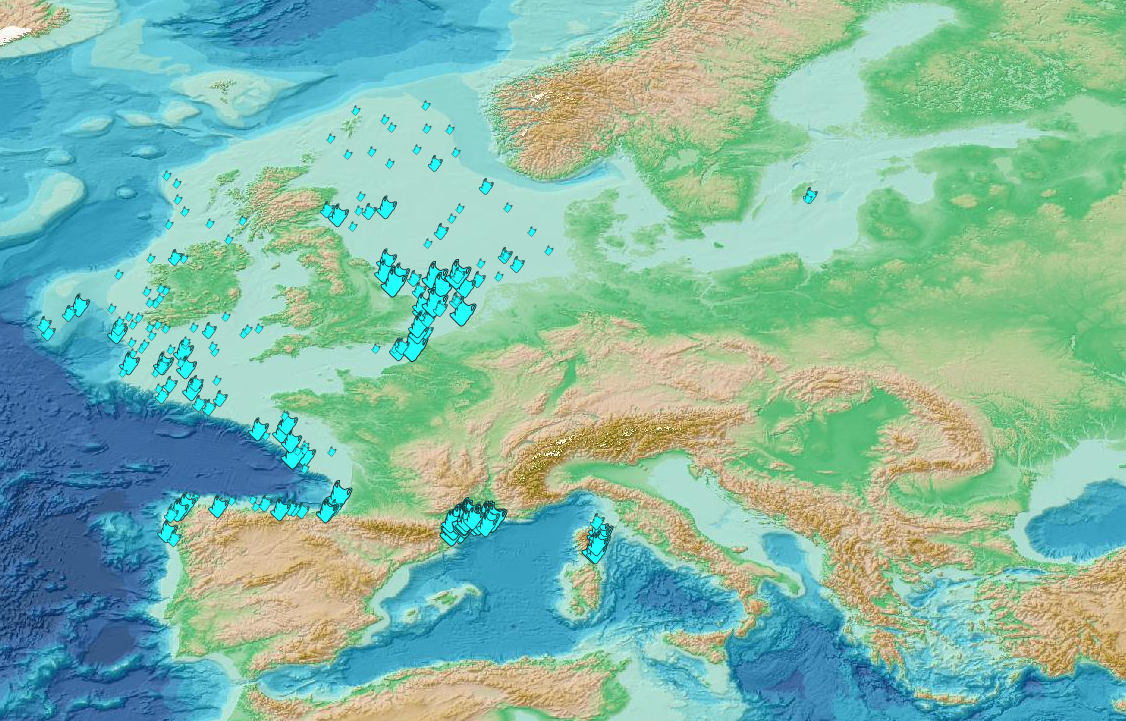
This metadata corresponds to the EUNIS Littoral biogenic habitat types (salt marshes), distribution based on vegetation plot data dataset. Littoral biogenic habitats (commonly known as salt marshes) are formed by animals such as worms and mussels or plants. The verified saltmarsh habitat samples used are derived from the Braun-Blanquet database (http://www.sci.muni.cz/botany/vegsci/braun_blanquet.php?lang=en) which is a centralised database of vegetation plots and comprises copies of national and regional databases using a unified taxonomic reference database. The geographic extent of the distribution data are all European countries except Armenia and Azerbaijan. The dataset is provided both in Geodatabase and Geopackage formats.
-

Ensemble de 2 cartes représentant d'une part l'immobilier d'entreprise existant en Bergeracois ainsi que la répartition des zones d'activités et des projets inscrits au contrat de Pays.
-
Auteur(s): Bourhis Laurent , Présentation de la ville de Marmande (Lot-et-Garonne). Un site, libéré au centre ville, permet d'élaborer un projet de recomposition urbaine. Un espace public et un centre culturel polyvalent sont accompagnés d'un ensemble de logements collectifs et intermédiaires, ainsi que d'un habitat individuel.
-
Med protection initiatives (management and conservation areas)
-
-
The data sets presented here result from the long-term monitoring of individual growth patterns in anchovy and sardine in the Bay of Biscay, from 2000 to 2018. They derived from the PELGAS survey series (Doray et al., 2018), which monitors annually the Bay of Biscay pelagic ecosystem since 2000. The survey is performed in May during the peak spawning of anchovy and main spawning of sardine. Among the many data collected, anchovy and sardine populations are assessed by combining acoustic records with pelagic trawl hauls catches and ICES survey protocoles are used, as detailed in Doray et al. (2021). Briefly, fish acoustic backscatter are recorded along survey transect lines and pelagic trawl hauls undertaken opportunistically to identify echotraces to species and collect fish samples for acquiring biometric data. At each trawl haul and for each species, a random subsample of individuals is taken to establish the species’ length distributions. For anchovy and sardine, this subsample is further subsampled, spanning the whole length range, to take individual fish measurements. These amount to extracting otoliths and measuring individuals’ age, length, weight, sexual maturity and other parameters. Individual measurements are taken on fourty individuals of anchovy and sardine when the species are present in the catch. For each individual fish, the two otolith sagittae are extracted on board, mounted in leukit for age reading on board when permitting and/or on land in the laboratory. Growth patterns in the otoliths were analysed on land with a binocular stereomicroscope under reflected natural light. For anchovy, otoliths’ growth was measured for all individuals in all the hauls. For sardine, trawl hauls were selected and all individual otoliths were measured in each selected haul. The selection was made using the geographical stratification defined in Petitgas et al. (2018) based on the ecosystem spatial structure. An average of two to three hauls in each of the four strata were selected per year. The otoliths mounted in leukit were imaged and growth-at-age in the otoliths was measured with the software TNPC (Traitement numérique des pièces calcifiées: Mahé et al., 2009). Under the binocular microscope and natural light, the otoliths showed hyaline (aragonite-poor) rings corresponding to winter periods of low growth and between the rings, white opaque (aragonite-rich) portions corresponding to annual growth periods. The annual ring determination, the age assignment and the measurement of annual ring diameters followed ICES protocoles and guidelines for anchovy and sardine (ICES, 2010; 2011). The age was estimated as the number of hyaline rings. If the edge was hyaline, it was counted as a ring as a hyaline edge observed within the first half of the year is assumed to represent the last winter. The diameter of each annual ring was measured from middle of the hyaline ring on one side to the middle of the ring on the opposite side along the major elongated axis of the otolith and passing through its centre. The distance was expressed in mm after calibration of the stereomiscroscope and the pixel images. Such diameter corresponded to growth-at-age. Ages 0 to 4 were considered (diameters R1 to R5). The total diameter of the otolith was also measured. The data sets span 19 years, from 2000 to 2018 and comprise 20,186 and 8,624 individual fish analyzed at 535 and 235 trawl hauls for anchovy and sardine, respectively. These data sets were used by Boëns et al. (2021 and 2023) to analyse changes in growth patterns and growth-selective mortality at age in anchovy and sardine under environmental and fishing pressures. References: Doray, M., Boyra, G. and Van Der Kooij, J. (eds) (2021). ICES Survey Protocols – Manual for acoustic surveys coordinated under ICES Working Group on Acoustic and Egg Surveys for Small Pelagic Fish (WGACEGG). 1st Edition. ICES Techniques in Marine Environmental Sciences, 64. https://doi.org/10.17895/ices.pub.7462 Doray, M., Petitgas, P., Romagnan, J.-B., Huret, M., Duhamel, E., Dupuy, Ch., Spitz, J., Authier, M., Sanchez, F., Berger, L., Doremus, G., Bourriau, P., Grellier, P. and Masse, J. (2018). The PELGAS survey: ship-based integrated monitoring of the Bay of Biscay pelagic ecosystem. Progress In Oceanography, 166, 15-29. https://doi.org/10.1016/j.pocean.2017.09.015 ICES (2010). Report of the Workshop on Age reading of European anchovy (WKARA), 9-13 November 2009, Sicily, Italy. ICES CM 2009/ACOM: 43. 122 pp. https://doi.org/10.17895/ices.pub.19280525 ICES (2011). Report of the Workshop on Age Reading of European Atlantic Sardine (WKARAS), 14-18 February 2011, Lisbon, Portugal. ICES CM 2011/ACOM:42. 91 pp. https://doi.org/10.17895/ices.pub.19280855 Petitgas, P., Huret, M., Dupuy, Ch., Spitz, J., Authier, M., Romagnan, J.-B. and Doray, M. (2018). Ecosystem spatial structure revealed by integrated survey data. Progress In Oceanography, 166, 189-198. https://doi.org/10.1016/j.pocean.2017.09.012 Mahe, K., Bellail, R., Dufour, J.-L., Boiron-Leroy, A., Dimeet, J., Duhamel, E., Elleboode, R., Felix, J., Grellier, P., Huet, J., Labastie, J., Le Roy, D., Lizaud, O., Manten, M.-L., Martin, S., Metral, L., Nedelec, D., Verin, Y. and Badts, V. (2009). Synthèse française des procédures d'estimation d'âge / French summary of age estimation procedures. https://archimer.ifremer.fr/doc/00000/7294/ Boëns, A., Grellier, P., Lebigre, Ch. and Petitgas, P. (2021). Determinants of growth and selective mortality in anchovy and sardine in the Bay of Biscay. Fisheries Research, 239, 105947. https://doi.org/10.1016/j.fishres.2021.105947 Boëns, A., Ernande, B., Petitgas, P. and Lebigre, Ch. (2023). Different mechanisms underpin the decline in growth of anchovies and sardines of the Bay of Biscay. Evolutionary Applications, 16: 1393–1411. https://doi.org/10.1111/eva.13564