 Catalogue PIGMA
NC, NETCDF
Type of resources
Available actions
Topics
Keywords
Contact for the resource
Provided by
Years
Formats
-
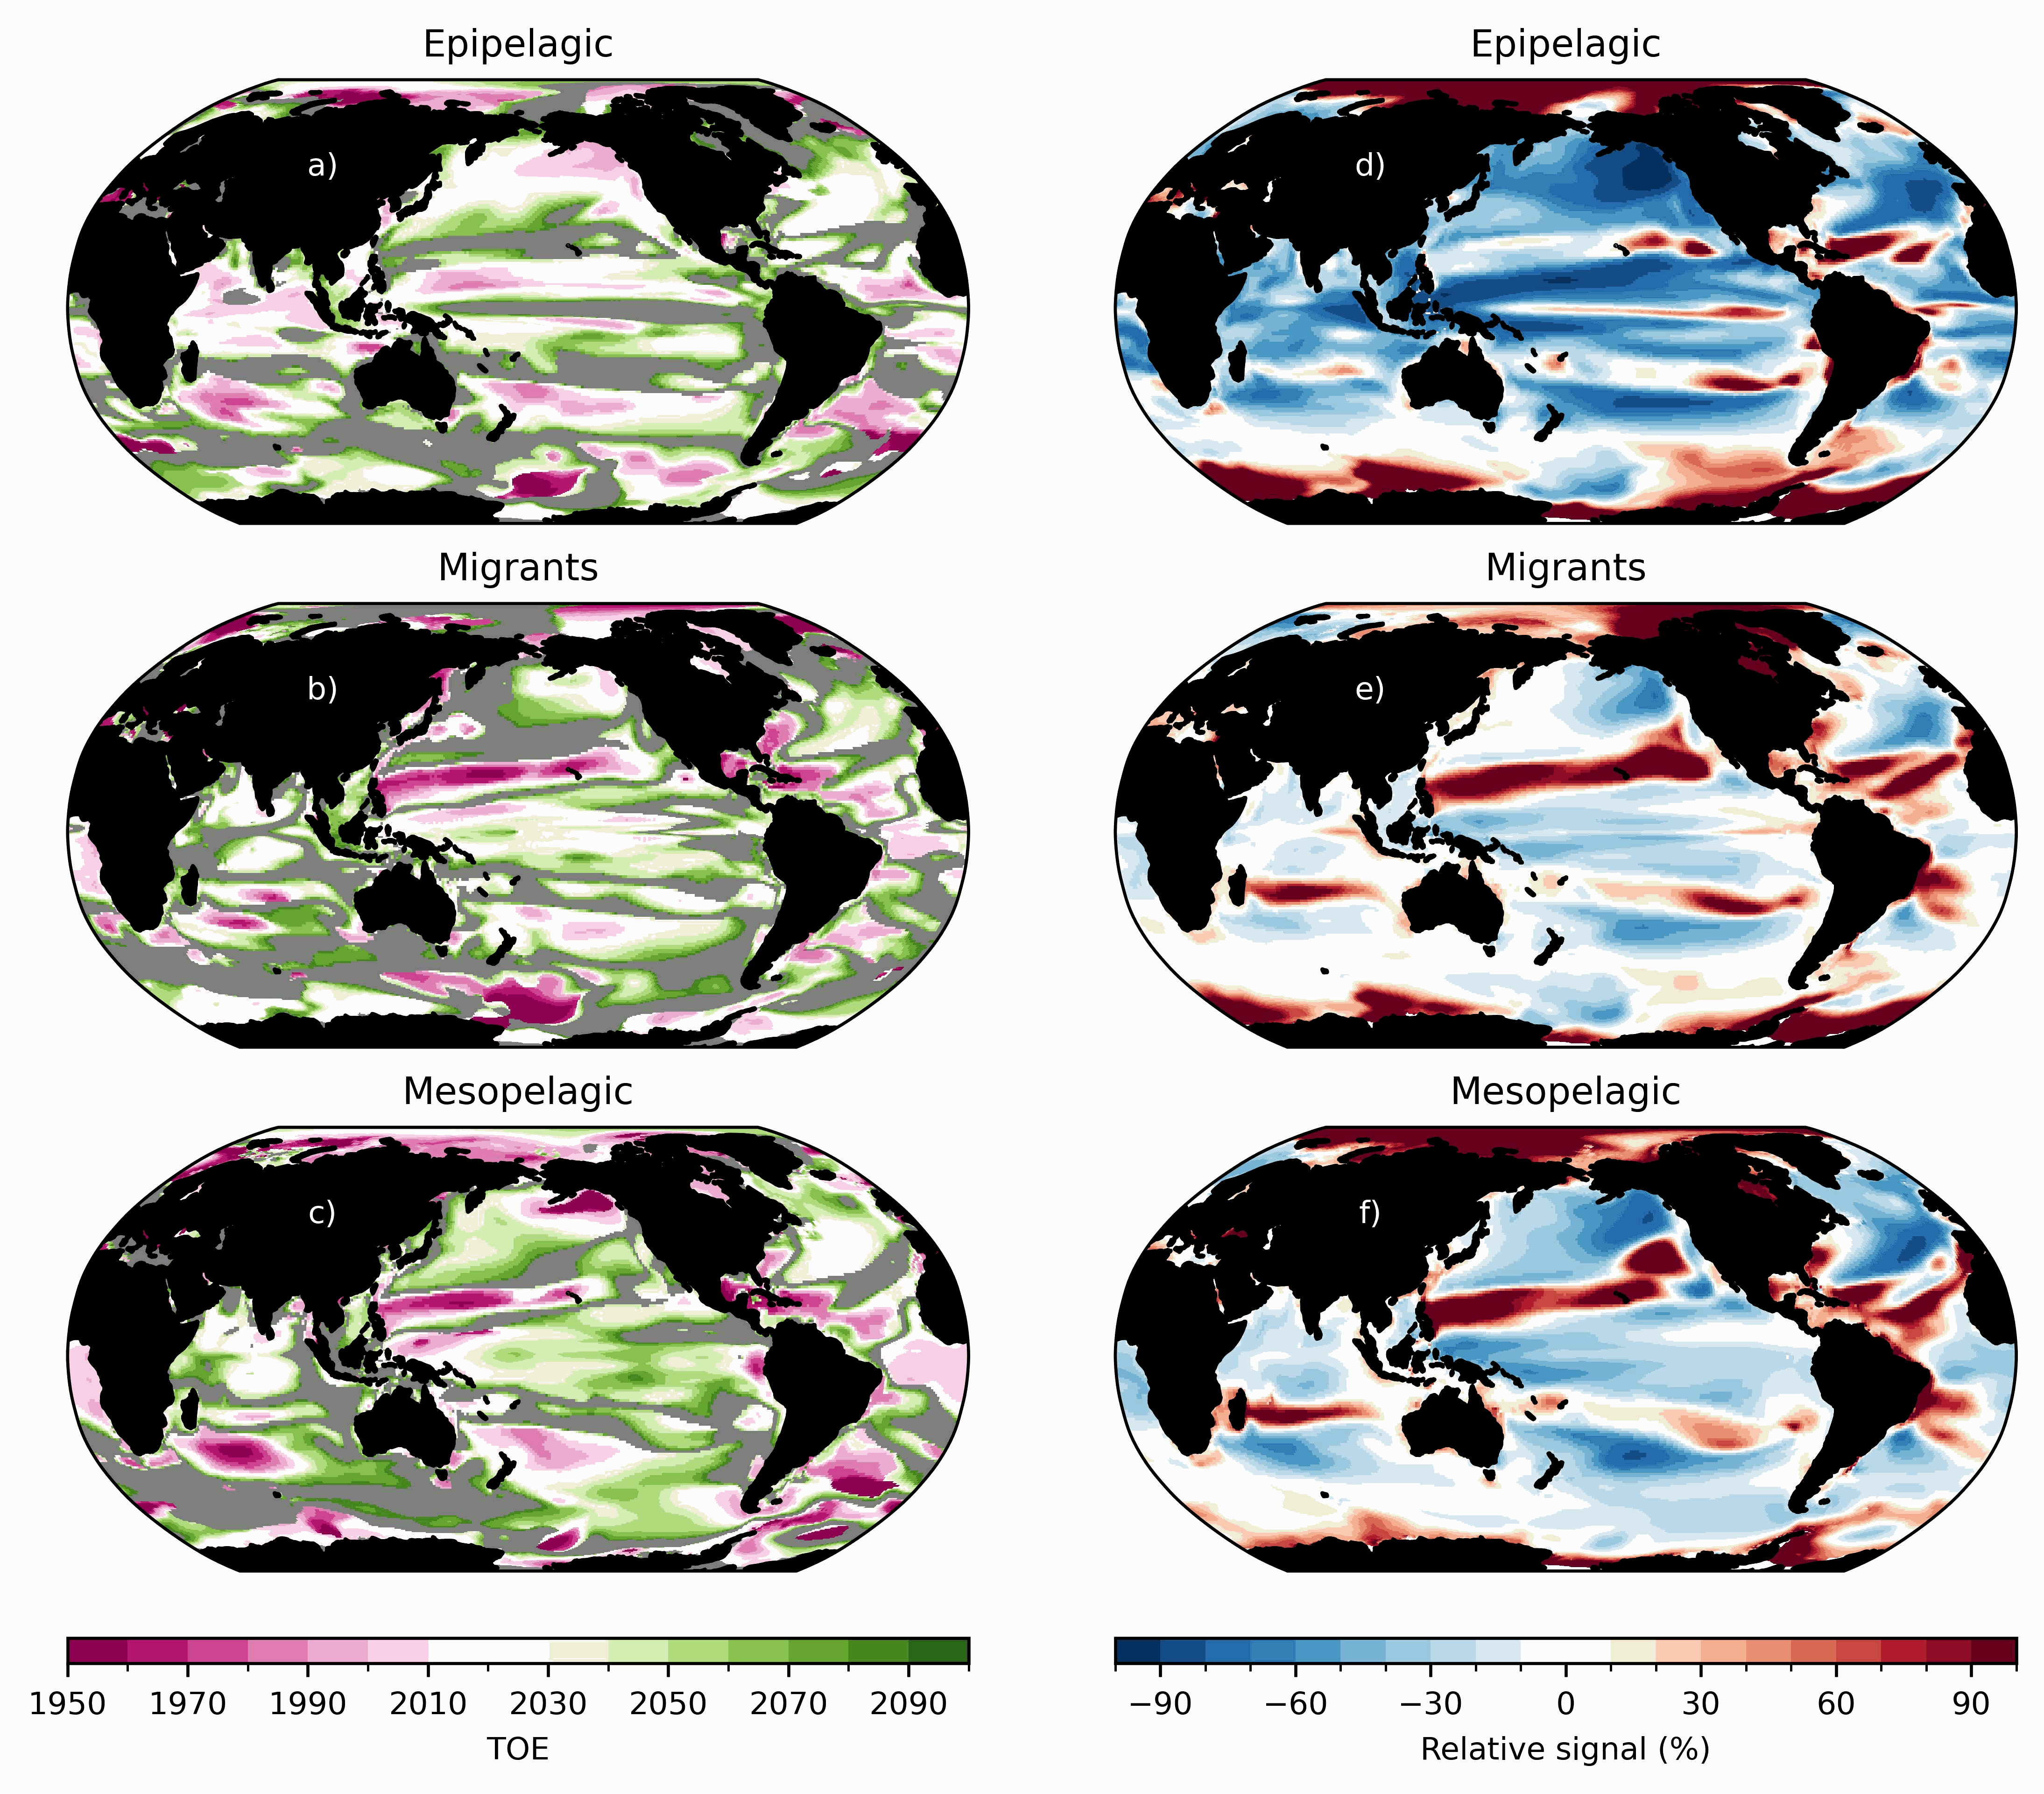
Ensemble simulations of the ecosystem model Apecosm (https://apecosm.org) forced by the IPSL-CM6-LR climate model with the climate change scenario SSP1-2.6. The output files contain yearly mean biomass density for 3 communities (epipelagic, mesopelagic migratory and mesopelagic redidents) and 100 size classes (ranging from 0.12cm to 1.96m) The model grid file is also provided. Units are in J/m2 and can be converted in kg/m2 by dividing by 4e6. These outputs are associated with the "Assessing the time of emergence of marine ecosystems from global to local scales using IPSL-CM6A-LR/APECOSM climate-to-fish ensemble simulations" paper from the Earth's Future "Past and Future of Marine Ecosystems" Special Collection.
-
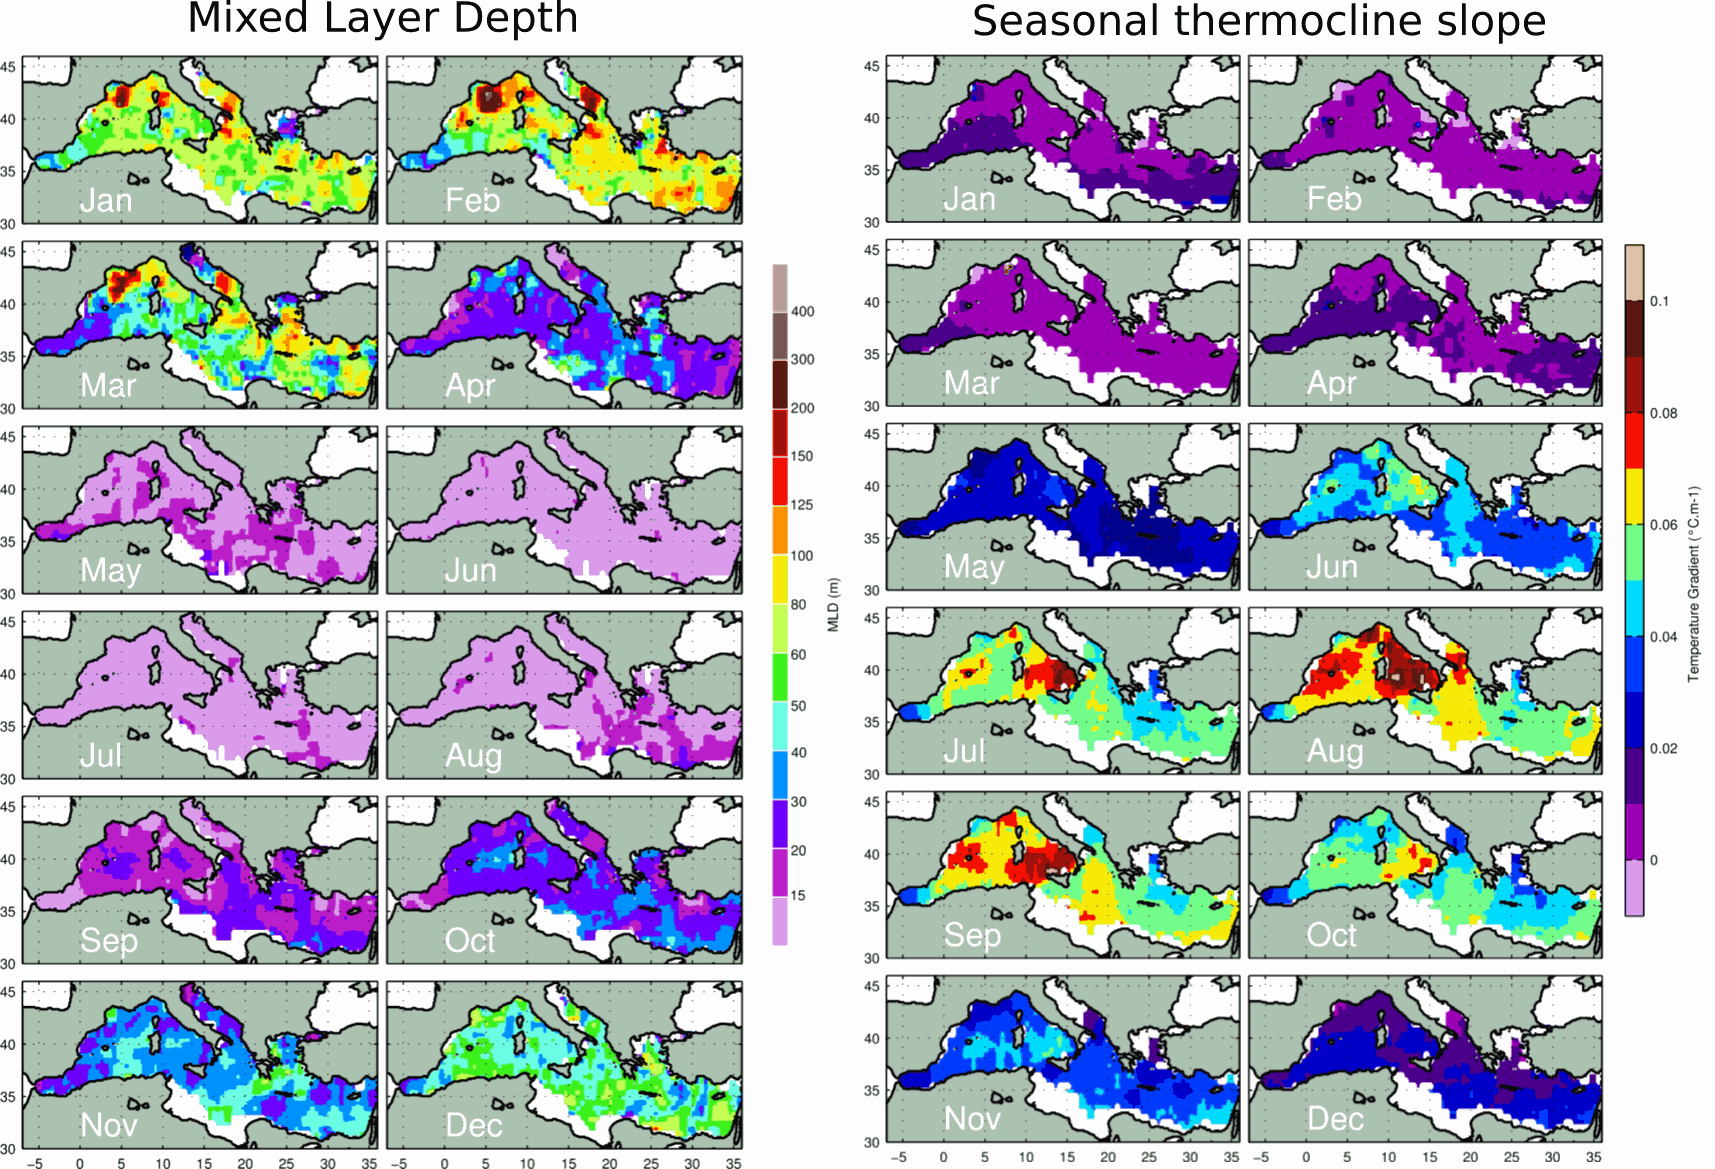
These monthly gridded climatology were produced using MBT, XBT, Profiling floats, Gliders, and ship-based CTD data from different database and carried out in the Med. between 1969 and 2013. The Mixed Layer Depth (MLD) is calculated with a delta T= 0.1 C criterion relative to 10m reference level on individual profiles. The Depth of the Bottom of the Seasonal Thermocline (DBST) is calculated on individual profiles as the maximum value from a vector composed of two elements: 1) the depth of the temperature minimum in the upper 200m; 2) the MLD. This double criterion for the calculation of DBST is necessary in areas where the mixed layer exceed 200m depth. DBST is the integration depth used in the calculation of the upper-ocean Heat Storage Rate. For more details about the data and the methods used, see: Houpert et al. 2015, Seasonal cycle of the mixed layer, the seasonal thermocline and the upper-ocean heat storage rate in the Mediterranean Sea derived from observations, Progress in Oceanography, http://doi.org/10.1016/j.pocean.2014.11.004
-

This dataset contains the dynamical outputs of a global ocean simulation coupling dynamics and biogeochemistry at ¼° over the year 2019. The simulation has been performed using the coupled circulation/ecosystem model NEMO/PISCES (https://www.nemo-ocean.eu/), which is here enhanced to perform an ensemble simulation with explicit simulation of modeling uncertainties in the physics and in the biogeochemistry. This dataset is one of the 40 members of the ensemble simulation. This study was part of the Horizon Europe project SEAMLESS (https://seamlessproject.org/Home.html), with the general objective of improving the analysis and forecast of ecosystem indicators. See Popov et al. (https://os.copernicus.org/articles/20/155/2024/) for more details on the study.
-
The continuously updated version of Copernicus Argo floats realtime currents product is distributed from Copernicus Marine catalogue: - https://resources.marine.copernicus.eu/?option=com_csw&view=details&product_id=INSITU_GLO_UV_NRT_OBSERVATIONS_013_048 The Argo current product generated by Copernicus in situ TAC is derived from the original trajectory data from Argo GDAC (Global Data Assembly Center) available at: - Argo float data and metadata from Global Data Assembly Centre (Argo GDAC). SEANOE. https://doi.org/10.17882/42182 In 2021, the GDAC distributes data from more than 15,000 Argo floats. Deep ocean current is calculated from floats drift at parking depth, surface current is calculated from float surface drift. An Argo float drifts freely in the global ocean, performing regular observation cycles. An observation cycle usually spreads over 10 days : - a surface descent to a parking depth (generally 1500 meters deep) - a 10-day drift at this parking depth - an ascent to the surface (vertical profile) - A short surface drift for data transmission The data transmitted at each cycle contain temperature, salinity observations (and additional biogeochemical parameters if applicable), positions (gps or argos), technical data. The ocean current product contains a NetCDF file for each Argo float. It is updated daily in real time by automated processes. For each cycle it contains the surface and deep current variables: - Date (time, time_qc) - Position (latitude, longitude, position_qc) - Pressure (pres, pres_qc, representative_park_pressure for parking drift, 0 decibar for surface drift) - Current (ewct, ewct_qc, nsct, nsct_qc; the current vector is positioned and dated at the last position of the N-1 cycle) - Duration (days) of the current variable sampling (time_interval) - Grounded indicator - Positions and dates have a QC 1 (good data). Positions and dates that do not have a QC 1 are ignored. The positions are measured during the surface drift (Argos or GPS positioning). For the deep current of cycle N, we take the last good position of cycle N-1 and the first good position of cycle N. For the surface current of cycle N, we take the first and last good position of the N cycle.
-
This In Situ delayed mode product integrates the best available version of in situ oxygen, chlorophyll / fluorescence and nutrients data. The latest version of Copernicus delayed-mode BGC (bio-geo-chemical) product is also distributed from Copernicus Marine catalogue.
-
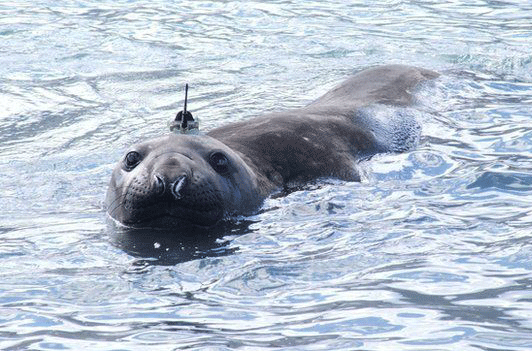
The Southern Ocean plays a fundamental role in regulating the global climate. This ocean also contains a rich and highly productive ecosystem, potentially vulnerable to climate change. Very large national and international efforts are directed towards the modeling of physical oceanographic processes to predict the response of the Southern Ocean to global climate change and the role played by the large-scale ocean climate processes. However, these modeling efforts are greatly limited by the lack of in situ measurements, especially at high latitudes and during winter months. The standard data that are needed to study ocean circulation are vertical profiles of temperature and salinity, from which we can deduce the density of seawater. These are collected with CTD (Conductivity-Temperature-Depth) sensors that are usually deployed on research vessels or, more recently, on autonomous Argo profilers. The use of conventional research vessels to collect these data is very expensive, and does not guarantee access to areas where sea ice is found at the surface of the ocean during the winter months. A recent alternative is the use of autonomous Argo floats. However, this technology is not easy to use in glaciated areas. In this context, the collection of hydrographic profiles from CTDs mounted on marine mammals is very advantageous. The choice of species, gender or age can be done to selectively obtain data in particularly under-sampled areas such as under the sea ice or on continental shelves. Among marine mammals, elephant seals are particularly interesting. Indeed, they have the particularity to continuously dive to great depths (590 ± 200 m, with maxima around 2000 m) for long durations (average length of a dive 25 ± 15 min, maximum 80 min). A Conductivity-Temperature-Depth Satellite Relay Data Logger (CTD-SRDLs) has been developed in the early 2000s to sample temperature and salinity vertical profiles during marine mammal dives (Boehme et al. 2009, Fedak 2013). The CTD-SRDL is attached to the seal on land, then it records hydrographic profiles during its foraging trips, sending the data by satellite ARGOS whenever the seal goes back to the surface.While the principle intent of seal instrumentation was to improve understanding of seal foraging strategies (Biuw et al., 2007), it has also provided as a by-product a viable and cost-effective method of sampling hydrographic properties in many regions of the Southern Ocean (Charrassin et al., 2008; Roquet et al., 2013).
-
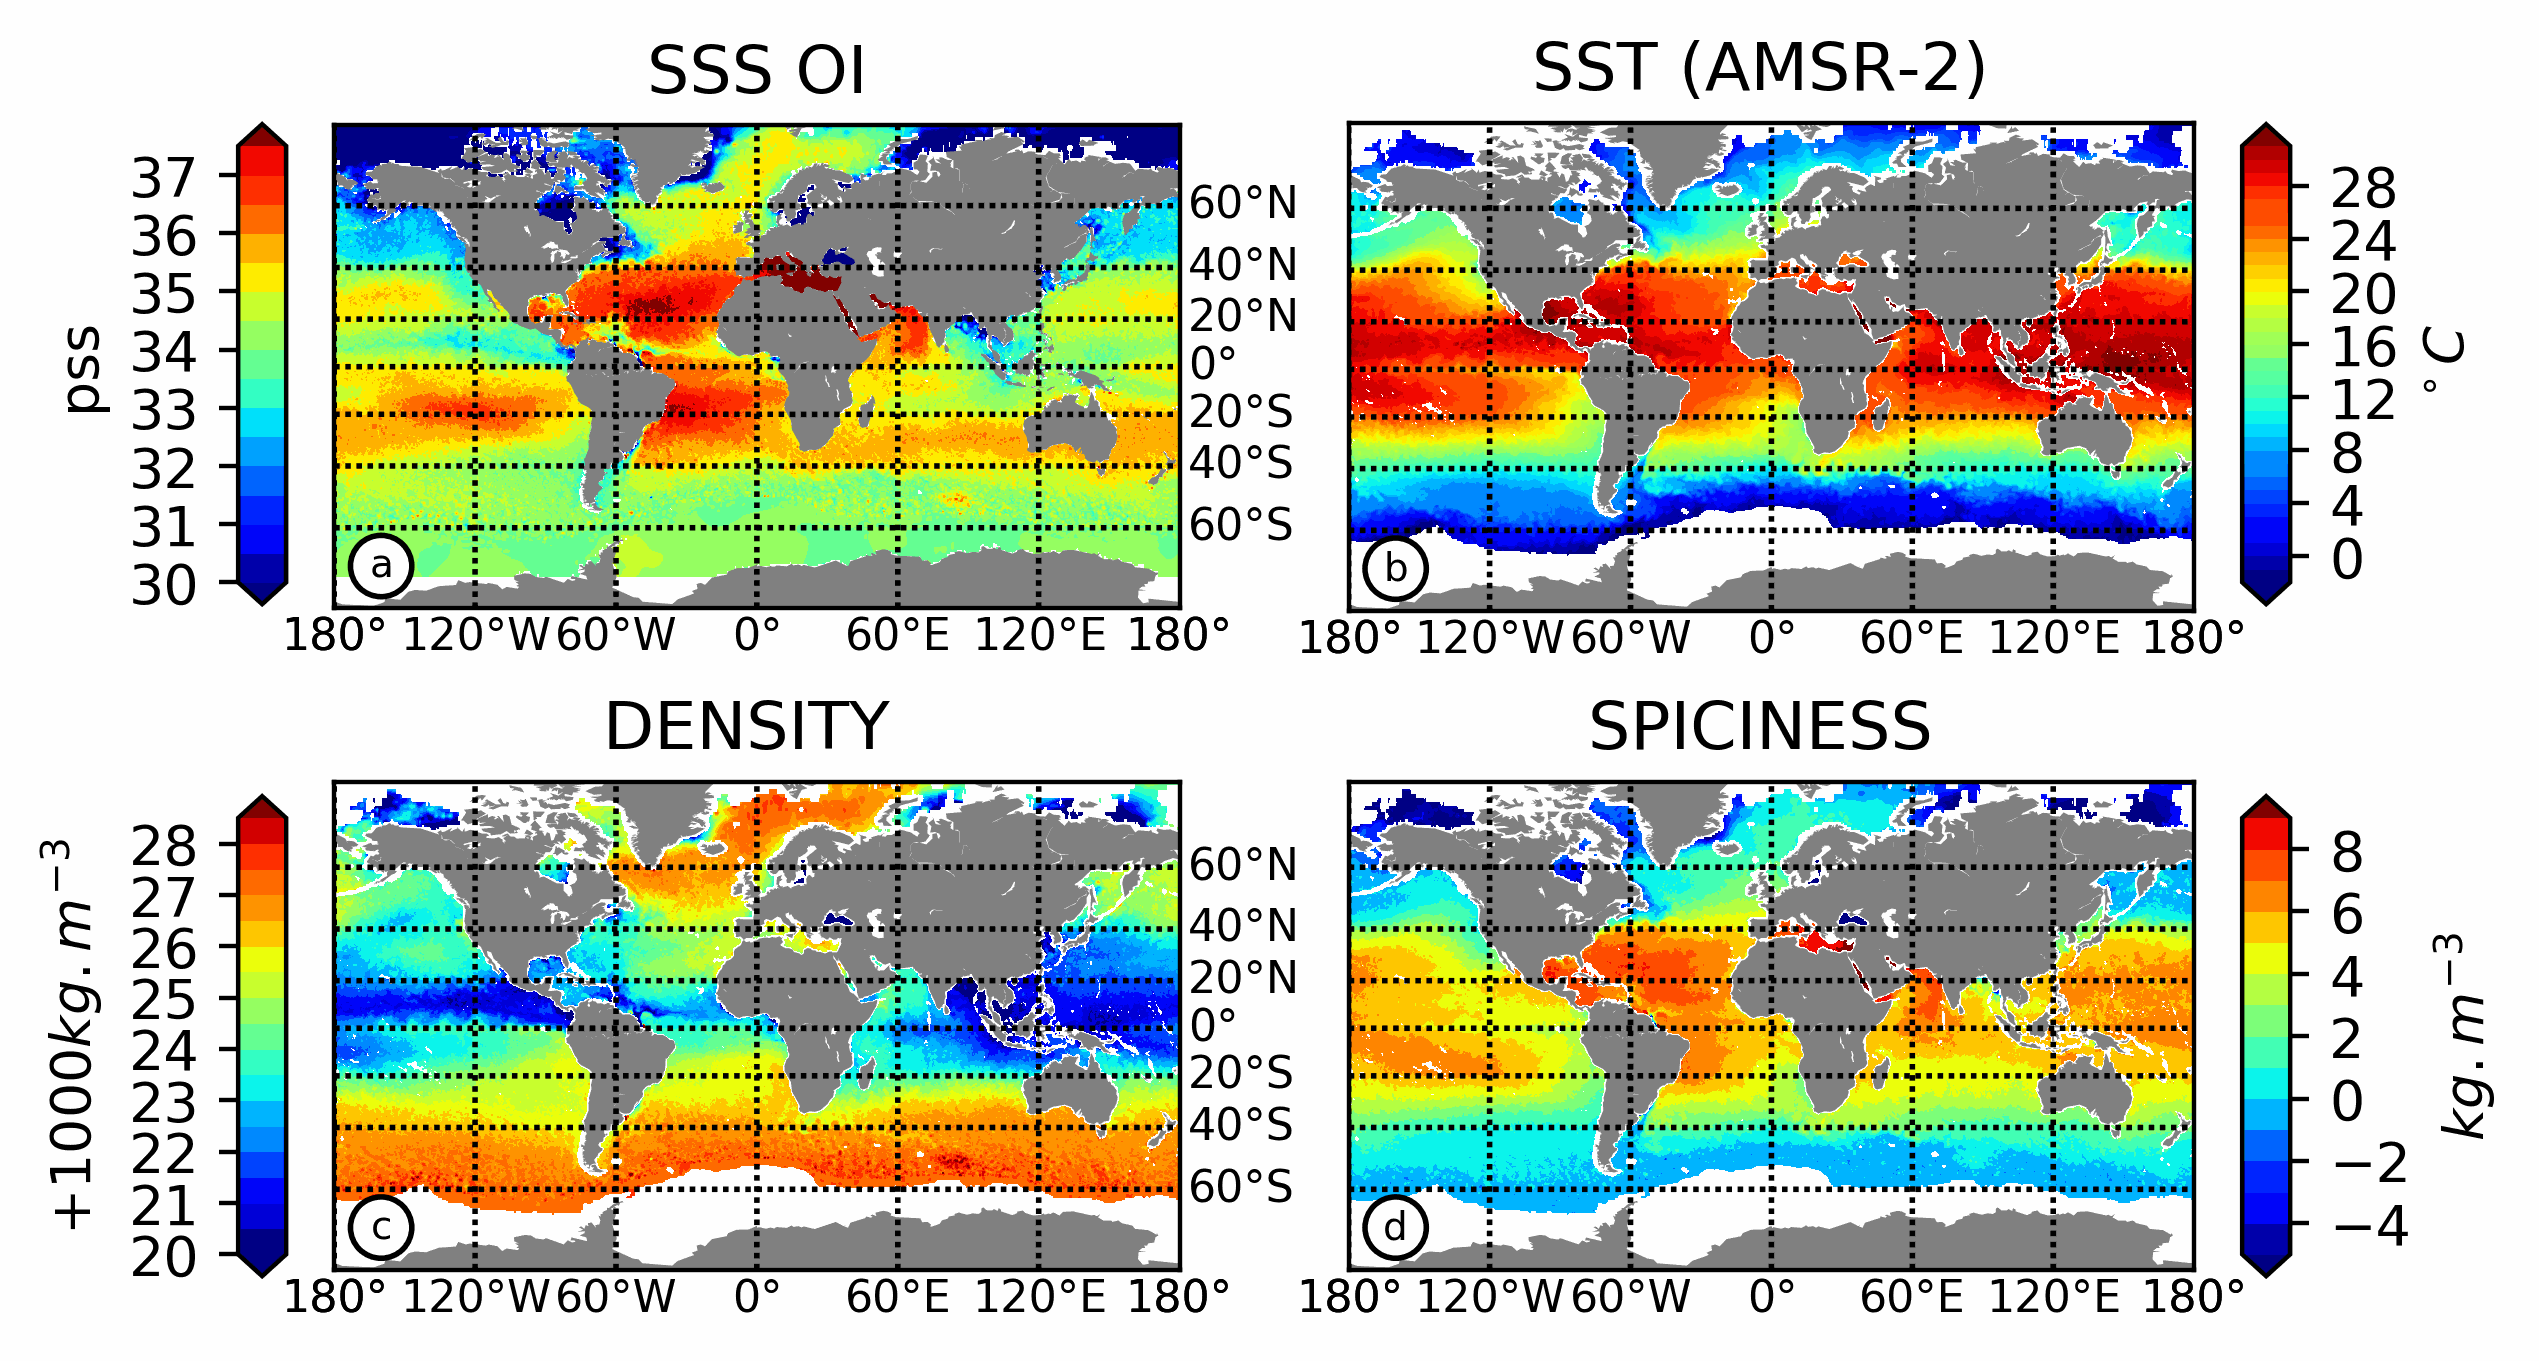
15 years of L-Band remote sensing Sea Surface Salinity (SSS) measurements have proven the capability of satellite SSS to resolve large scale to mesoscale SSS features in tropical to subtropical ocean. In mid to high latitude, L-Band measurements still suffer from large scale and time varying biases. Here, a simple method is proposed to mitigate the large scale and time varying biases. First, in order to estimate these biases, an Optimal Interpolation (OI) using a large correlation scale is used to map SMOS and SMAP L3 products and is compared to equivalent mapping of in situ observations. Then, a second mapping is performed on corrected SSS at scale of SMOS/SMAP resolution (~45 km). This procedure allows to correct and merge both products, and to increase signal to noise ratio of the absolute SSS estimates. Using thermodynamic equation of state (TEOS-10), the resulting L4 SSS product is combined with microwave satellite SST products to produce sea surface density and spiciness, useful to fully characterize the surface ocean water masses. The new L4 SSS products is validated against independent in situ measurements from low to high latitudes. The L4 products exhibits a significant improvement in mid-and high latitude in comparison to the existing SMOS and SMAP L3 products.
-
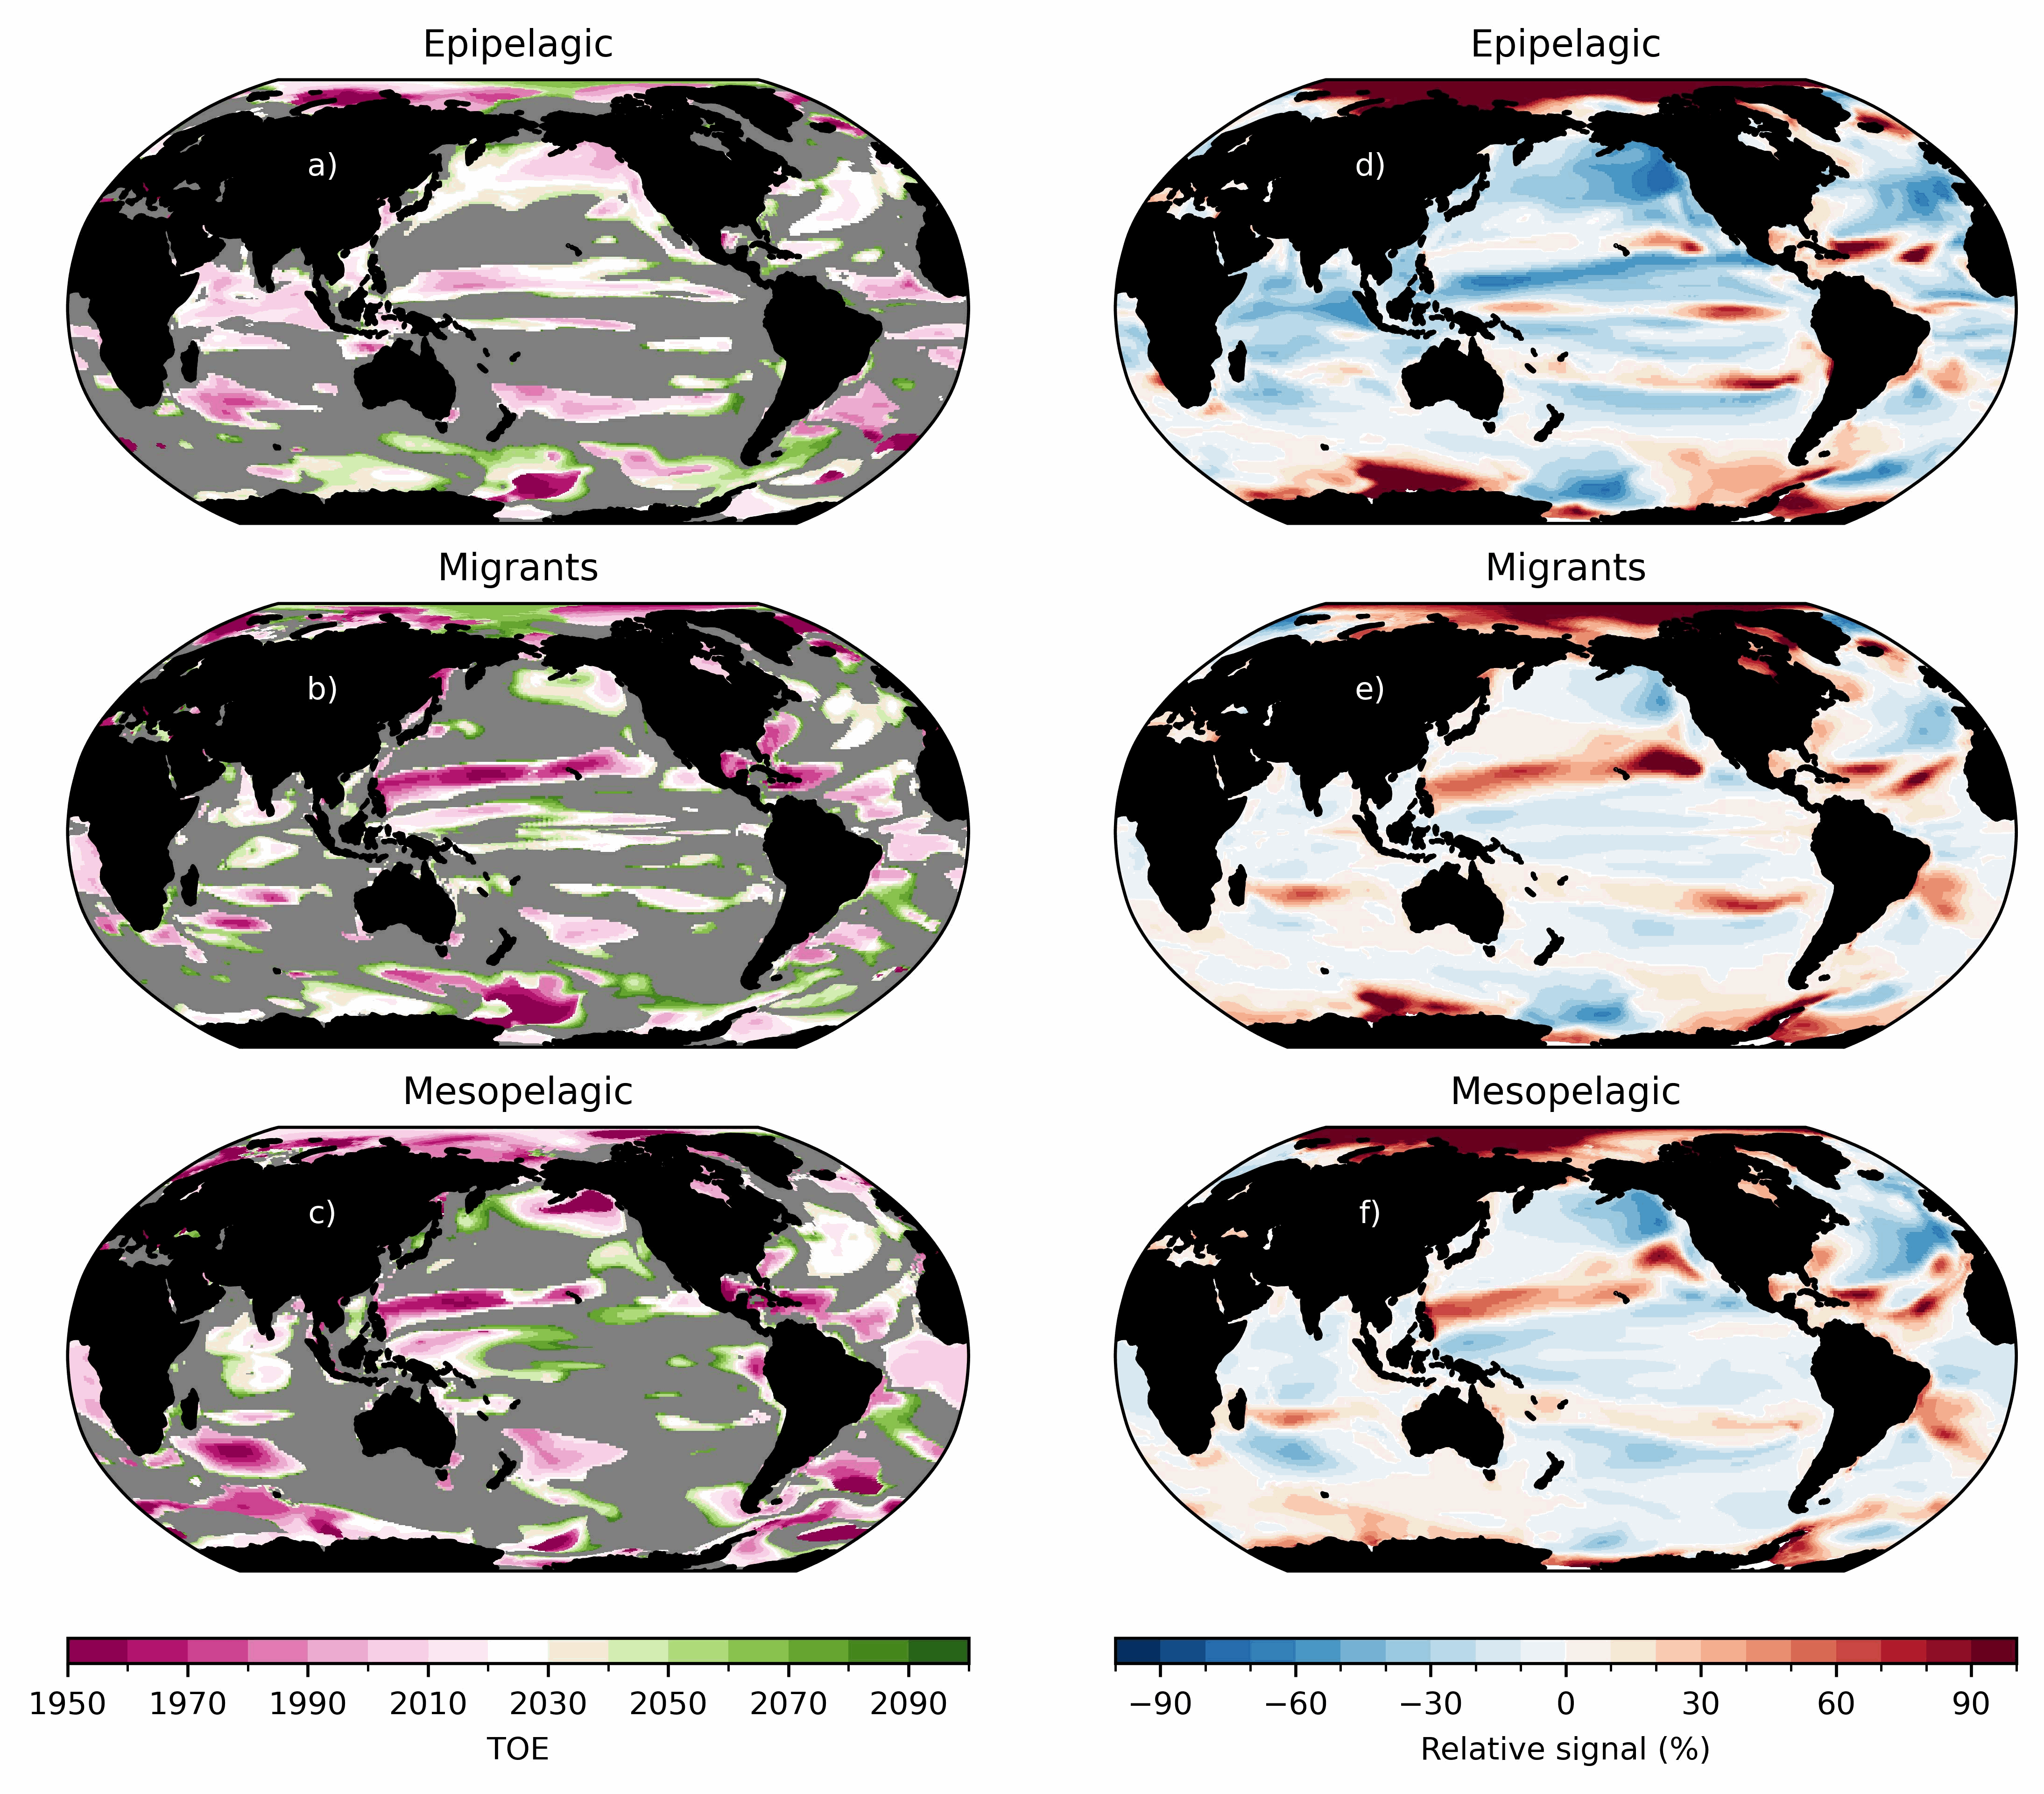
Ensemble simulations of the ecosystem model Apecosm (https://apecosm.org) forced by the IPSL-CM6-LR climate model with the climate change scenario SSP5-8.5. The output files contain yearly mean biomass density for 3 communities (epipelagic, mesopelagic migratory and mesopelagic redidents) and 100 size classes (ranging from 0.12cm to 1.96m) The model grid file is also provided. Units are in J/m2 and can be converted in kg/m2 by dividing by 4e6. These outputs are associated with the "Assessing the time of emergence of marine ecosystems from global to local scales using IPSL-CM6A-LR/APECOSM climate-to-fish ensemble simulations" paper from the Earth's Future "Past and Future of Marine Ecosystems" Special Collection.
-
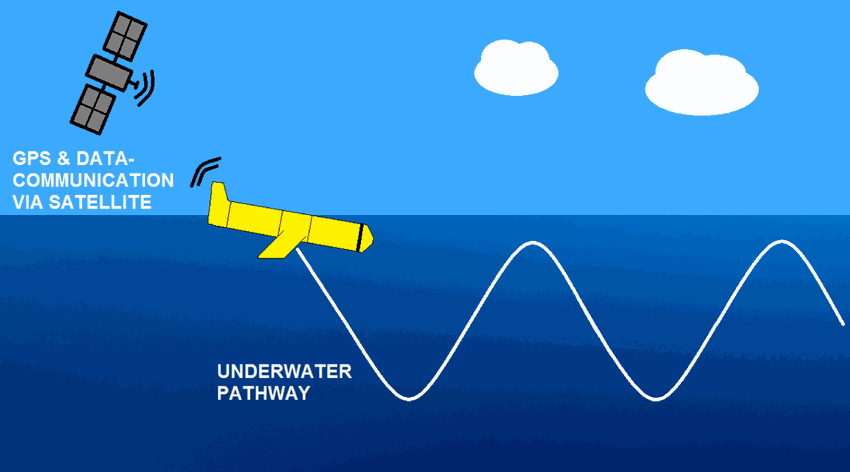
The OceanGliders initiative (formerly EGO) is a gathering of several teams of oceanographers, interested in developing the use of gliders for ocean observations. OceanGliders started in Europe with members from France, Germany, Italy, Norway, Spain, and the United Kingdom. The partners of OceanGliders have been funded by both European and national agencies to operate gliders for various purposes and at different sites. Coordinated actions are being set up for these sites in order to demonstrate the capabilities of a fleet of gliders for sampling the ocean, with a given scientific and/or operational objective. Gliders were developed since the 90’s to carry out in-situ observations of the upper 1km of the ocean, filling the gaps left by the existing observing systems. Gliders look like small autonomous robotic underwater vehicles which that uses an engine to change their buoyancy. While gliding from surface to about 1000 meters, gliders provide real-time physical and biogeochemical data along their transit. They observe temperature, salinity, pressure, biogeochemical data or acoustic data. The OceanGliders GDAC handled at Ifremer/France aggregates the data and metadata from glider deployments provided by the DACs or PIs. The OceanGliders unique DOI publishes the quaterly snapshot of the whole GDAC content and preserves its successive quaterly versions (unique DOI for easy citability, preservation of quaterly versions for reproducibility). The OceanGliders unique DOI references all individual glider deployment DOIs provided by the DACs or PIs, and with data in the GDAC. DACs or PIs may use the data processing chain published at http://doi.org/10.17882/45402 to generate glider NetCDF GDAC files.
-
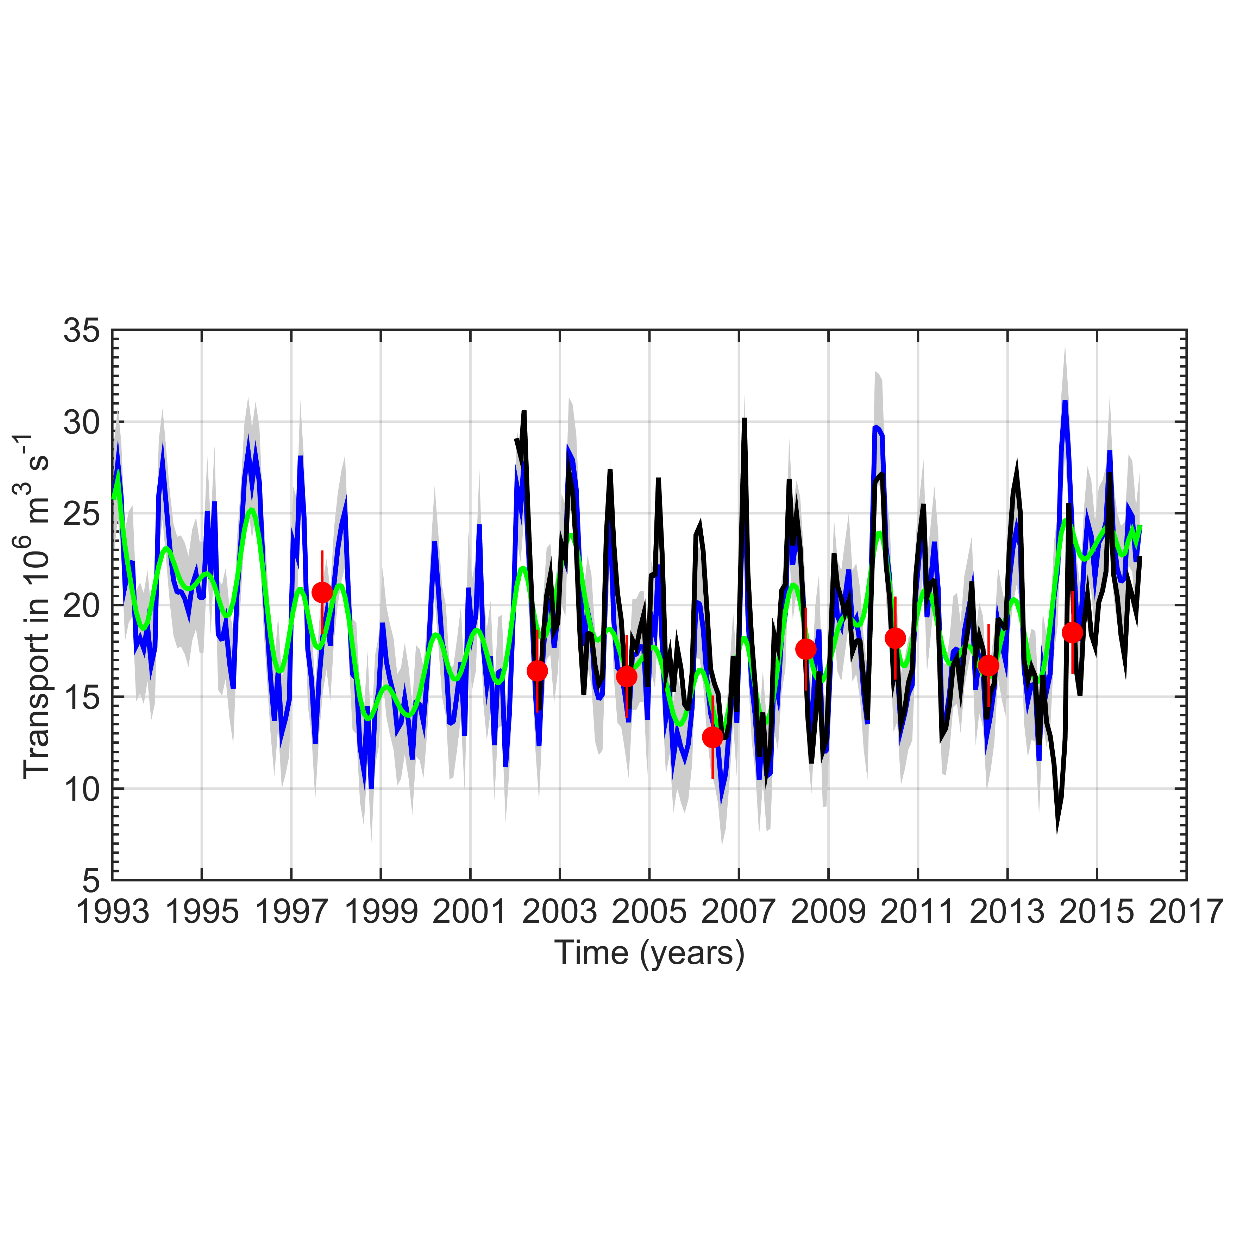
This data set provides a monthly time series of the upper limb of the Meridional Overturning Circulation (MOC) intensity at the A25 Greenland-Portugal OVIDE line from 1993 to 2015. The MOC was derived by combining AVISO altimetry with ISAS temperature and salinity data. The reader is referred to Mercier et al. (2015, Progress in Oceanography) for a full description of the method.