 Catalogue PIGMA
2021
Type of resources
Available actions
Topics
Keywords
Contact for the resource
Provided by
Years
Formats
Representation types
Update frequencies
status
Scale
Resolution
-
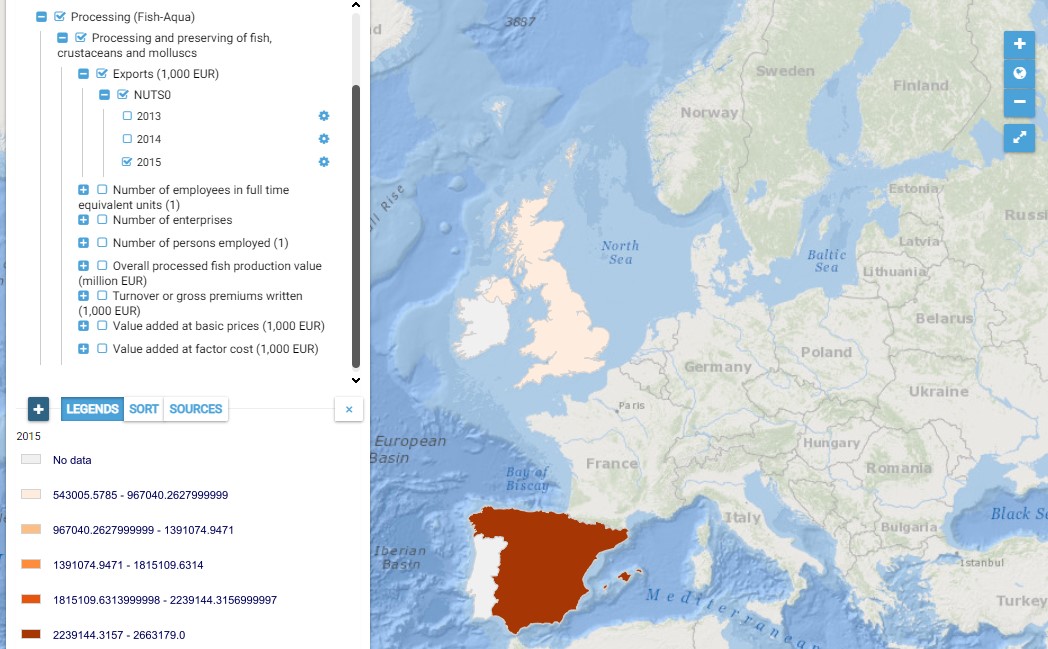
This map presents all layers corresponding to "Processing and preserving of fish, crustaceans and molluscs" activities in the Atlantic area. For more information about this NACE code : https://ec.europa.eu/eurostat/ramon/nomenclatures/index.cfm?TargetUrl=DSP_NOM_DTL_VIEW&StrNom=NACE_REV2&StrLanguageCode=EN&IntPcKey=18496514&IntKey=18496544&StrLayoutCode=HIERARCHIC&IntCurrentPage=1 Indicators collected are : Business indicators per country Total number of persons employed per Atlantic NUTS 3 unit Total production value in the Atlantic NUTS 3 units.
-
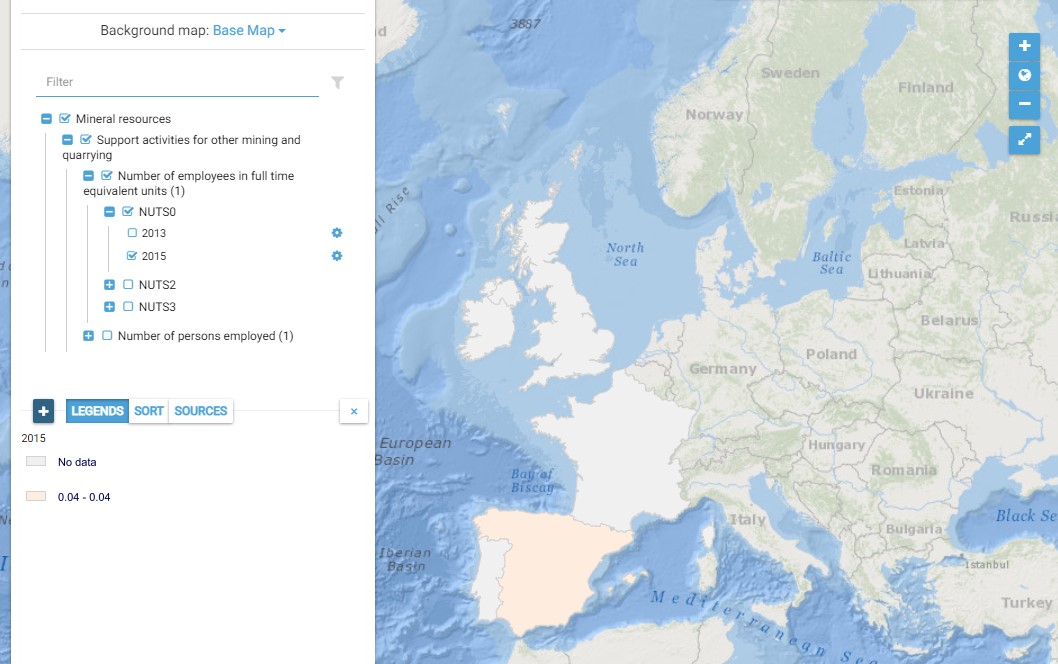
This map presents all layers corresponding to "Support activities for other mining and quarrying" activities in the Atlantic area. For more information about this NACE code : https://ec.europa.eu/eurostat/ramon/nomenclatures/index.cfm?TargetUrl=DSP_NOM_DTL_VIEW&StrNom=NACE_REV2&StrLanguageCode=EN&IntPcKey=18496274&IntKey=18496304&StrLayoutCode=HIERARCHIC&IntCurrentPage=1
-
L'orthophotographie de précision planimétrique de classe A (arrêté du 16 septembre 2003) et produit en RVB (couleurs : Rouge, Vert, Bleu) constitue la composante image du géostandard PCRS. Un PCRS constitue le socle commun topographique minimal de base décrivant à très grande échelle les limites apparentes de la voirie. Il est limité aux objets les plus utiles et n'aborde aucune des logiques "métiers" par ailleurs traitées chez les gestionnaires de réseaux. Le PCRS est destiné à servir de support topographique à un grand nombre d'applications requérant la meilleure précision possible. Il répond essentiellement aux exigences de la réglementation dite "anti-endommagement" ou réforme DT-DICT portant sur les travaux à proximité des réseaux, notamment sous la forme d'un fond de plan utilisable dans le cadre des échanges entre gestionnaires et exploitants. Conçu pour facilité les échanges entre les plans de type DAO et les SIG des collectivité et exploitants, les objets du PCRS gèrent peu d'attributs autres que ceux liés à la généalogie de leur acquisition, majoritairement par levé topographique.
-
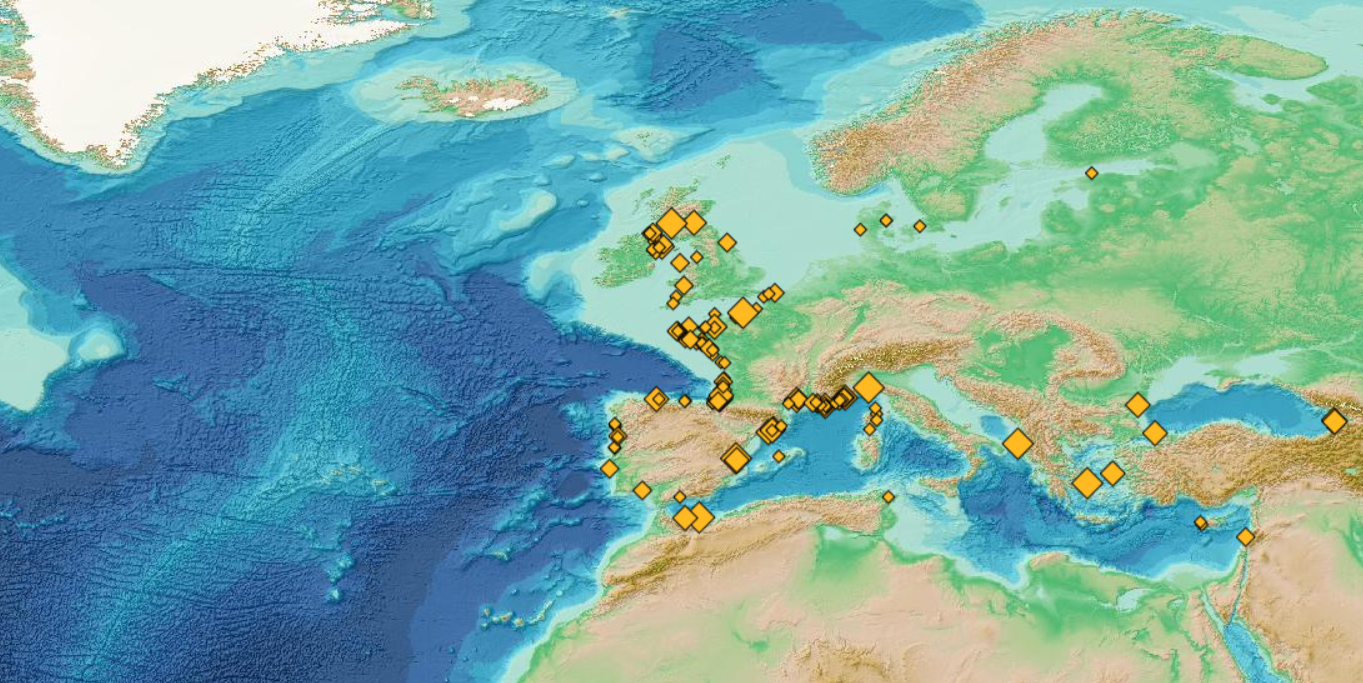
This visualization product displays the total abundance of marine macro-litter (> 2.5cm) per beach per year from non-MSFD monitoring surveys, research & cleaning operations. EMODnet Chemistry included the collection of marine litter in its 3rd phase. Since the beginning of 2018, data of beach litter have been gathered and processed in the EMODnet Chemistry Marine Litter Database (MLDB). The harmonization of all the data has been the most challenging task considering the heterogeneity of the data sources, sampling protocols and reference lists used on a European scale. Preliminary processing were necessary to harmonize all the data: - Exclusion of OSPAR 1000 protocol: in order to follow the approach of OSPAR that it is not including these data anymore in the monitoring; - Selection of surveys from non-MSFD monitoring, cleaning and research operations; - Exclusion of beaches without coordinates; - Some categories & some litter types like organic litter, small fragments (paraffin and wax; items > 2.5cm) and pollutants have been removed. The list of selected items is attached to this metadata. This list was created using EU Marine Beach Litter Baselines and EU Threshold Value for Macro Litter on Coastlines from JRC (these two documents are attached to this metadata). - Exclusion of surveys without associated length; - Normalization of survey lengths to 100m & 1 survey / year: in some case, the survey length was not 100m, so in order to be able to compare the abundance of litter from different beaches a normalization is applied using this formula: Number of items (normalized by 100 m) = Number of litter per items x (100 / survey length) Then, this normalized number of items is summed to obtain the total normalized number of litter for each survey. Finally, the median abundance for each beach and year is calculated from these normalized abundances per survey. Percentiles 50, 75, 95 & 99 have been calculated taking into account other sources data for all years. More information is available in the attached documents. Warning: the absence of data on the map doesn't necessarily mean that they don't exist, but that no information has been entered in the Marine Litter Database for this area.
-
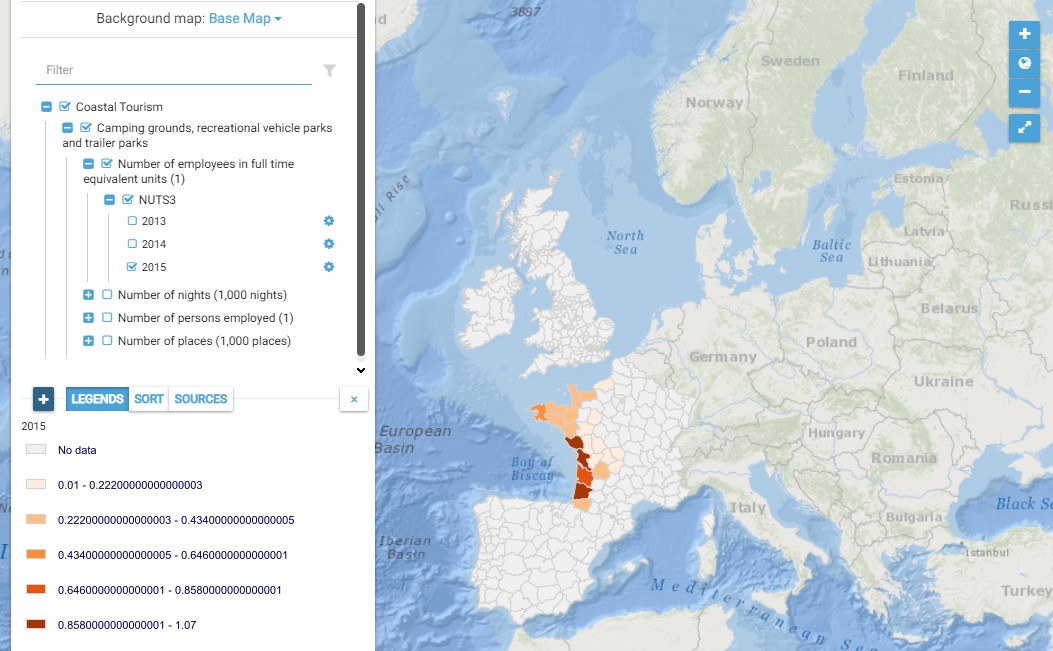
This map presents all layers corresponding to "Camping grounds, recreational vehicle parks and trailer parks" activities in the Atlantic area. For more information about this NACE code : https://ec.europa.eu/eurostat/ramon/nomenclatures/index.cfm?TargetUrl=DSP_NOM_DTL_VIEW&StrNom=NACE_REV2&StrLanguageCode=EN&IntPcKey=18513734&IntKey=18513764&StrLayoutCode=HIERARCHIC&IntCurrentPage=1 Indicators collected are : Number of places per NUTS 3 unit of the Atlantic Area
-

rgbif is an R package from rOpenSci that allows searching and retrieving data from GBIF. rgbif wraps R code around the GBIF API to allow you to talk to GBIF from R and access metadata, species names, and occurrences. rgbif allows you to easily: - get data for single occurrences - retrieve multiple occurences - search for taxon names - generate maps of occurences
-
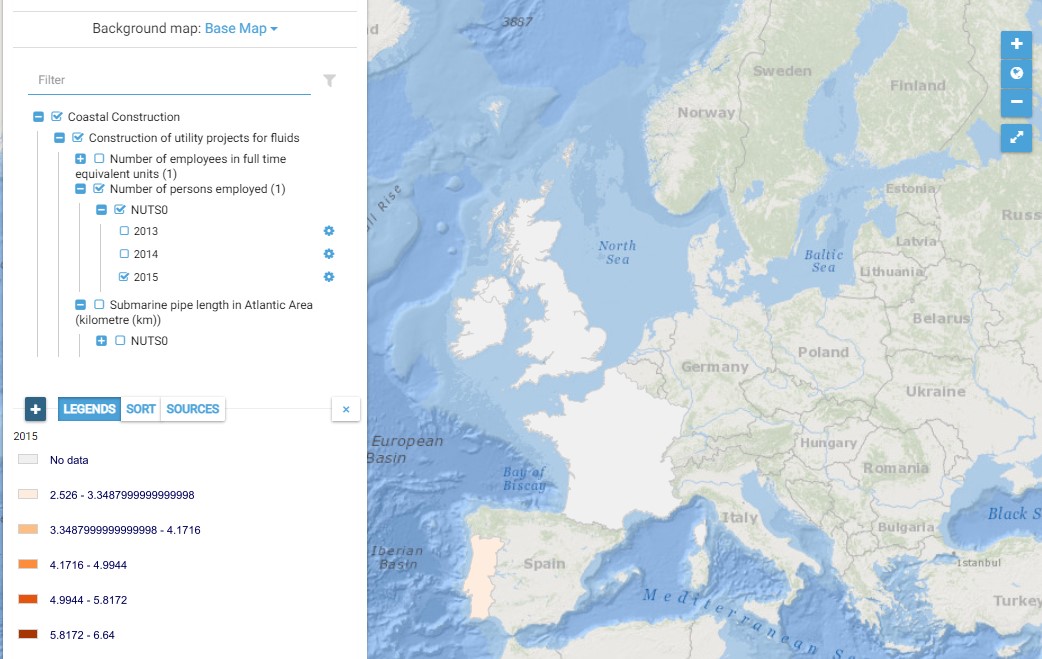
This map presents all layers corresponding to "Construction of utility projects for fluids" activities in the Atlantic area. For more information about this NACE code : https://ec.europa.eu/eurostat/ramon/nomenclatures/index.cfm?TargetUrl=DSP_NOM_DTL_VIEW&StrNom=NACE_REV2&StrLanguageCode=EN&IntPcKey=18508154&IntKey=18508184&StrLayoutCode=HIERARCHIC&IntCurrentPage=1 Indicators collected are : Number of persons employed in cable and pipe laying and maintenance activities in the Atlantic area per country Submarine pipe length in Atlantic Area per country (P16) Number of landing points in Atlantic Area per country
-
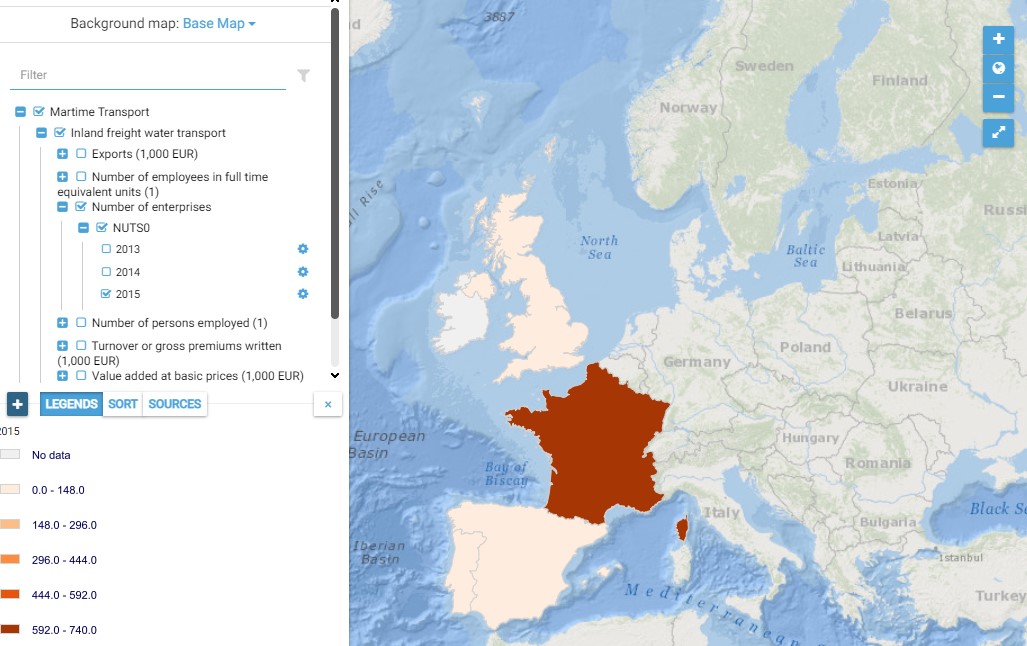
This map presents all layers corresponding to "Inland freight water transport" activities in the Atlantic area. For more information about this NACE code : https://ec.europa.eu/eurostat/ramon/nomenclatures/index.cfm?TargetUrl=DSP_NOM_DTL_VIEW&StrNom=NACE_REV2&StrLanguageCode=EN&IntPcKey=18512804&IntKey=18513014&StrLayoutCode=HIERARCHIC&IntCurrentPage=1 Indicators collected are : Business indicators per country
-
Water body dissolved oxygen concentration - Monthly Climatology for the European Seas for the period 1960-2020 on the domain from longitude -45.0 to 70.0 degrees East and latitude 24.0 to 83.0 degrees North. Data Sources: observational data from SeaDataNet/EMODnet Chemistry Data Network. Description of DIVA analysis: The computation was done with the DIVAnd (Data-Interpolating Variational Analysis in n dimensions), version 2.7.2, using GEBCO 30sec topography for the spatial connectivity of water masses. Horizontal correlation length and vertical correlation length vary spatially depending on the topography and domain. Depth range: 0.0, 5.0, 10.0, 15.0, 20.0, 25.0, 30.0, 35.0, 40.0, 45.0, 50.0, 55.0, 60.0, 65.0, 70.0, 75.0, 80.0, 85.0, 90.0, 95.0, 100.0, 125.0, 150.0, 175.0, 200.0, 225.0, 250.0, 275.0, 300.0, 325.0, 350.0, 375.0, 400.0, 425.0, 450.0, 475.0, 500.0, 550.0, 600.0, 650.0, 700.0, 750.0, 800.0, 850.0, 900.0, 950.0, 1000.0, 1050.0, 1100.0, 1150.0, 1200.0, 1250.0, 1300.0, 1350.0, 1400.0, 1450.0, 1500.0, 1550.0, 1600.0, 1650.0, 1700.0, 1750.0, 1800.0, 1850.0, 1900.0, 1950.0, 2000.0, 2100.0, 2200.0, 2300.0, 2400.0, 2500.0, 2600.0, 2700.0, 2800.0, 2900.0, 3000.0, 3100.0, 3200.0, 3300.0, 3400.0, 3500.0, 3600.0, 3700.0, 3800.0, 3900.0, 4000.0, 4100.0, 4200.0, 4300.0, 4400.0, 4500.0, 4600.0, 4700.0, 4800.0, 4900.0, 5000.0, 5100.0, 5200.0, 5300.0, 5400.0, 5500.0 m. Units: umol/l. The horizontal resolution of the produced DIVAnd analysis is 0.25 degrees.
-

'''DEFINITION''' We have derived an annual eutrophication and eutrophication indicator map for the North Atlantic Ocean using satellite-derived chlorophyll concentration. Using the satellite-derived chlorophyll products distributed in the regional North Atlantic CMEMS MY Ocean Colour dataset (OC- CCI), we derived P90 and P10 daily climatologies. The time period selected for the climatology was 1998-2017. For a given pixel, P90 and P10 were defined as dynamic thresholds such as 90% of the 1998-2017 chlorophyll values for that pixel were below the P90 value, and 10% of the chlorophyll values were below the P10 value. To minimise the effect of gaps in the data in the computation of these P90 and P10 climatological values, we imposed a threshold of 25% valid data for the daily climatology. For the 20-year 1998-2017 climatology this means that, for a given pixel and day of the year, at least 5 years must contain valid data for the resulting climatological value to be considered significant. Pixels where the minimum data requirements were met were not considered in further calculations. We compared every valid daily observation over 2021 with the corresponding daily climatology on a pixel-by-pixel basis, to determine if values were above the P90 threshold, below the P10 threshold or within the [P10, P90] range. Values above the P90 threshold or below the P10 were flagged as anomalous. The number of anomalous and total valid observations were stored during this process. We then calculated the percentage of valid anomalous observations (above/below the P90/P10 thresholds) for each pixel, to create percentile anomaly maps in terms of % days per year. Finally, we derived an annual indicator map for eutrophication levels: if 25% of the valid observations for a given pixel and year were above the P90 threshold, the pixel was flagged as eutrophic. Similarly, if 25% of the observations for a given pixel were below the P10 threshold, the pixel was flagged as oligotrophic. '''CONTEXT''' Eutrophication is the process by which an excess of nutrients – mainly phosphorus and nitrogen – in a water body leads to increased growth of plant material in an aquatic body. Anthropogenic activities, such as farming, agriculture, aquaculture and industry, are the main source of nutrient input in problem areas (Jickells, 1998; Schindler, 2006; Galloway et al., 2008). Eutrophication is an issue particularly in coastal regions and areas with restricted water flow, such as lakes and rivers (Howarth and Marino, 2006; Smith, 2003). The impact of eutrophication on aquatic ecosystems is well known: nutrient availability boosts plant growth – particularly algal blooms – resulting in a decrease in water quality (Anderson et al., 2002; Howarth et al.; 2000). This can, in turn, cause death by hypoxia of aquatic organisms (Breitburg et al., 2018), ultimately driving changes in community composition (Van Meerssche et al., 2019). Eutrophication has also been linked to changes in the pH (Cai et al., 2011, Wallace et al. 2014) and depletion of inorganic carbon in the aquatic environment (Balmer and Downing, 2011). Oligotrophication is the opposite of eutrophication, where reduction in some limiting resource leads to a decrease in photosynthesis by aquatic plants, reducing the capacity of the ecosystem to sustain the higher organisms in it. Eutrophication is one of the more long-lasting water quality problems in Europe (OSPAR ICG-EUT, 2017), and is on the forefront of most European Directives on water-protection. Efforts to reduce anthropogenically-induced pollution resulted in the implementation of the Water Framework Directive (WFD) in 2000. '''CMEMS KEY FINDINGS''' The coastal and shelf waters, especially between 30 and 400N that showed active oligotrophication flags for 2020 have reduced in 2021 and a reversal to eutrophic flags can be seen in places. Again, the eutrophication index is positive only for a small number of coastal locations just north of 40oN in 2021, however south of 40oN there has been a significant increase in eutrophic flags, particularly around the Azores. In general, the 2021 indicator map showed an increase in oligotrophic areas in the Northern Atlantic and an increase in eutrophic areas in the Southern Atlantic. The Third Integrated Report on the Eutrophication Status of the OSPAR Maritime Area (OSPAR ICG-EUT, 2017) reported an improvement from 2008 to 2017 in eutrophication status across offshore and outer coastal waters of the Greater North Sea, with a decrease in the size of coastal problem areas in Denmark, France, Germany, Ireland, Norway and the United Kingdom. '''DOI (product):''' https://doi.org/10.48670/moi-00195