 Catalogue PIGMA
/Données dérivées/Indicateurs
Type of resources
Available actions
Topics
Keywords
Contact for the resource
Provided by
Years
Formats
Representation types
Update frequencies
Scale
Resolution
-
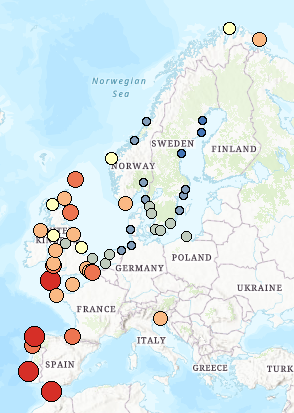
This dataset presents the estimated multiplication factor by which the frequency of flooding events of a given height in European tide gauges will change between 2010 and 2100, due to projected regional sea relative level rise under the Representative Concentration Pathways (RCP) 4.5 scenario. Values larger than 1 indicate an increase in flooding frequency. This dataset is derived from the Figure 13.25(b) of the Working Group I contribution to the IPCC Fifth Assessment Report (http://www.climatechange2013.org/images/report/WG1AR5_ALL_FINAL.pdf). This dataset also contributes to an earlier version of the EEA Indicator "Global and European sea-level": https://www.eea.europa.eu/data-and-maps/indicators/sea-level-rise-5/assessment.
-
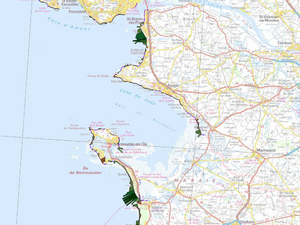
Cette couche représente l'évolution du trait de côte issue de l'indicateur national de l'érosion côtière sous la forme d'histogrammes le long du linéaire côtier. Les données concernent la métropole et les cinq (5) départements d'outre-mer (Guadeloupe, Martinique, Guyane, Mayotte et Réunion).
-
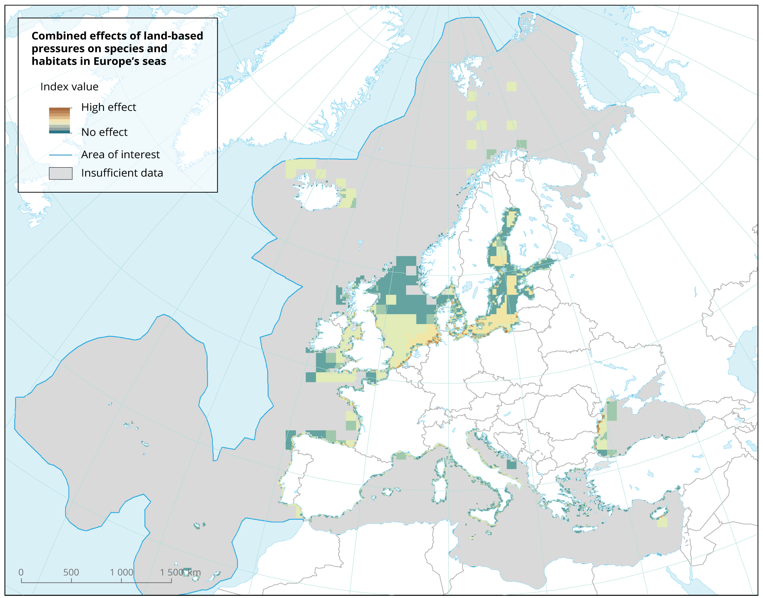
The dataset presents the potential combined effects of land-based pressures on marine species and habitats estimated using the method for assessment of cumulative effects, for the entire suite of pressures and a selected set of marine species groups and habitats by an index (Halpern et al. 2008). The spatial assessment of combined effects of multiple pressures informs of the risks of human activities on the marine ecosystem health. The methodology builds on the spatial layers of pressures and ecosystem components and on an estimate of ecosystem sensitivity through an expert questionnaire. The raster dataset consists of a division of the Europe's seas in 10km and 100 km grid cells, which values represents the combined effects index values for pressures caused by land-based human activities. The relative values indicate areas where the pressures potentially affect the marine ecosystem. This dataset underpins the findings and cartographic representations published in the report "Marine Messages" (EEA, 2020).
-
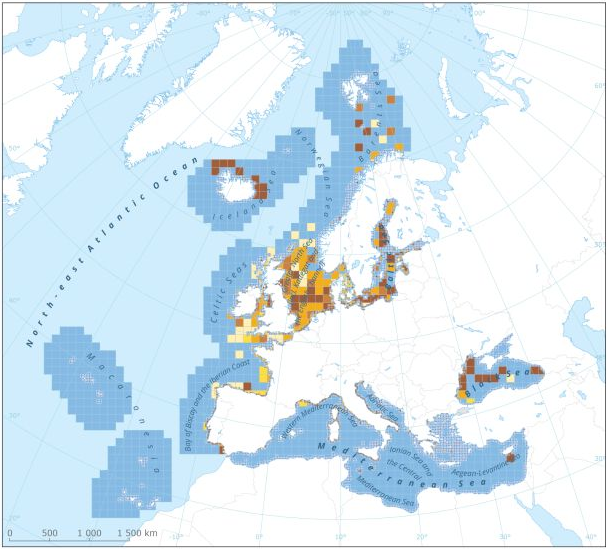
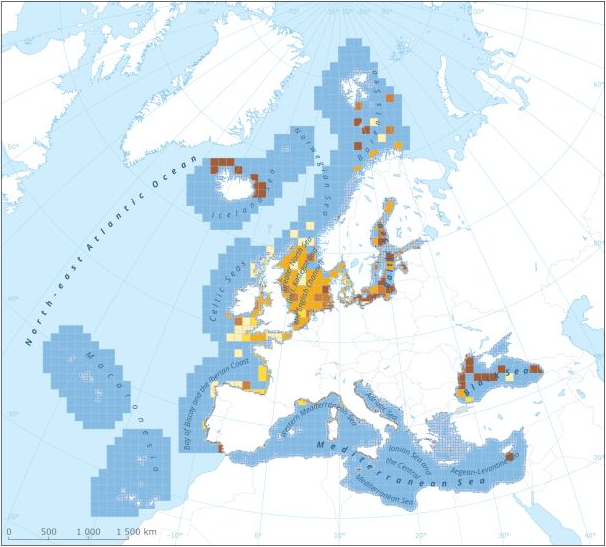
This dataset presents the resulting assessment grid (based on the EEA reference grid) with the classification of chemical status of the transitional, coastal and marine waters in the context of the Water Framework Directive (WFD) and the Marine Strategy Framework Directive (MSFD). This classification has been performed using the CHASE+ tool, with classifications of the matrices ‘water’, ‘sediment’ and ‘biota’ and indicators of ‘biological effects’, as well as an integrated classification of chemical status, combining results of all matrices. The chemical status is evaluated in five classes, where NPAhigh and NPAgood are recognised as ‘non-problem areas’ and PAmoderate, PApoor and PAbad are recognised as ‘problem areas’. This is the assessment made excluding concentrations of mercury (Hg). The overall area of interest used is based on the marine regions and subregions under the Marine Strategy Framework Directive. Additionally, Norwegian (Barent Sea and Norwegian Sea) and Icelandic waters (’Iceland Sea’) have been added (see Surrounding seas of Europe). Note that within the North East Atlantic region only the subregions within EEZ boundaries (~200 nm) have been included. This dataset underpins the findings and cartographic representations published in the report "Contaminants in Europe's Seas" (EEA, 2019).
-
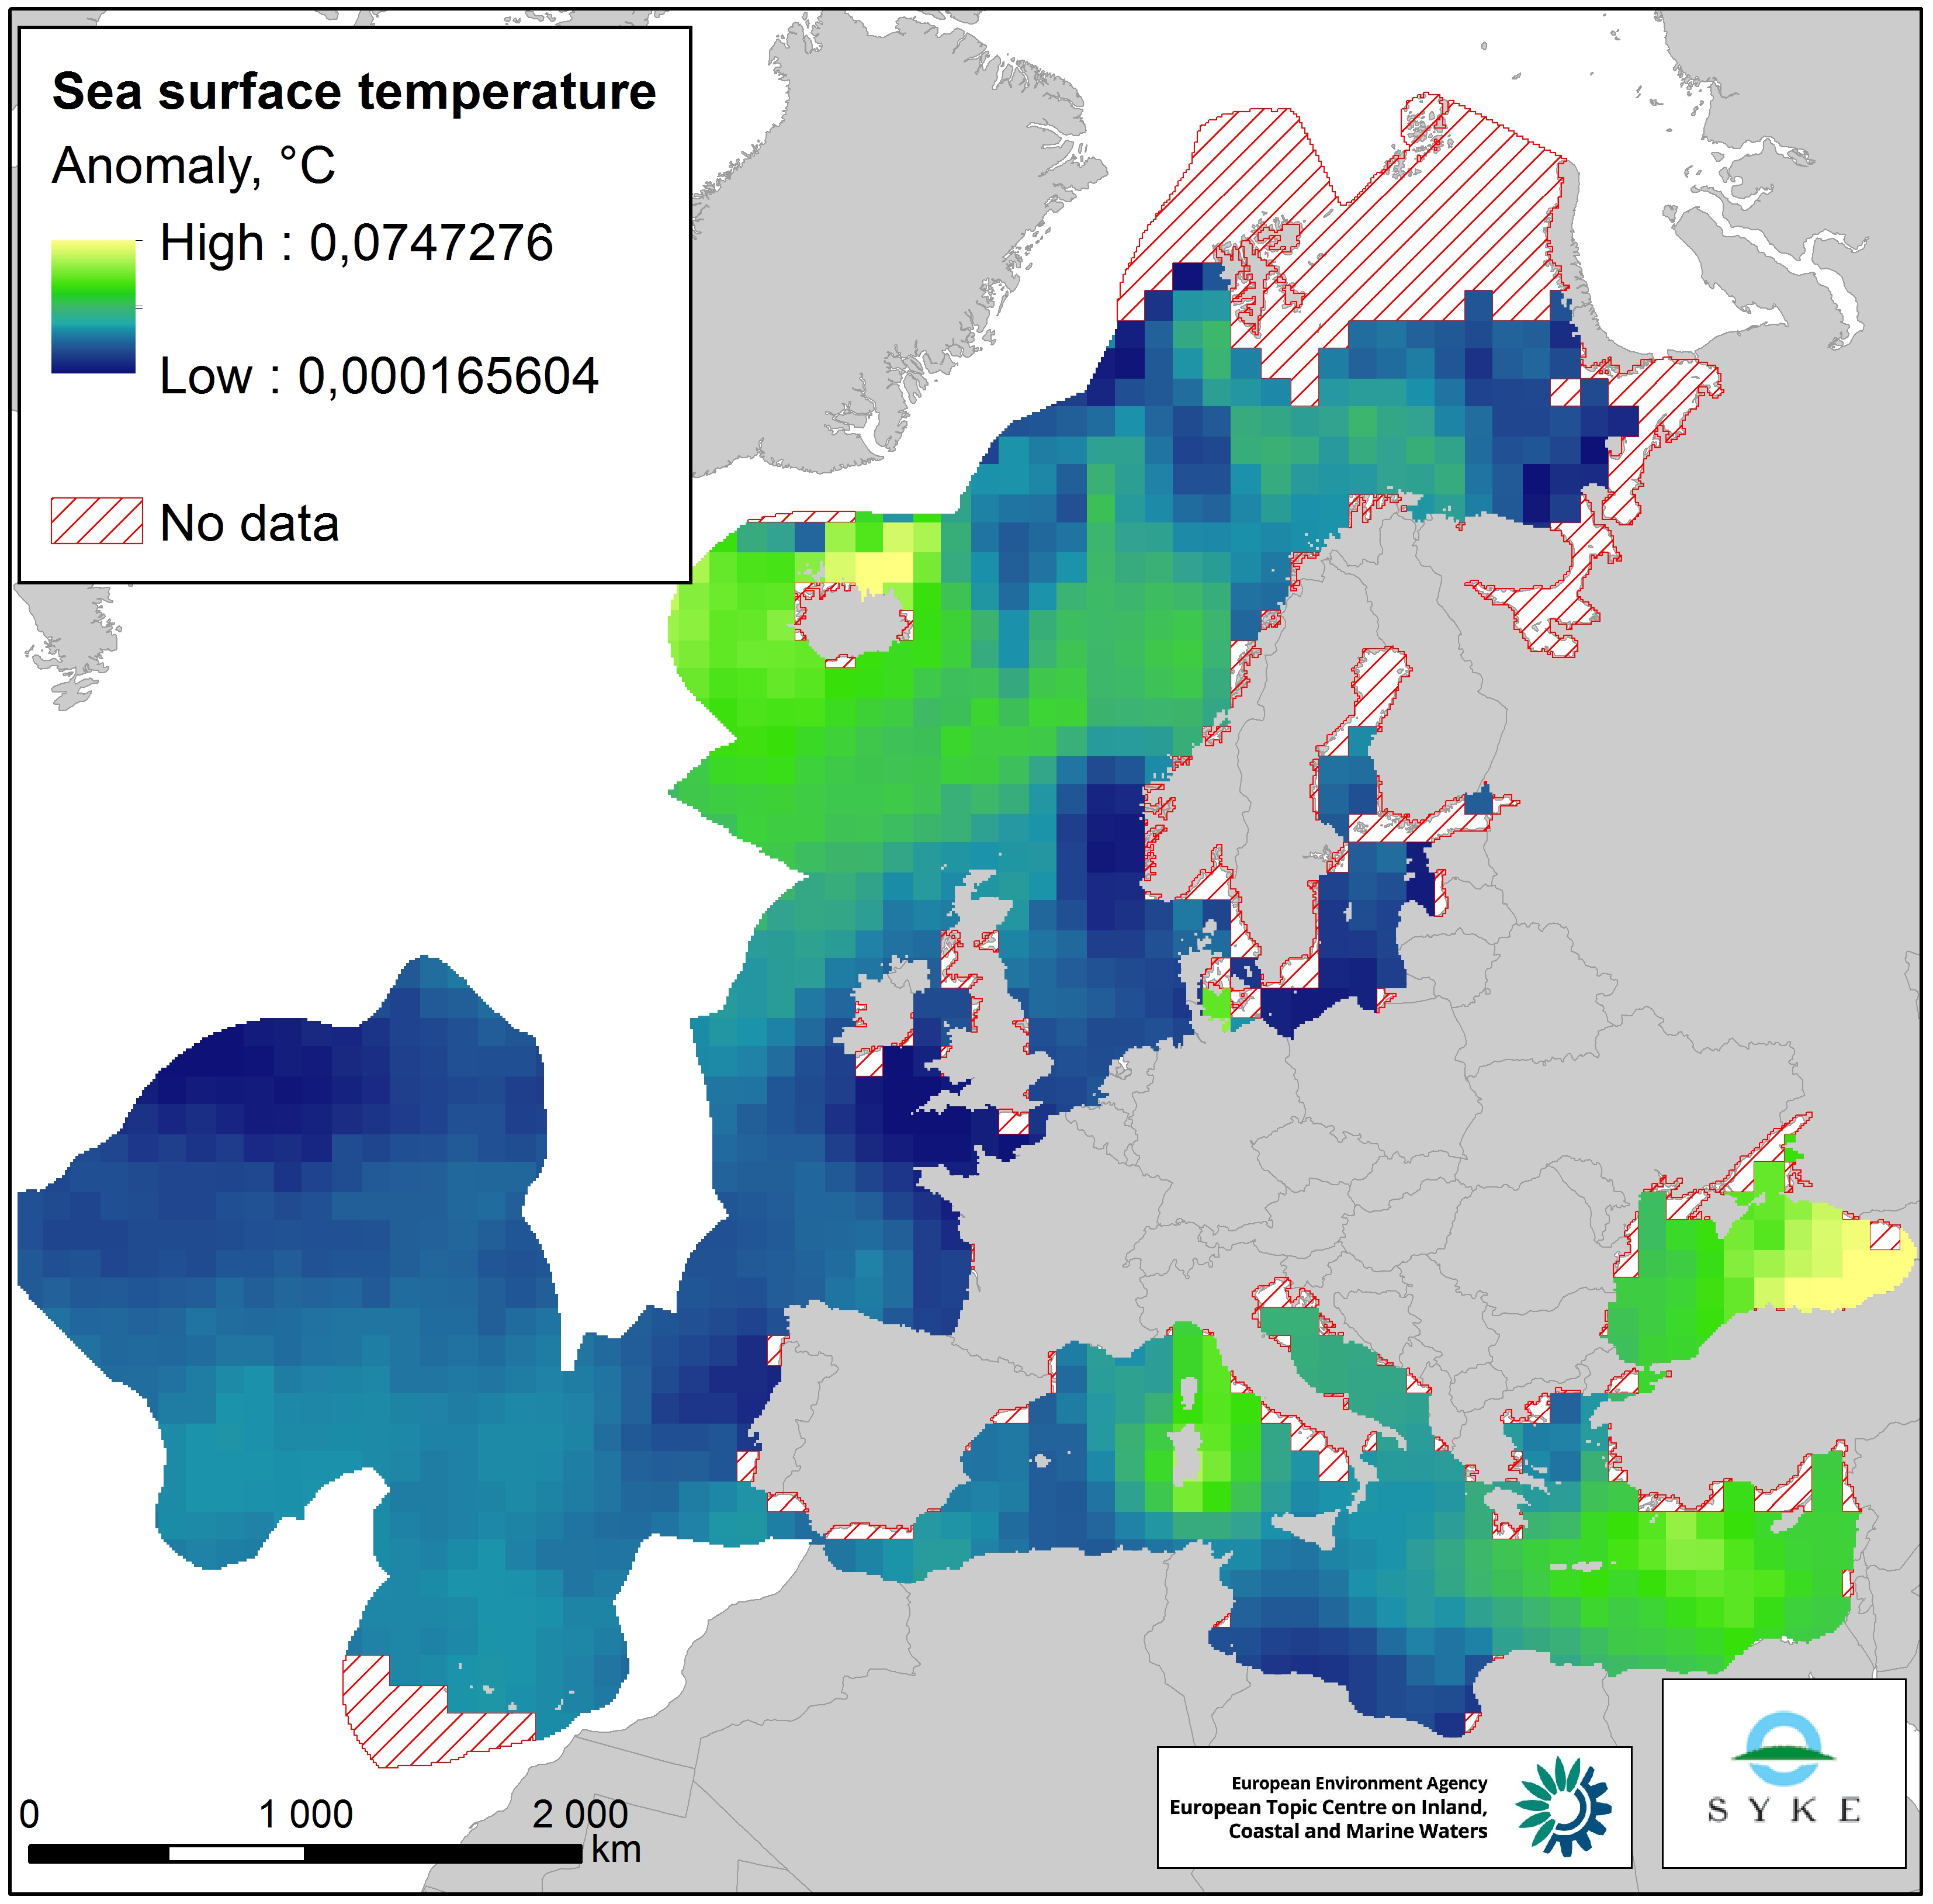
This raster dataset represents the Sea Surface Temperature (SST) anomalies, i.e. changes of sea temperatures, in the European Seas. The dataset is based on the map "Mean annual sea surface temperature trend in European seas" by Istituto Nazionale di Geofisica e Vulcanologia (INGV), which depicts the linear trend in sea surface temperature (in °C/yr) for the European seas over the past 25 years (1989-2013). Since all changes of sea temperatures can be considered to have an impact on the marine environment, the pressure layer includes absolute values of SST anomalies, i.e. negative/decreasing temperature trends were changed to positive values so that they represent a pressure. The original data was in a 1° grid format but was converted to a 100 km resolution, adapted to the EEA 10 km grid and clipped with the area of interest. This dataset has been prepared for the calculation of the combined effect index, produced for the ETC/ICM Report 4/2019 "Multiple pressures and their combined effects in Europe's seas" available on: https://www.eionet.europa.eu/etcs/etc-icm/etc-icm-report-4-2019-multiple-pressures-and-their-combined-effects-in-europes-seas-1.
-
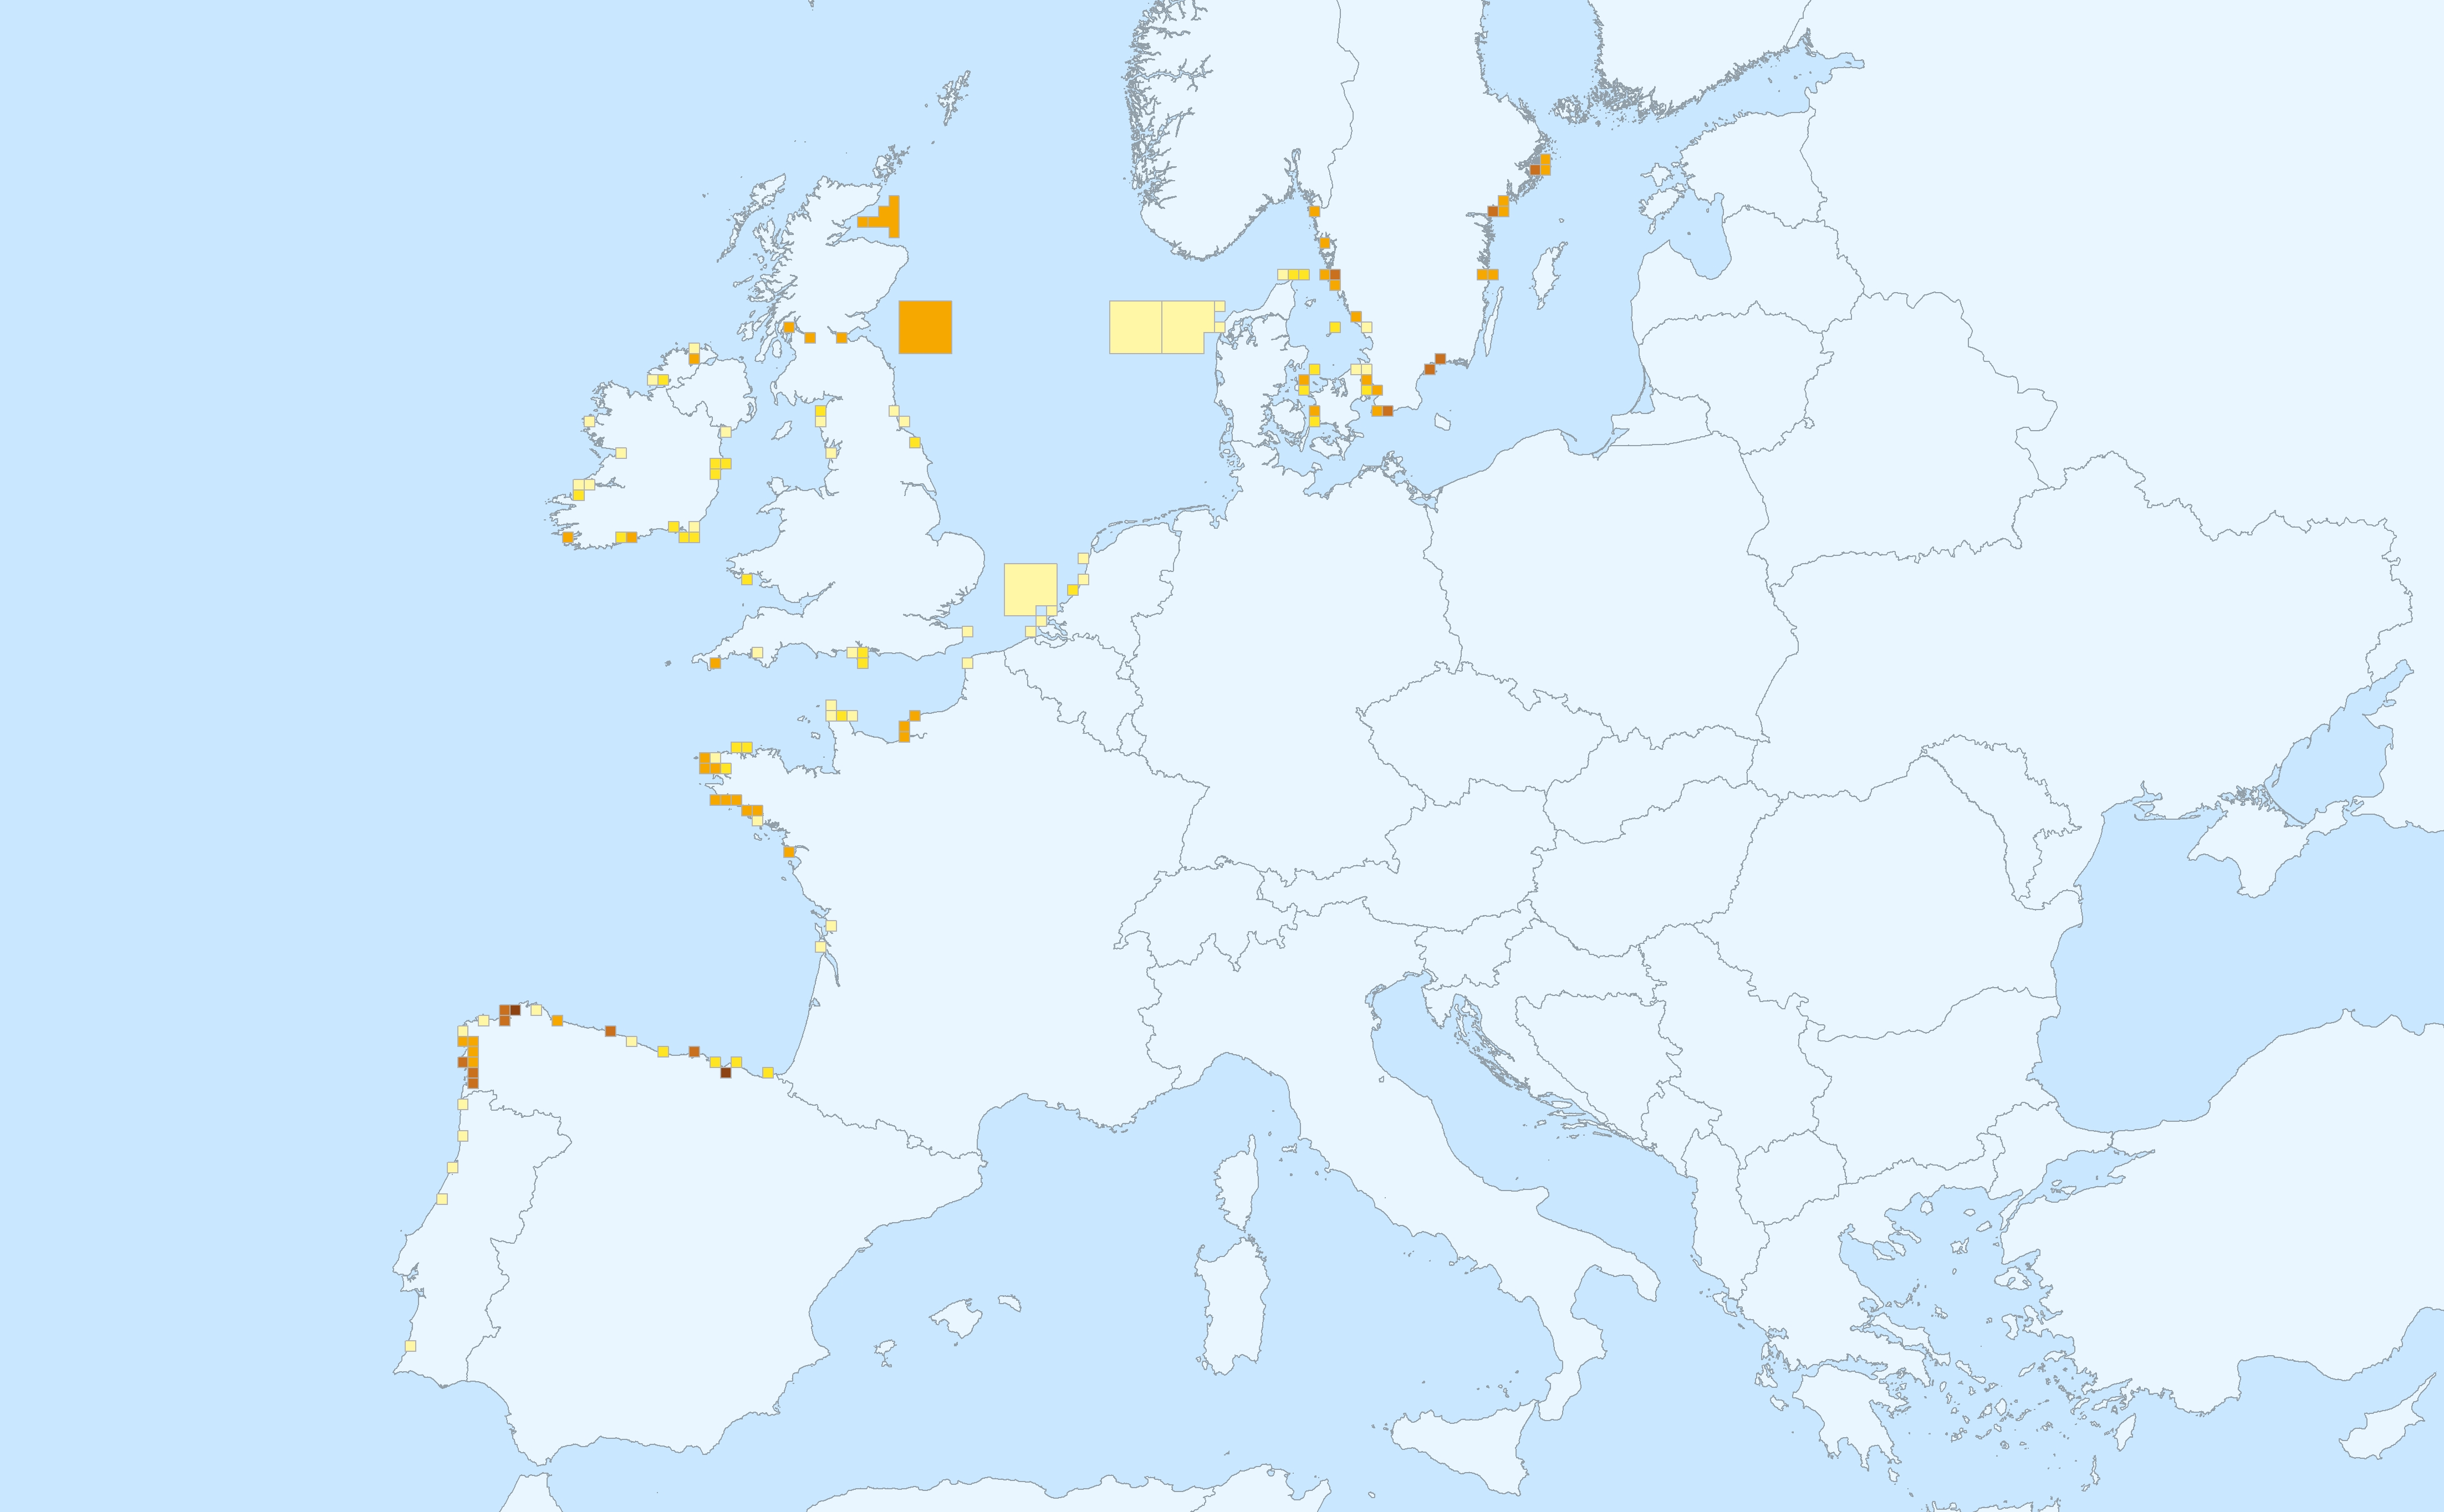
This data set presents the resulting assessment grid (based on the EEA reference grid) with the classification of chemical status of the transitional, coastal and marine waters in the context of the Water Framework Directive (WFD) and the Marine Strategy Framework Directive (MSFD), providing a mapping of contamination 'problem areas' and 'non-problem areas' based on measurements of biological effects. This classification has been performed using the CHASE+ tool, with classifications of the of contaminant status of indicators of biological effects. The status is evaluated in five classes, where NPAhigh and NPAgood are recognised as ‘non-problem areas’ and PAmoderate, PApoor and PAbad are recognised as ‘problem areas’. Monitoring biological effects is restricted to a few indicators (e.g. imposex) and data coverage is currently limited. Biological effects have thus been addressed in only 134 assessment units, mostly in the Baltic Sea, the North Sea and the North-East Atlantic Ocean. This data set underpins the findings and cartographic representations published in the EEA report “Contaminants in Europe’s seas” (No 25/2018). See the mentioned report for further information.
-
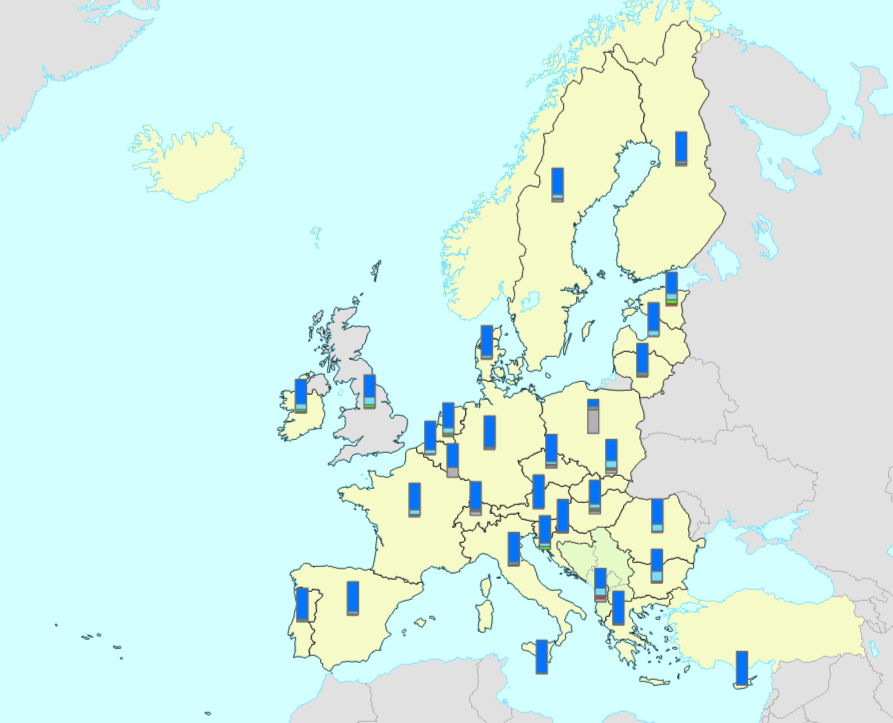
The bathing water quality data services include all coastal and inland bathing waters reported and assessed in the European Union Member States, Albania, Switzerland and the United Kingdom. The data is reported annually in the scope of the Bathing Water Directive (Directive 2006/7/EC of the European Parliament and of the Council of 15 February 2006, BWD) reporting obligations. The map services in https://water.discomap.eea.europa.eu/arcgis/rest/services/BathingWater show the location of the bathing waters and the assessment of bathing water quality for the last reported bathing season, as well as for the ten previous bathing seasons. Each bathing water is assessed for three statuses: 1) monitoring calendar status, 2) management status, 3) bathing water quality status. The monitoring calendar status evaluates the implementation of the monitoring calendar in the last reported season (as defined in Annex IV of the Bathing Water Directive). The management status evaluates the management in the last assessment period, whether the bathing water was continuously monitored or not. The bathing quality status evaluates the quality of bathing waters according to the two microbiological parameters: Escherichia coli and Intestinal enterococci (as defined in Annexes I and II of the Bathing Water Directive). The bathing water quality is classified in one of four classes: “Excellent”, “Good”, “Sufficient” or “Poor”. The status “Not classified” is applied if there are not enough available samples to evaluate the water quality. The data service in https://discodata.eea.europa.eu/ contains the results of the bathing water status since 1990: [WISE_BWD].[latest].[assessment_BathingWaterStatus] It also contains the reported data in the following tables: [WISE_BWD].[latest].[timeseries_Characterisation] [WISE_BWD].[latest].[timeseries_SeasonalPeriod] [WISE_BWD].[latest].[timeseries_MonitoringResult] [WISE_BWD].[latest].[spatial_SpatialProtected]
-
This dataset presents the resulting assessment grid (based on the EEA reference grid) with the classification of chemical status of the transitional, coastal and marine waters in the context of the Water Framework Directive (WFD) and the Marine Strategy Framework Directive (MSFD). This classification has been performed using the CHASE+ tool, with classifications of the matrices ‘water’, ‘sediment’ and ‘biota’ and indicators of ‘biological effects’, as well as an integrated classification of chemical status, combining results of all matrices. The chemical status is evaluated in five classes, where NPAhigh and NPAgood are recognised as ‘non-problem areas’ and PAmoderate, PApoor and PAbad are recognised as ‘problem areas’. This is the assessment made excluding concentrations of mercury (Hg) and polybrominated diphenyl ethers (PBDEs) The overall area of interest used is based on the marine regions and subregions under the Marine Strategy Framework Directive. Additionally, Norwegian (Barent Sea and Norwegian Sea) and Icelandic waters (’Iceland Sea’) have been added (see Surrounding seas of Europe). Note that within the North East Atlantic region only the subregions within EEZ boundaries (~200 nm) have been included. This dataset underpins the findings and cartographic representations published in the report "Contaminants in Europe's Seas" (EEA, 2019): https://www.eea.europa.eu/publications/contaminants-in-europes-seas.
-

This dataset presents the resulting assessment grid (based on the EEA reference grid) with the classification of chemical status of the transitional, coastal and marine waters in the context of the Water Framework Directive (WFD) and the Marine Strategy Framework Directive (MSFD). This classification has been performed using the CHASE+ tool, with classifications of the matrices ‘water’, ‘sediment’ and ‘biota’ and indicators of ‘biological effects’, as well as an integrated classification of chemical status, combining results of all matrices. The chemical status is evaluated in five classes, where NPAhigh and NPAgood are recognised as ‘non-problem areas’ and PAmoderate, PApoor and PAbad are recognised as ‘problem areas’. This is the assessment made excluding concentrations of polybrominated diphenyl ethers (PBDEs) The overall area of interest used is based on the marine regions and subregions under the Marine Strategy Framework Directive. Additionally, Norwegian (Barent Sea and Norwegian Sea) and Icelandic waters (’Iceland Sea’) have been added (see Surrounding seas of Europe). Note that within the North East Atlantic region only the subregions within EEZ boundaries (~200 nm) have been included. This dataset underpins the findings and cartographic representations published in the report "Contaminants in Europe's Seas" (EEA, 2019): https://www.eea.europa.eu/publications/contaminants-in-europes-seas.
-

The dataset presents the potential combined effects of sea-based pressures on marine species and habitats estimated using the method for assessment of cumulative effects, for the entire suite of pressures and a selected set of marine species groups and habitats by an index (Halpern et al. 2008). The spatial assessment of combined effects of multiple pressures informs of the risks of human activities on the marine ecosystem health. The methodology builds on the spatial layers of pressures and ecosystem components and on an estimate of ecosystem sensitivity through an expert questionnaire. The raster dataset consists of a division of the Europe's seas in 10km and 100 km grid cells, which values represents the combined effects index values for pressures caused by sea-based human activities. The relative values indicate areas where the pressures potentially affect the marine ecosystem. This dataset underpins the findings and cartographic representations published in the report "Marine Messages" (EEA, 2020).