 Catalogue PIGMA
SHP
Type of resources
Available actions
Topics
Keywords
Contact for the resource
Provided by
Years
Formats
Representation types
Update frequencies
status
Scale
Resolution
-
This vector dataset represents the benthic broad habitat types in Europe Seas potentially affected by the ship wakes. When navigating, the propellers of ships generate a turbulent mixing of the water that can produce sediment re-suspension in soft bottoms of shallow areas. This can increase the turbidity in those areas, affecting the seafloor organisms (especially those that are directly dependent on light, such as aquatic plants). It may also contribute to an increase of the the eutrophication level of the ecosystem (since the turbid waters may become warmer, which may turn into a reduction of dissolved oxygen in water). Finally, turbidity can produce an increase in the inputs of contaminants and microbial pathogens, since those can become attached to the suspended solids. The dataset has been prepared in the context of the development of the first European Maritime Transport Environmental Report (https://www.eea.europa.eu/publications/maritime-transport).
-
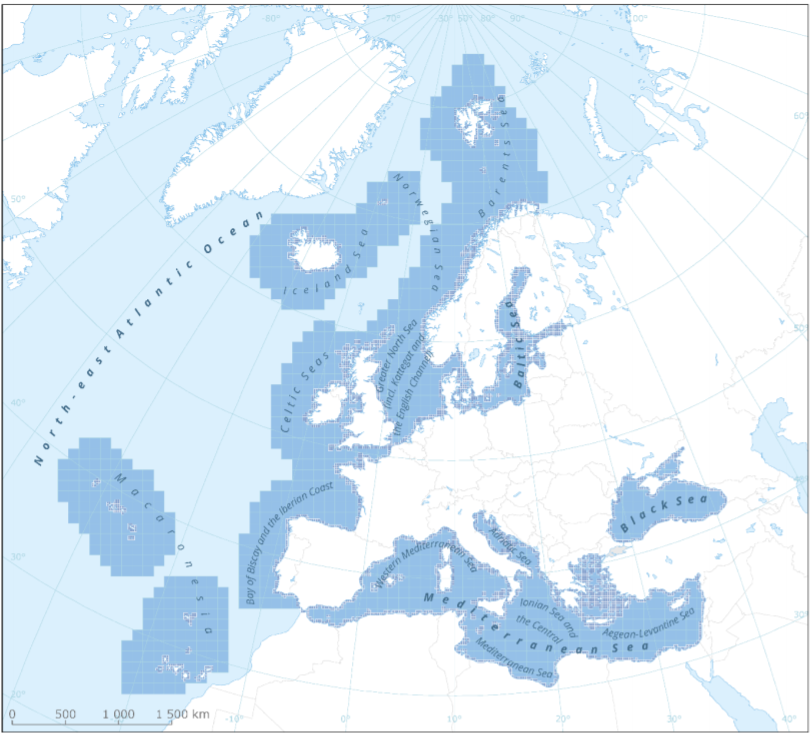
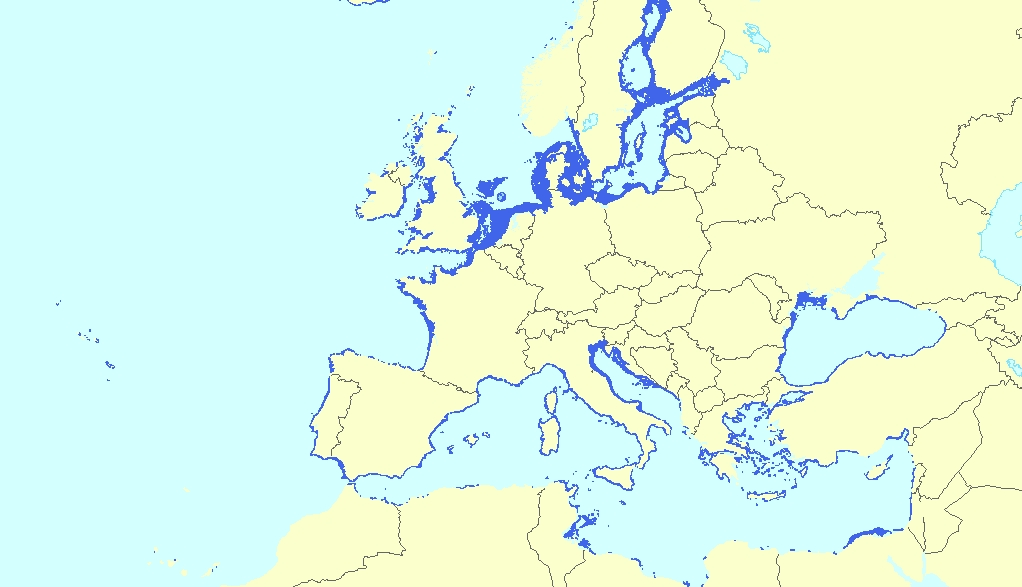
This metadata refers to the EEA marine assessment grid, to which all data and assessment results have been spatially mapped in order to ensure that data can be compared in a uniform way across the European regional seas. The marine assessment grid is based on the EEA reference grid system. The EEA reference grid is based on ERTS89 Lambert Azimuthal Equal Area projection with parameters: latitude of origin 52° N, longitude of origin 10° E, false northing 3 210 000.0 m, false easting 4 321 000.0 m. All grid cells are named with a unique identifier containing information on grid cell size and the distance from origin in meters (easting and northing). An important attribute of the EEA reference grid system is that by using an equal area projection all grid cells are having the same area for the same grid size. In this marine assessment grid, two grid sizes are used: * 100 x 100 km in offshore areas (> 20 km from the coastline) * 20 x 20 km in coastal areas (<= 20 km from the coastline) The grid sizes were choosen after an evaluation of data availability versus the need for sufficient detail in the resulting assessment. The resulting assessment grid is a combination of two grid sizes using the EEA reference grid system. The overall area of interest used in the grid is based on the marine regions and subregions under the Marine Strategy Framework Directive (MSFD). Additionally, Norwegian (Barent Sea and Norwegian Sea) and Icelandic waters (’Iceland Sea’) have been added (see Surrounding seas of Europe). Note that, within the North East Atlantic region, only the subregions within EEZ boundaries (~200 nm) have been included.
-
This dataset presents the resulting assessment grid (based on the EEA reference grid) with the classification of chemical status of the transitional, coastal and marine waters in the context of the Water Framework Directive (WFD) and the Marine Strategy Framework Directive (MSFD). This classification has been performed using the CHASE+ tool, with classifications of the matrices ‘water’, ‘sediment’ and ‘biota’ and indicators of ‘biological effects’, as well as an integrated classification of chemical status, combining results of all matrices. The chemical status is evaluated in five classes, where NPAhigh and NPAgood are recognised as ‘non-problem areas’ and PAmoderate, PApoor and PAbad are recognised as ‘problem areas’. This is the assessment made excluding concentrations of mercury (Hg). The overall area of interest used is based on the marine regions and subregions under the Marine Strategy Framework Directive. Additionally, Norwegian (Barent Sea and Norwegian Sea) and Icelandic waters (’Iceland Sea’) have been added (see Surrounding seas of Europe). Note that within the North East Atlantic region only the subregions within EEZ boundaries (~200 nm) have been included. This dataset underpins the findings and cartographic representations published in the report "Contaminants in Europe's Seas" (EEA, 2019).
-

This dataset presents the resulting assessment grid (based on the EEA reference grid) with the classification of chemical status of the transitional, coastal and marine waters in the context of the Water Framework Directive (WFD) and the Marine Strategy Framework Directive (MSFD). This classification has been performed using the CHASE+ tool, with classifications of the matrices ‘water’, ‘sediment’ and ‘biota’ and indicators of ‘biological effects’, as well as an integrated classification of chemical status, combining results of all matrices. The chemical status is evaluated in five classes, where NPAhigh and NPAgood are recognised as ‘non-problem areas’ and PAmoderate, PApoor and PAbad are recognised as ‘problem areas’. This is the assessment made excluding concentrations of polybrominated diphenyl ethers (PBDEs) The overall area of interest used is based on the marine regions and subregions under the Marine Strategy Framework Directive. Additionally, Norwegian (Barent Sea and Norwegian Sea) and Icelandic waters (’Iceland Sea’) have been added (see Surrounding seas of Europe). Note that within the North East Atlantic region only the subregions within EEZ boundaries (~200 nm) have been included. This dataset underpins the findings and cartographic representations published in the report "Contaminants in Europe's Seas" (EEA, 2019): https://www.eea.europa.eu/publications/contaminants-in-europes-seas.
-
This dataset presents the resulting assessment grid (based on the EEA reference grid) with the classification of ecosystem health of the transitional, coastal and marine waters in the context of the Water Framework Directive (WFD) and the Marine Strategy Framework Directive (MSFD). This classification has been performed using the MESH+ (Marine EcoSystem Health) tool. The MESH+ tool builds on the EEA assessment tools developed and applied in the context of assessing the degree of contamination (CHASE+), eutrophication (HEAT+) and biodiversity (BEAT+) in Europe's seas (EEA, 2018a, 2019c; Vaughan et al., 2019). MESH+ makes use of the same data sets and threshold values used in these assessments but recombines these in a new framework that addresses 'ecosystem condition'. The overall area of interest used is based on the marine regions and subregions under the MSFD. Additionally, Norwegian (Barents Sea and Norwegian Sea) and Icelandic waters (’Iceland Sea’) have been added (see Surrounding seas of Europe). Note that within the North East Atlantic region only the subregions within EEZ boundaries (~200 nm) have been included. The spatial resolution of the assessment grid is 20 km x 20 km in coastal areas and 100 km x 100 km in offshore areas. This dataset underpins the findings and cartographic representations published in the report "Marine Messages II" (EEA, 2020): https://www.eea.europa.eu/publications/marine-messages-2
-
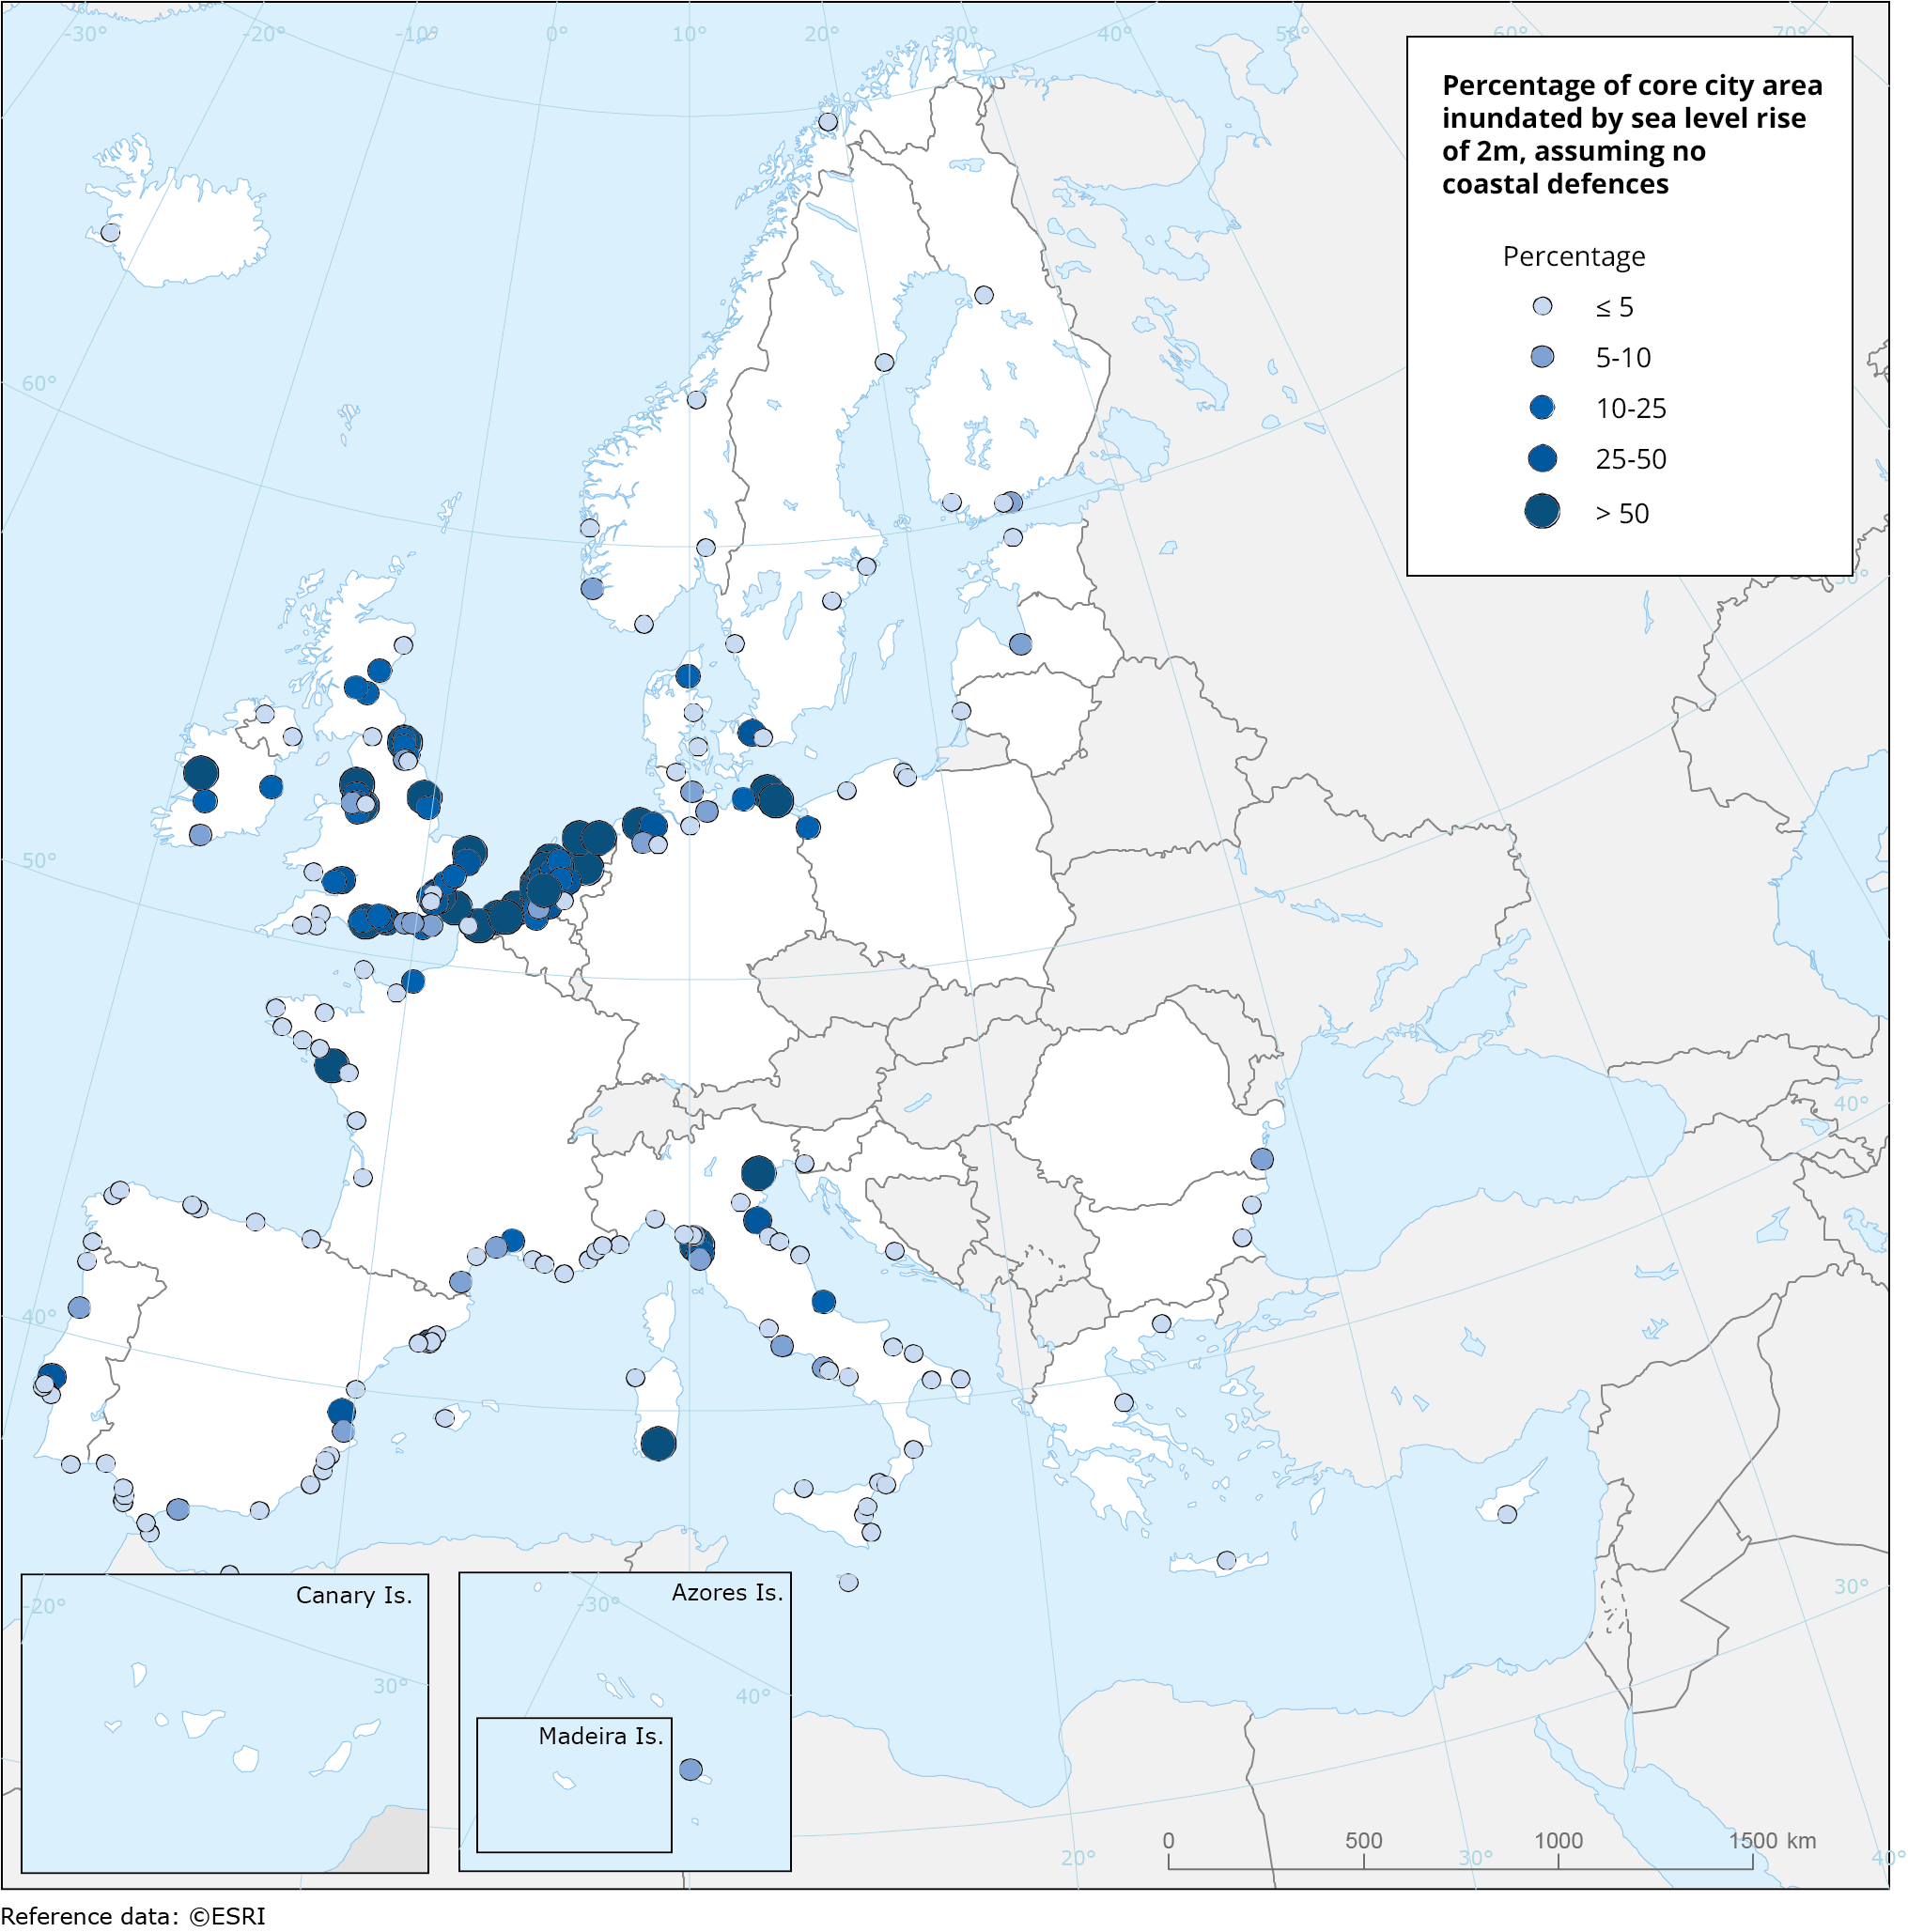
This metadata refers to a dataset that shows the percentage of cities' administrative area (core city based on the Urban Morphological Zones dataset) inundated by the sea level rise of 2 metres, without any coastal flooding defences present for a series of individual coastal European cities (included in Urban Audit). The dataset has been computed using the CReSIS (Centre for Remote Sensing of Ice Sheets) dataset for 2018.
-
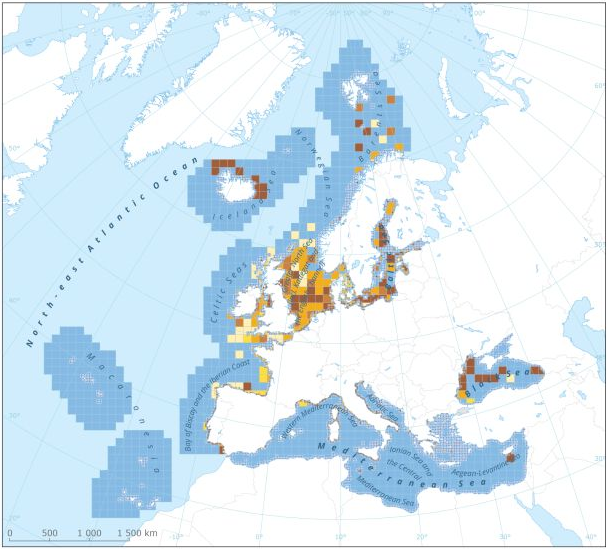
This data set presents the resulting assessment grid (based on the EEA reference grid) with the classification of chemical status of the transitional, coastal and marine waters in the context of the Water Framework Directive (WFD) and the Marine Strategy Framework Directive (MSFD), providing a mapping of contamination 'problem areas' and 'non-problem areas' based on measurements of biological effects. This classification has been performed using the CHASE+ tool, with classifications of the of contaminant status of indicators of biological effects. The status is evaluated in five classes, where NPAhigh and NPAgood are recognised as ‘non-problem areas’ and PAmoderate, PApoor and PAbad are recognised as ‘problem areas’. Monitoring biological effects is restricted to a few indicators (e.g. imposex) and data coverage is currently limited. Biological effects have thus been addressed in only 134 assessment units, mostly in the Baltic Sea, the North Sea and the North-East Atlantic Ocean. This data set underpins the findings and cartographic representations published in the EEA report “Contaminants in Europe’s seas” (No 25/2018). See the mentioned report for further information.
-
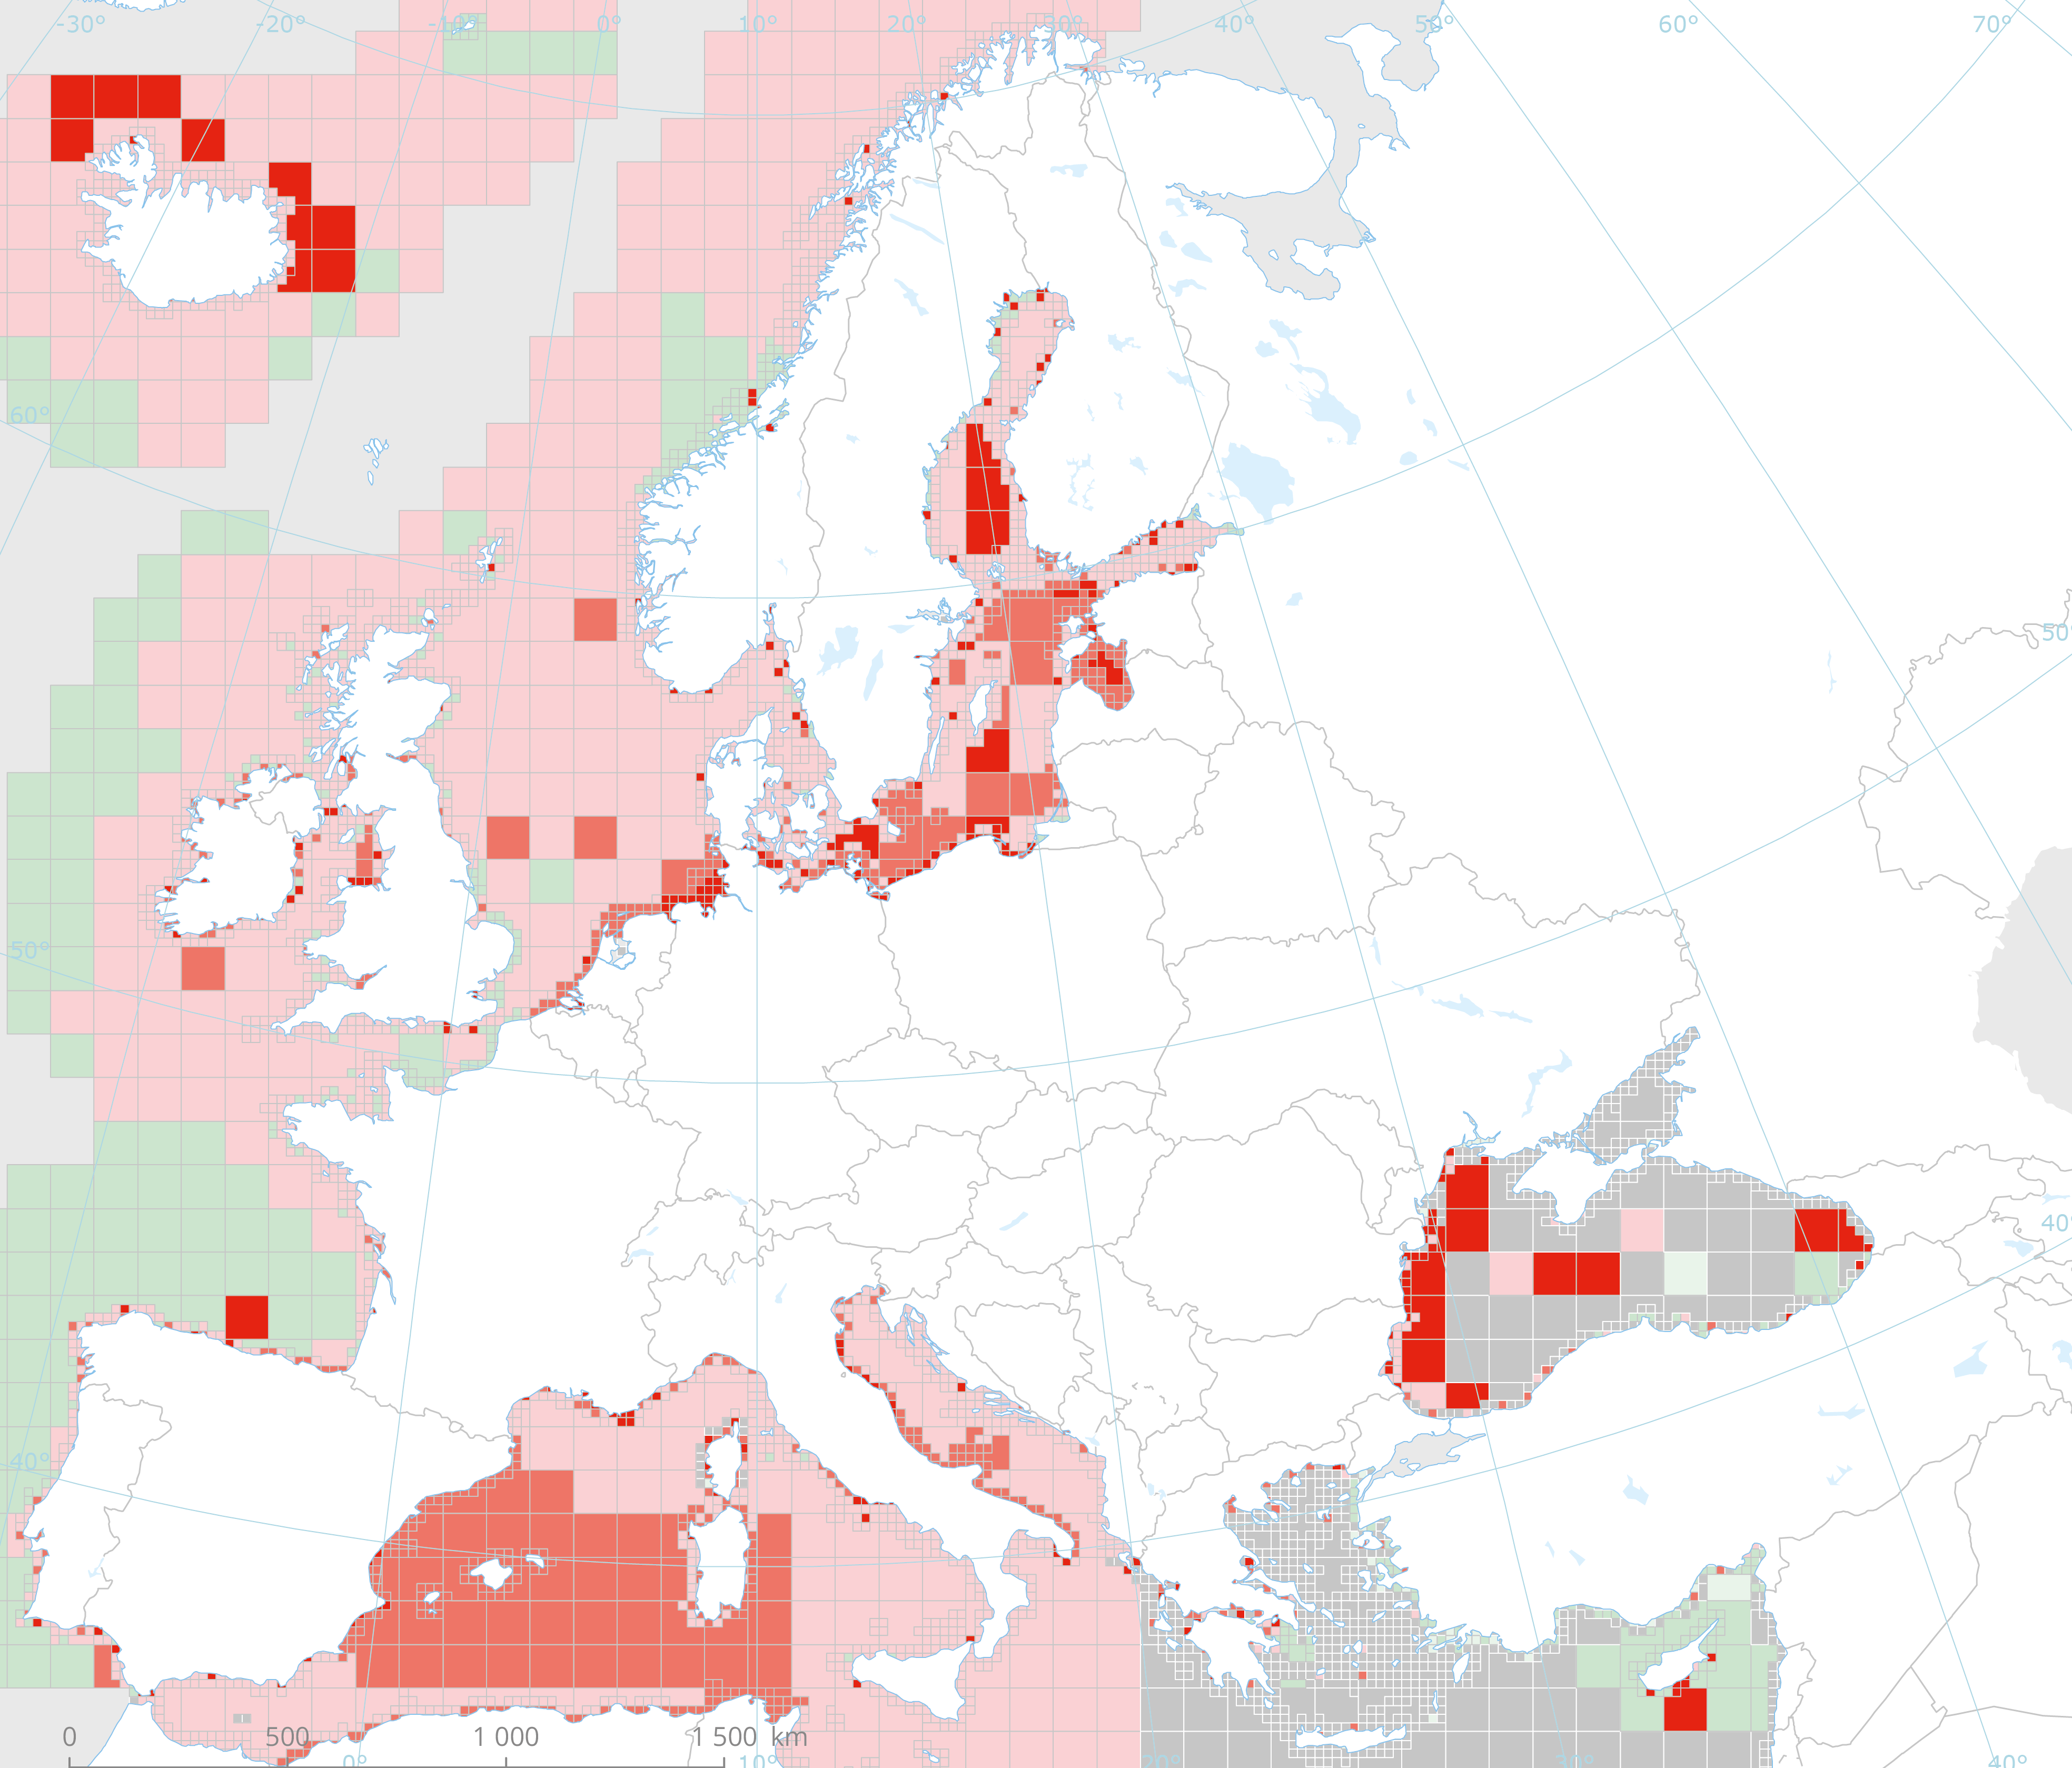
This data set presents the resulting assessment grid (based on the EEA reference grid) with the classification of chemical status of the transitional, coastal and marine waters in the context of the Water Framework Directive (WFD) and the Marine Strategy Framework Directive (MSFD), providing a mapping of contamination 'problem areas' and ‘non-problem areas’ based on measurements in the matrix "sediments". This classification has been performed using the CHASE+ tool, with classifications of the sediments matrix. The chemical status is evaluated in five classes, where NPAhigh and NPAgood are recognised as ‘non-problem areas’ and PAmoderate, PApoor and PAbad are recognised as ‘problem areas’. Most countries in Europe include marine sediments in long-term monitoring activities. Consequently, the data coverage is good, especially in southern parts of the Baltic Sea, the North Sea, the Celtic Sea, the Bay of Biscay, western parts of the Black Sea and the coastal waters of France, Italy and Portugal.The number of assessment units monitored and classified in the North-East Atlantic Ocean is 511. In the Mediterranean Sea, the number of assessment units is 153. Baltic Sea sediments are monitored on 97 assessment units while only 19 areas are assessed in the Black Sea. This data set underpins the findings and cartographic representations published in the EEA report “Contaminants in Europe’s seas” (No 25/2018). See the mentioned report for further information as well as examples of classification excluding specific groups of substances(e.g. metals, PBDEs).
-
Complete Coastline Features for all the countries that produced Corine Land Cover 2000 and have a coastline, with detailed descriptions on the environment and type of coastal areas. Each coast segment has inherited CLC 2000 class, and also the attributes from Eurosion Coastline version 2.1 2004, regarding geomorphology, type of coast and erosion trends.
-
This dataset presents the estimated multiplication factor by which the frequency of flooding events of a given height in European tide gauges will change between 2010 and 2100, due to projected regional sea relative level rise under the Representative Concentration Pathways (RCP) 4.5 scenario. Values larger than 1 indicate an increase in flooding frequency. This dataset is derived from the Figure 13.25(b) of the Working Group I contribution to the IPCC Fifth Assessment Report (http://www.climatechange2013.org/images/report/WG1AR5_ALL_FINAL.pdf). This dataset also contributes to an earlier version of the EEA Indicator "Global and European sea-level": https://www.eea.europa.eu/data-and-maps/indicators/sea-level-rise-5/assessment.