 Catalogue PIGMA
SNO-OISO
Type of resources
Available actions
Topics
Keywords
Contact for the resource
Provided by
Years
Formats
-
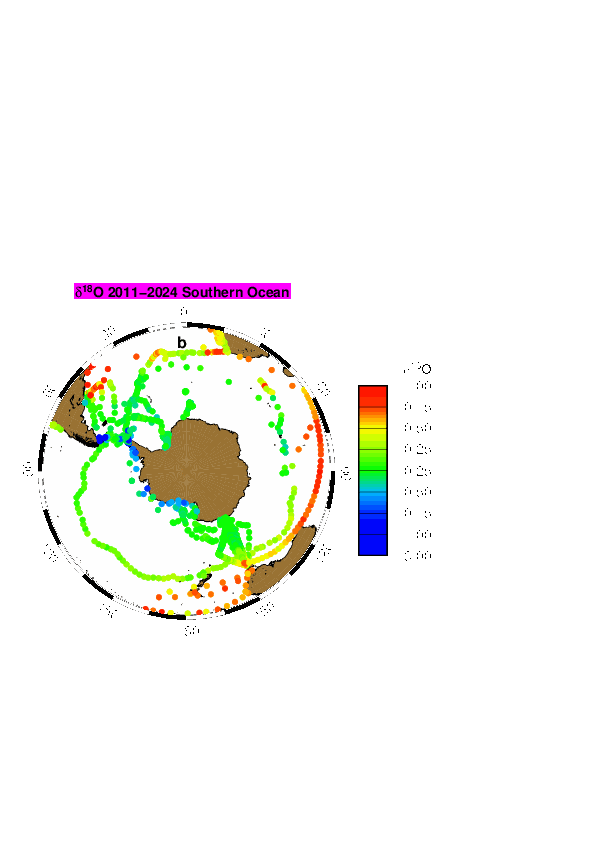
LOCEAN has been in charge of collecting sea water for the analysis of water isotopes on a series of cruises or ships of opportunity mostly in the equatorial Atlantic, in the North Atlantic, in the southern Indian Ocean, in the southern Seas, Nordic Seas, and in the Arctic. The LOCEAN data set of the oxygen and hydrogen isotope (δ18O and δD) of marine water covers the period 1998 to 2019, but the effort is ongoing. Most data prior to 2010 (only δ18O) were analyzed using isotope ratio mass spectrometry (Isoprime IRMS) coupled with a Multiprep system (dual inlet method), whereas most data since 2010 (and a few earlier data) were obtained by cavity ring down spectrometry (CRDS) on a Picarro CRDS L2130-I, or less commonly on a Picarro CRDS L2120-I. Occasionally, some data were also run by Marion Benetti on an Isoprime IRMS coupled to a GasBench (dual inlet method) at the university of Iceland (Reykjavik). On the LOCEAN Picarro CRDS, most samples were initially analyzed after distillation, but since 2016, they have often been analyzed using a wire mesh to limit the spreading of sea salt in the vaporizer. Some of the samples on the CRDS were analyzed more than once on different days, when repeatability for the same sample was not sufficient or the daily run presented a too large drift. Accuracy is best when samples are distilled, and for δD are better on the Picarro CRDS L2130-I than on the Picarro CRDS L2120-I. Usually, we found that the reproducibility of the δ18O measurements is within ± 0.05 ‰ and of the δD measurements within ± 0.30 ‰, which should be considered an upper estimate of the error on the measurement on a Picarro CRDS. The water samples were kept in darkened glass bottles (20 to 50 ml) with special caps, and were often (but not always) taped afterwards. Once brought back in Paris, the samples were often stored in a cold room (with temperature close to 4°C), in particular if they were not analyzed within the next three months. There is however the possibility that some samples have breathed during storage. We found it happening on a number of samples, more commonly when they were stored for more than 5 years before being analyzed. We also used during one cruise bottles with not well-sealed caps (M/V Nuka Arctica in April 2019), which were analyzed within 3 months, but for which close to one third of the samples had breathed. We have retained those analyses, but added a flag ‘3’ meaning probably bad, at least on d-excess (outside of regions where sea ice forms or melts, for the analyses done on the Picarro CRDS, excessive evaporation is usually found with a d-excess criterium (which tends to be too low); for the IRMS analyses, it is mostly based when excessive scatter is found in the S- δ18O scatter plots or between successive data, in which case some outliers were flagged at ‘3’). In some cases when breathing happened, we found that d-excess can be used to produce a corrected estimate of δ18O and δD (Benetti et al., 2016). When this method was used a flag ‘1’ is added, indicating ‘probably good’ data, and should be thought as not as accurate as the data with no ‘correction’, which are flagged ‘2’ or ‘0’. We have adjusted data to be on an absolute fresh-water scale based on the study of Benetti et al. (2017), and on further tests with the different wire meshes used more recently. We have also checked the consistency of the runs in time, as there could have been changes in the internal standards used. On the Isoprime IRMS, it was mostly done using different batches of ‘Eau de Paris’ (EDP), whereas on the Picarro CRDS, we used three internal standards kept in metal tanks with a slight overpressure of dry air). The internal standards have been calibrated using VSMOW and GISP, and were also sent to other laboratories to evaluate whether they had drifted since the date of creation (as individual sub-standards have typically stored for more than 5-years). These comparisons are still not fully statisfactory to evaluate possible drifts in the sub-standards. Version V5 contains only one global file (ALL-Wisotopes-V5). However, up to version V4, individual files corresponded to regional subsets : - SO: Southern Ocean including cruise station and surface data mostly from 2017 in the Weddell Sea (WAPITI Cruise JR160004, DOI:10.17882/54012), as well as in the southern Ocean south of 20°S - SI: OISO cruise station and surface data in the southern Indian Ocean (since 1998) (DOI:10.18142/228) - EA: 20°N-20°S cruise station and surface data (since 2005), in particular in the equatorial Atlantic from French PIRATA (DOI:10.18142/14) and EGEE cruises (DOI:10.18142/95) - NA: 20°N-72°N station and surface data, mostly in the North Atlantic from Oceanographic cruises as well as from ships of opportunity (this includes in particular OVIDE cruise data since 2002 (DOI:10.17882/46448), CATARINA, BOCATS1 and BOCATS2 (PID2019-104279GB-C21/AEI/10.13039/501100011033) cruises funded by the Spanish Research Agency, RREX2017 2017 cruise data (DOI:10.17600/17001400), SURATLANT data set since 2011 (DOI:10.17882/54517), Nuka Arctica and Tukuma Arctica data since 2012, STRASSE (DOI:10.17600/12040060) and MIDAS cruise data in 2012-2013, as well as surface data from various ships of opportunity since 2012) - NS: Nordic Sea data from cruises in 2002-2018 - AS: Arctic Ocean north of 72°N, in particular from two Tara cruises (in 2006-2008 and 2013) and expeditions since 2020 - PM: miscellaneous data in tropical Pacific, Indian Ocean, Mediterranean Sea and Black Sea In some regions, such as in the Indian Ocean, it is valuable to combine different subsets to have the full data distribution. The files are in csv format reported, and starting with version V1, it is reported as: - Cruise name, station id, bottle number, day, month, year, hour, minute, latitude, longitude, pressure (db), temperature (°C), it, salinity (pss-78), is, dissolved oxygen (micromol/kg), io2, δ18O, iO, d D, iD, d-excess, id, method type - Temperature is an in situ temperature - Salinity is a practical salinity it, is, io2, iO, iD, id are quality indices equal to: - 0 no quality check (but presumably good data) - 1 probably good data - 2 good data - 3 probably bad data - 4 certainly bad data - 9 missing data (and the missing data are reported with an unlikely missing value) The method type is 1 for IRMS measurements, 2 for CRDS measurement of a saline water sample, 3 for CRDS measurement of a distilled water sample.
-
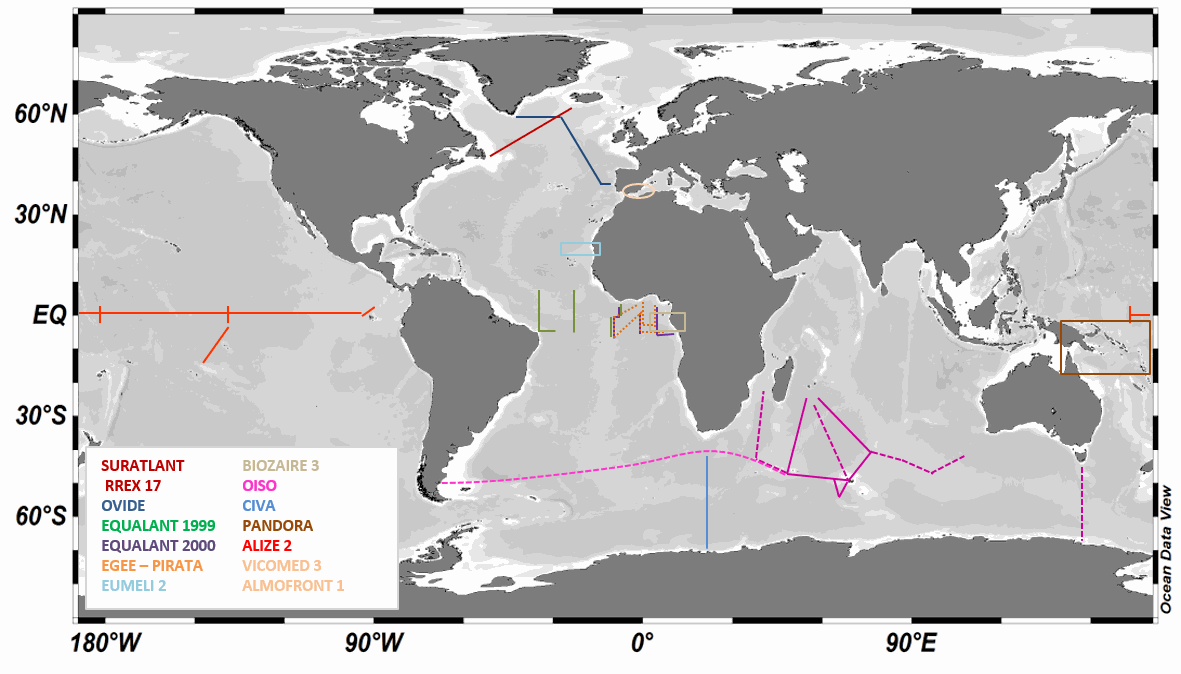
LOCEAN has been in charge of analyzing the isotopic composition of the dissolved inorganic carbon (DIC) in sea water collected during a series of cruises or ships of opportunity mostly in the southern Indian Ocean , the North Atlantic, and the equatorial Atlantic, but also in the Mediterranean Sea and in the equatorial Pacific. The LOCEAN sea-water samples for δ13CDIC were collected in 125/25 ml glass bottles until 2022/since then and poisoned with HgCl2 (1 ml of saturated solution) before storage in a dark room à 4°C until their measurement. The DIC was extracted from the seawater by acidification with phosphoric acid (H3PO4 85%) and CO2 gas that was produced was collected in a vacuum system following the procedure described by Kroopnick (1974). The isotopic composition of CO2 was determined using a dual inlet-isotopic ratio mass spectrometer (SIRA9-VG) by comparing the 13C/12C ratio of the sample to the 13C/12C ratio of a reference material, the Vienna-Pee Dee Belemnite (V-PDB). The isotopic composition is expressed in the δ-unit defined by Craig (1957)(method type 2). Experience showed that samples older than 3-4 years are likely to have experienced conservation issues and have been dismissed. The mass spectrometer has worked very well until 2014-2015. Afterwards, its aging as well as the aging of the preparation line resulted in more data loss, and often less accurate results. The preparation line was renovated in 2019, and analyses in 2020 were run manually, often repeating the measurement a second time for each sample. Up to 2007-2008, δ13CDIC values have a precision of±0.01 ‰ (Vangriesheim et al.,2009) and a reproducibility of±0.02 ‰. After an interlaboratory comparison exercise led by Claire Normandeau (Dalhousie University), results suggest that recent LOCEAN samples have a slightly poorer reproducibility (±0.04 ‰ ) as well as an offset of -0.13‰ (details available in Reverdin et al., ESSD 2018) that is confirmed by Becker et al. 2016 work by comparison with other cruises after removing the anthropogenic signal. Recent comparisons in early May 2021 with Orsay GEOPS facility samples suggest that the current offset is much smaller and might be +0.03‰. LOCEAN has installed in 2021 a new measurement device by coupling a Picarro G2131-I cavity ring down spectrometer (CRDS) with a CO2 extractor (Apollo SciTech) that will measure at the same time DIC (method type 3) (Leseurre, 2022). Since then, all water samples have been analyzed on this device. Part of the data set, as well as a scientific context and publications are also presented on the WEB site https://www.locean-ipsl.upmc.fr/oceans13c. Individual files correspond to regional subsets of the whole dataset. The file names are based on two letters for the region followed by (-) the cruise or project name (see below) followed by –DICisotopes, followed by either -s (surface data) or -b (subsurface data), and a version number (-V0, …): example SI-OISO-DICisotopes-s-V0; the highest version number corresponds to the latest update of the cruise/project data set, and can be directly downloaded. Earlier versions can be obtained on request, but are not recommended. The region two letters are the followings: - SI: station and surface data in the Southern Indian Ocean that include cruises : INDIGO I (1985 – stn) (https://doi.org/10.17600/85000111) CIVA I (1993 – stn & surf) (https://doi.org/10.17600/93000870) (Archambeau et al., JMS 1998) ANTARES (1993 – stn & surf) (https://doi.org/10.17600/93000600) OISO (*) (since 1998 – stn & surf) (https://doi.org/10.18142/228) (Racapé et al., Tellus 2010, Leseurre, 2022) - EA: station and surface data in the Tropical Atlantic Ocean that include cruises : EQUALANT (1999 & 2000 – surf) (https://doi.org/10.18142/98) EGEE (2005 to 2007 – stn & surf) (https://doi.org/10.18142/95) PIRATA (since 2013 – stn & surf) (https://doi.org/10.18142/14) EUMELI 2 (1991 – stn) (https://doi.org/10.17600/91004011) (Pierre et al., JMS 1994) BIOZAIRE 3 (2003 – stn & surf ) (https://doi.org/10.17600/3010120) (Vangriesheim et al., DSRII, 2009) TARA-Microbiomes (2021 - stn & surf) - NA : station and surface data in the North Atlantic Subpolar gyre that include cruises : OVIDE (**) (since 2002 – stn & surf) (https://doi.org/10.17882/46448) (Racapé et al., 2013) RREX (2017 – stn & surf) (https://doi.org/10.17600/17001400) SURATLANT (since 2010 - surf) (https://doi.org/10.17882/54517) (Racapé et al., BG 2014 ; Reverdin et al., ESSD 2018, Leseurre, 2022) NUKATUKUMA (since 2017- surf) - MS: station data in the Mediterranean sea that include cruises : ALMOFRONT 1 (1991 – stn) (https://doi.org/10.17600/91004211) VICOMED 3 (1990 – stn) (https://doi.org/10.17600/90000711) - PO: tropical Pacific that include cruises : PANDORA (2012 – stn) (https://doi.org/10.17600/12010050) ALIZE2 (1991 – stn & surf) (https://doi.org/10.17600/91002711) (Laube-Lenfant and Pierre, Oceanologica Acta 1994) - SO: station and surface data in the Southern Ocean (except OISO) that include cruises: TARA-Microbiomes (2021-2022, stn & surf) AGULHASII-072022 (2022, stn) CONFLUENCE (1993-1994, stn) - AO: station and surface data in the Arctic Ocean and nearby seas that include cruises: GREENFEEDBACK (2024, stn&surf) TCA (2024, stn) REFUGE ARCTIC (2024, stn) (*) The values for cruises OISO19, 21 and 22 are doubtful (for some, too low) and will require further investigation to find whether adjusted values can be proposed. (**) Some of the OVIDE cruises are also referred to as or GEOVIDE (in 2014), and BOCATS (in 2016). CATARINA, BOCATS1 and BOCATS2 (PID2019-104279GB-C21/AEI/10.13039/501100011033) cruises were funded by the Spanish Research Agency The values of the OVIDE 2010 stations are doubtful (too low), but no particular error was found, and they have been left in the files. Data The files are in csv format reported as: - Cruise name, station id, (bottle number), day, month, year, hour, minute, longitude, latitude, pressure (db), depth (m), temperature (°C), temperature qc, salinity (pss-78), salinity qc, d13CDIC, d13CDIC qc, method type - Temperature is an in situ temperature - Salinity is a practical salinity - Method type (1) acid CO2 extraction from helium stripping technique coupled to mass spectrometer, (2) acid CO2 extraction in a vacuum system coupled to mass spectrometer,(3) CO2 extractor (Apollo SciTech) coupled to CRDS measurements. Temperature qc, salinity qc, d13CDIC qc are quality indices equal to: - 0 no quality check (but presumably good data) - 1 probably good data - 2 good data - 3 probably bad data - 4 certainly bad data - 9 missing data (and the missing data are reported with an unlikely missing value)
-
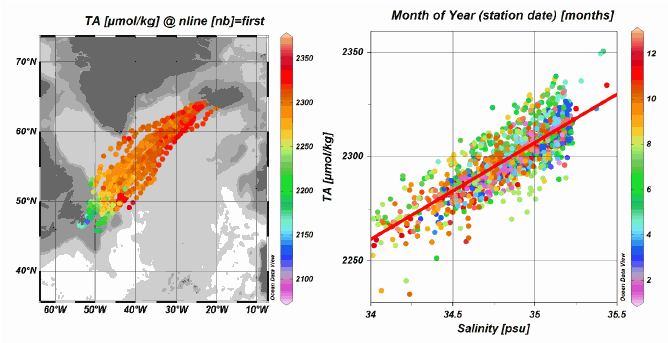
The SURATLANT dataset (SURveillance ATLANTique) consists of individual data of temperature, salinity, dissolved inorganic carbon (DIC) and its isotopic composition d13CDIC, total alkalinity (At), inorganic nutrients and water stable isotopes (δ18O and δD) collected mostly from ships of opportunity since 1993 along transects between Iceland and Newfoundland (shipping company EIMSKIP), as well as, since 2014, between west Greenland and Danemark (shipping company RAL). The data have been validated, qualified, and their accuracy and the overall characteristics of the data set are presented in a paper (Reverdin et al., 2018). The csv file provides a listing of the data with one line for each collection date. This includes collection date, position, temperature, salinity, and the measured, validated and in some cases adjusted variables, as well as a quality code following WOCE/GLODAP format. For water isotopes and isotopic composition of inroganic carbon, a code is also provided indicating the method of measurement used. An additional text-file provides a normalized average seasonal cycle of the 10 variables measured in 5 boxes between the vicinity of Newfoundland to the south-west of Iceland (corresponding to the figure 3 of the paper Reverdin et al in the References). Format and information is provided in the top 25 lines and the gridded seasonal cyle data start at line 26.
-
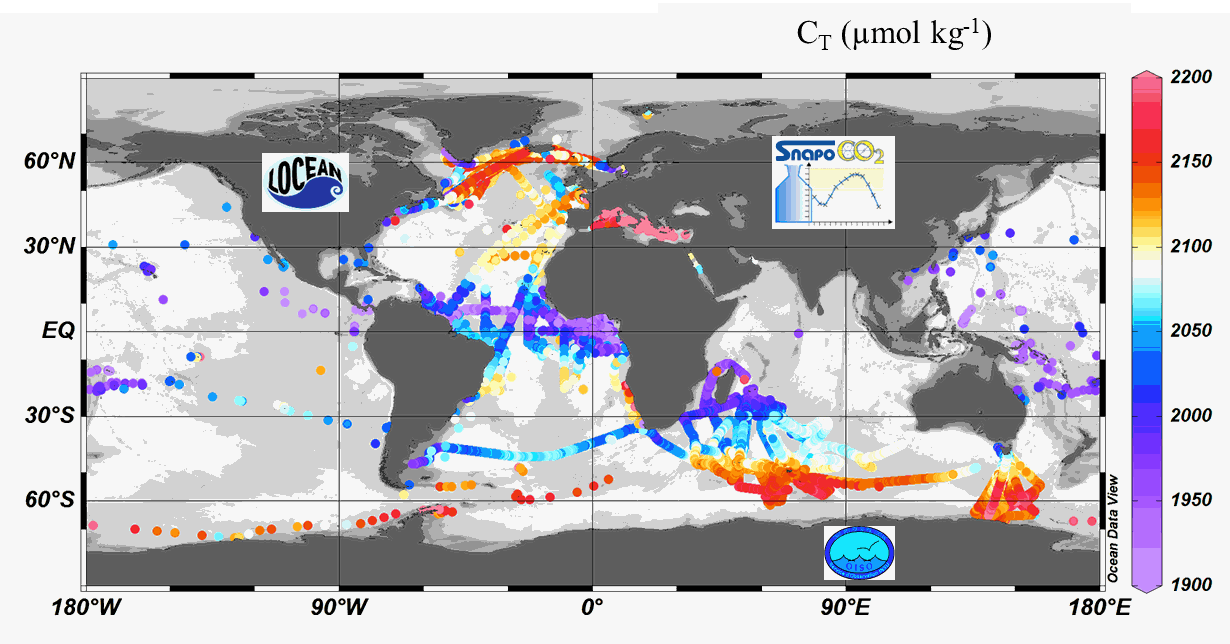
Since 2004, the Service facility SNAPO-CO2 (Service National d’Analyse des Paramètres Océaniques du CO2) housed by the LOCEAN laboratory (Paris, France) has been in charge for the analysis of Total Alkalinity (AT) and Total dissolved inorganic carbon (CT) of seawater samples on a series of cruises or ships of opportunity conducted in different regions in the frame of French and International projects. Following the first synthesis (Metzl et al, 2024, https://doi.org/10.17882/95414), 24700 new data have been quality controlled and the second version includes more than 67000 observations over 1993-2023. Sampling was performed either from CTD-Rosette casts (Niskin bottles) or collected from the ship’s seawater supply (intake at about 5m depth). After completion of each cruise, discrete samples were returned back at LOCEAN laboratory and stored in a dark room at 4 °C before analysis generally within 2-3 months after sampling (sometimes within a week). AT and CT were analyzed simultaneously by potentiometric titration using a closed cell (Edmond, 1970). Certified Reference Materials (CRMs) provided by Pr. A. Dickson (Scripps Institution of Oceanography, San Diego, USA) were used to calibrate the measurements. The same instrumentation was used for underway measurements during OISO cruises (https://campagnes.flotteoceanographique.fr/series/228/) and MINERVE cruises (https://doi.org/10.18142/128) and new AT-CT data for 2002-2021 in the Indian Ocean and Southern Ocean added in this synthesis. The second dataset is organized in one file with the format: Cruise name, Ship name, day, month, year, hour, minute, second, latitude, longitude, depth, AT (µmol/kg), Flag-AT, CT (µmol/kg), Flag-CT, Temperature (°C), Flag-Temp, Salinity (PSU), Flag-Salinity, nsample/cruise, sampling method, Version number, nsample on file.