 Catalogue PIGMA
Cross-discipline
Type of resources
Available actions
Topics
Keywords
Contact for the resource
Provided by
Years
Formats
-
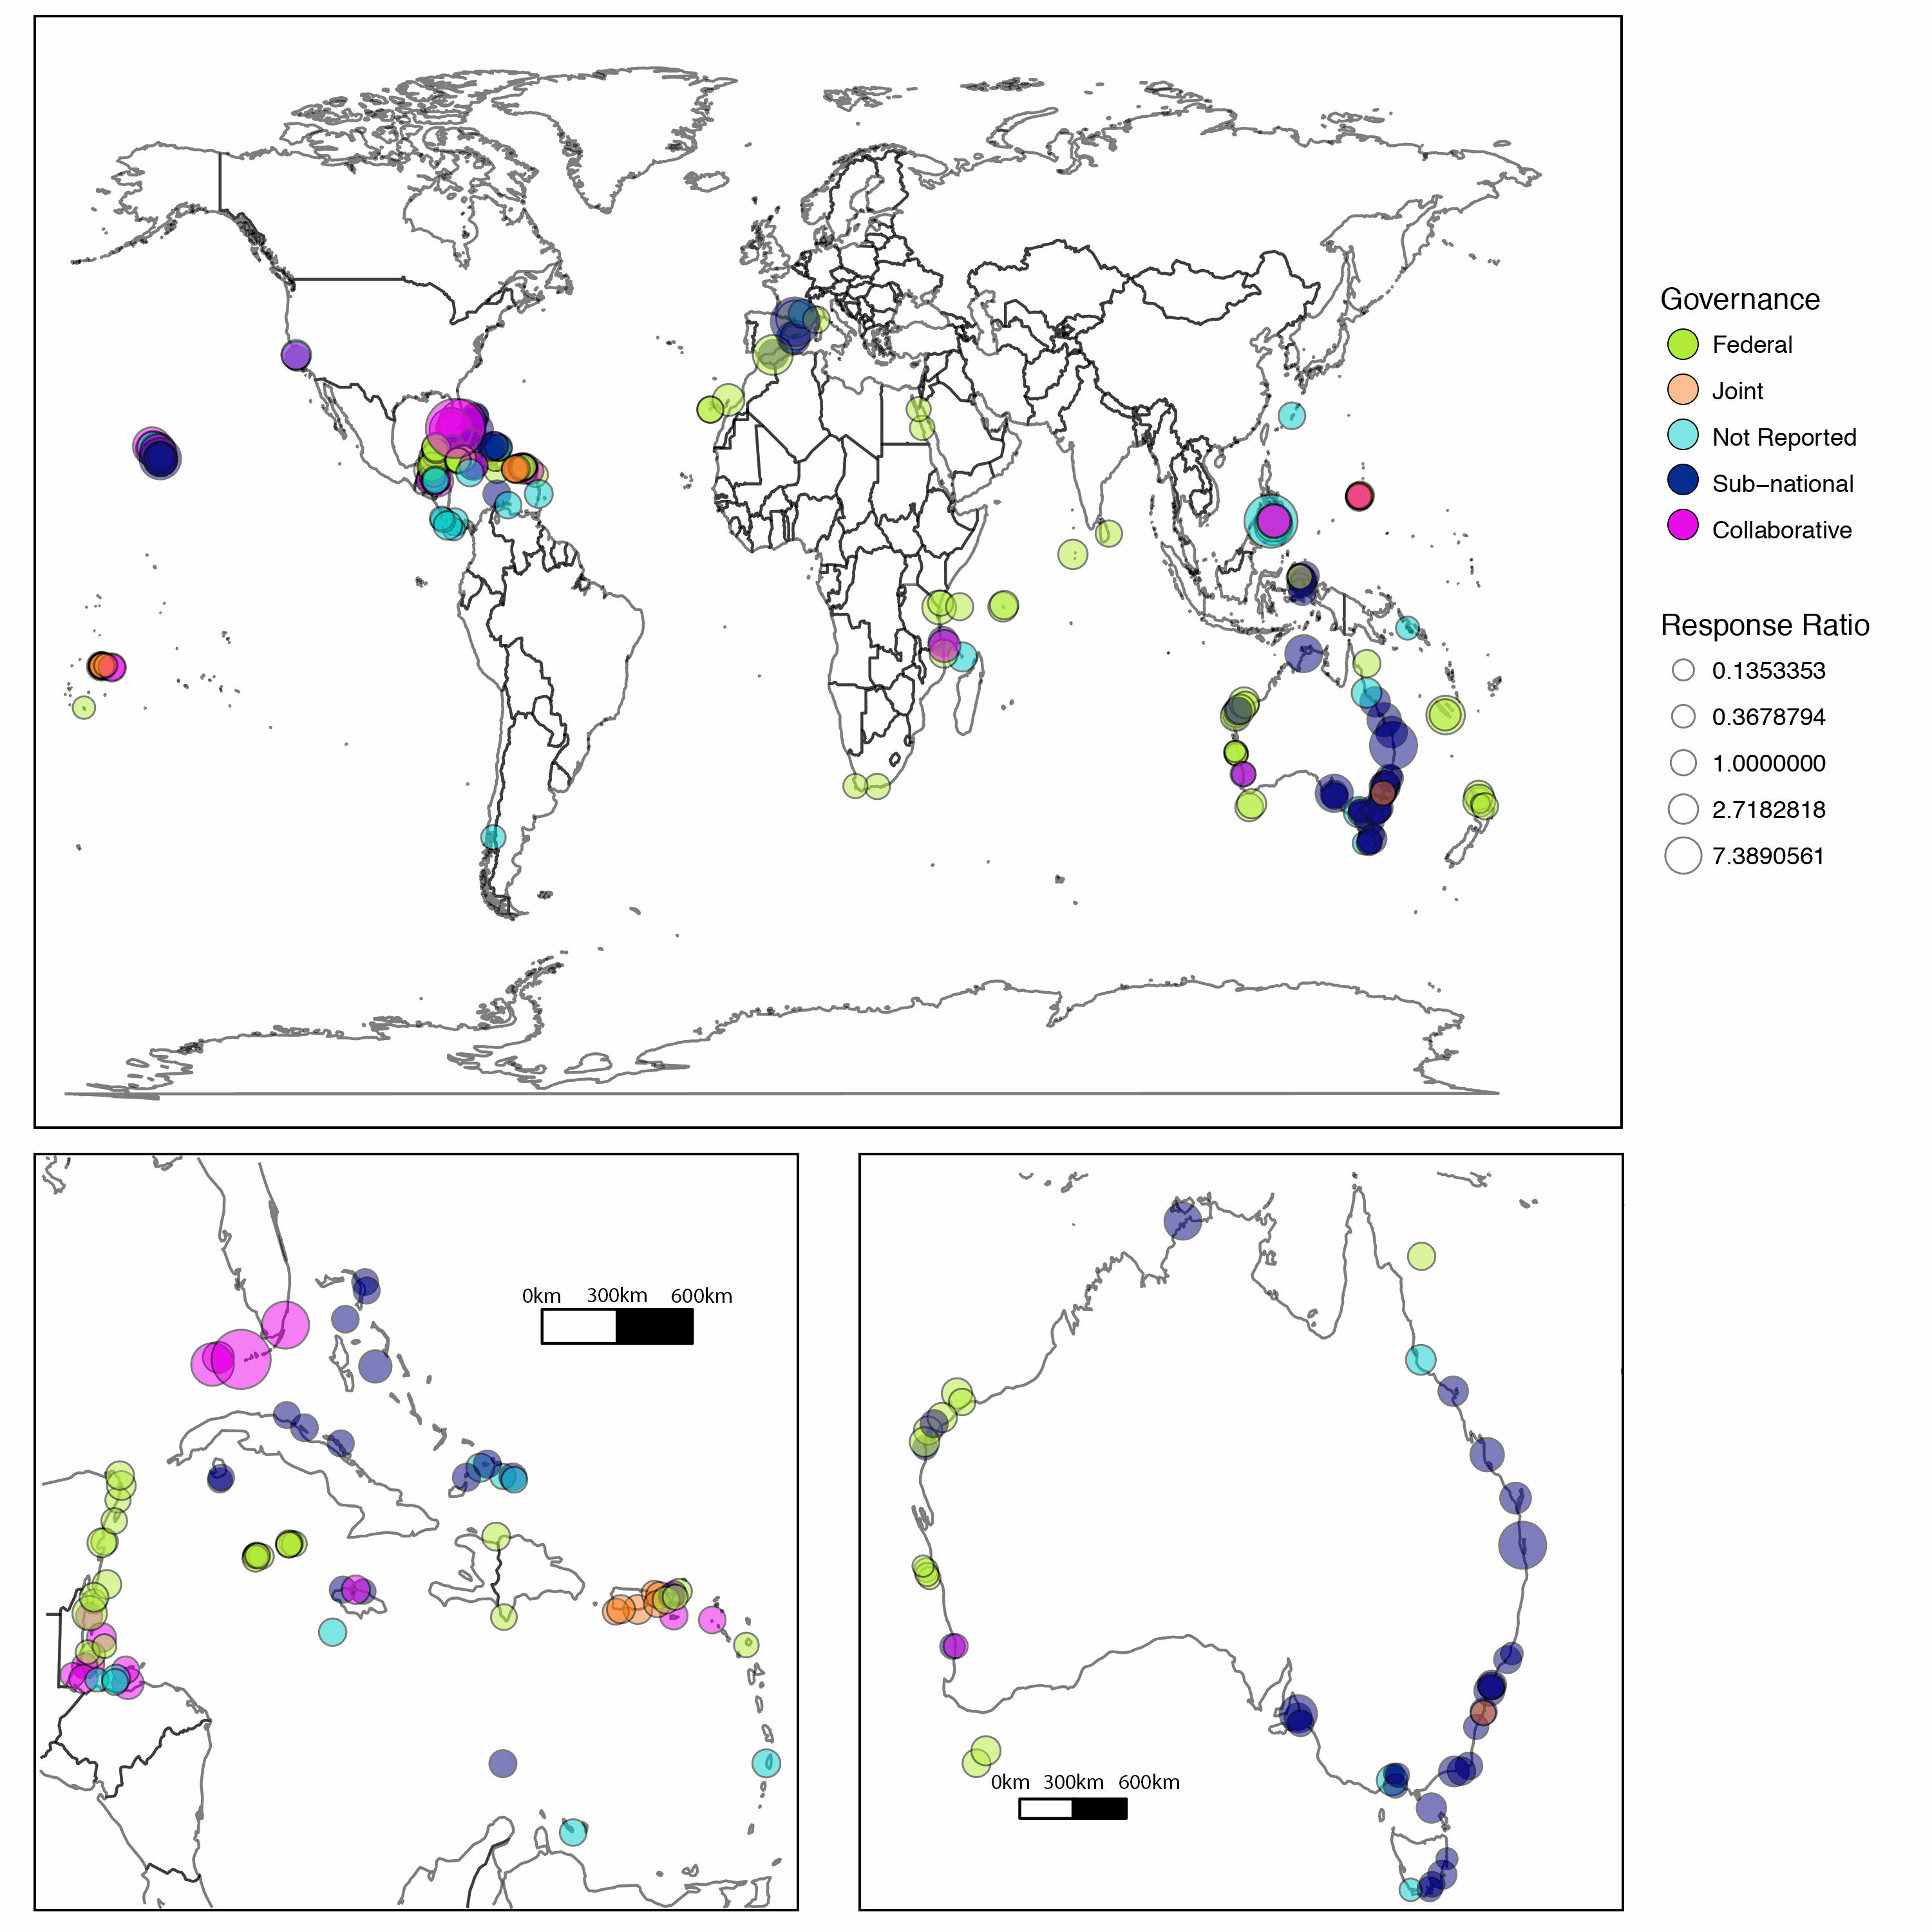
Marine protected areas (MPAs) provide biodiversity conservation benefits in a range of marine habitats. Many protected areas are established and governed through top-down or shared governance arrangements, yet little is known about how these governance strategies compare in terms of the protection benefits they provide to MPAs globally. Using an extensive data set of MPA conditions, we developed a set of Bayesian hierarchical models to understand the role of shared governance versus federal governance on reef fish biomass from 218 global MPAs. We find greater reef fish biomass benefits in MPAs with shared governance than with top-down, or federal arrangements. We also find greater benefits in older MPAs and MPAs farther away from shore. Our results highlight the fundamental importance of multi-stakeholder participation for improving conservation outcomes, representing an important conservation opportunity for new or existing MPAs.
-
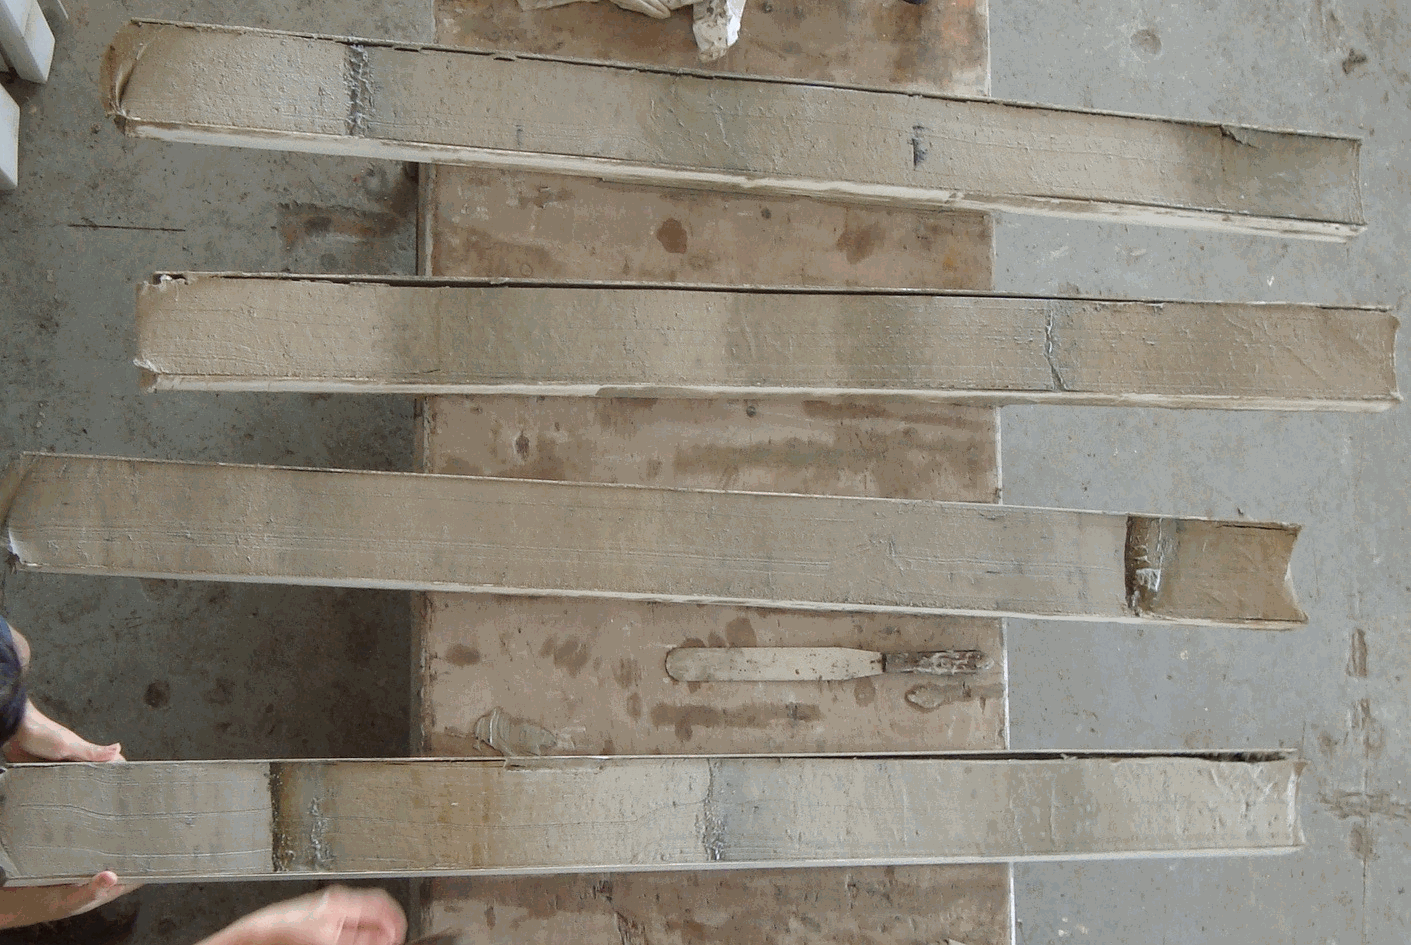
Rapid changes in ocean circulation and climate have been observed in marine-sediment and ice cores over the last glacial period and deglaciation, highlighting the non-linear character of the climate system and underlining the possibility of rapid climate shifts in response to anthropogenic greenhouse gas forcing. To date, these rapid changes in climate and ocean circulation are still not fully explained. One obstacle hindering progress in our understanding of the interactions between past ocean circulation and climate changes is the difficulty of accurately dating marine cores. Here, we present a set of 92 marine sediment cores from the Atlantic Ocean for which we have established age-depth models that are consistent with the Greenland GICC05 ice core chronology, and computed the associated dating uncertainties, using a new deposition modeling technique. This is the first set of consistently dated marine sediment cores enabling paleoclimate scientists to evaluate leads/lags between circulation and climate changes over vast regions of the Atlantic Ocean. Moreover, this data set is of direct use in paleoclimate modeling studies.
-
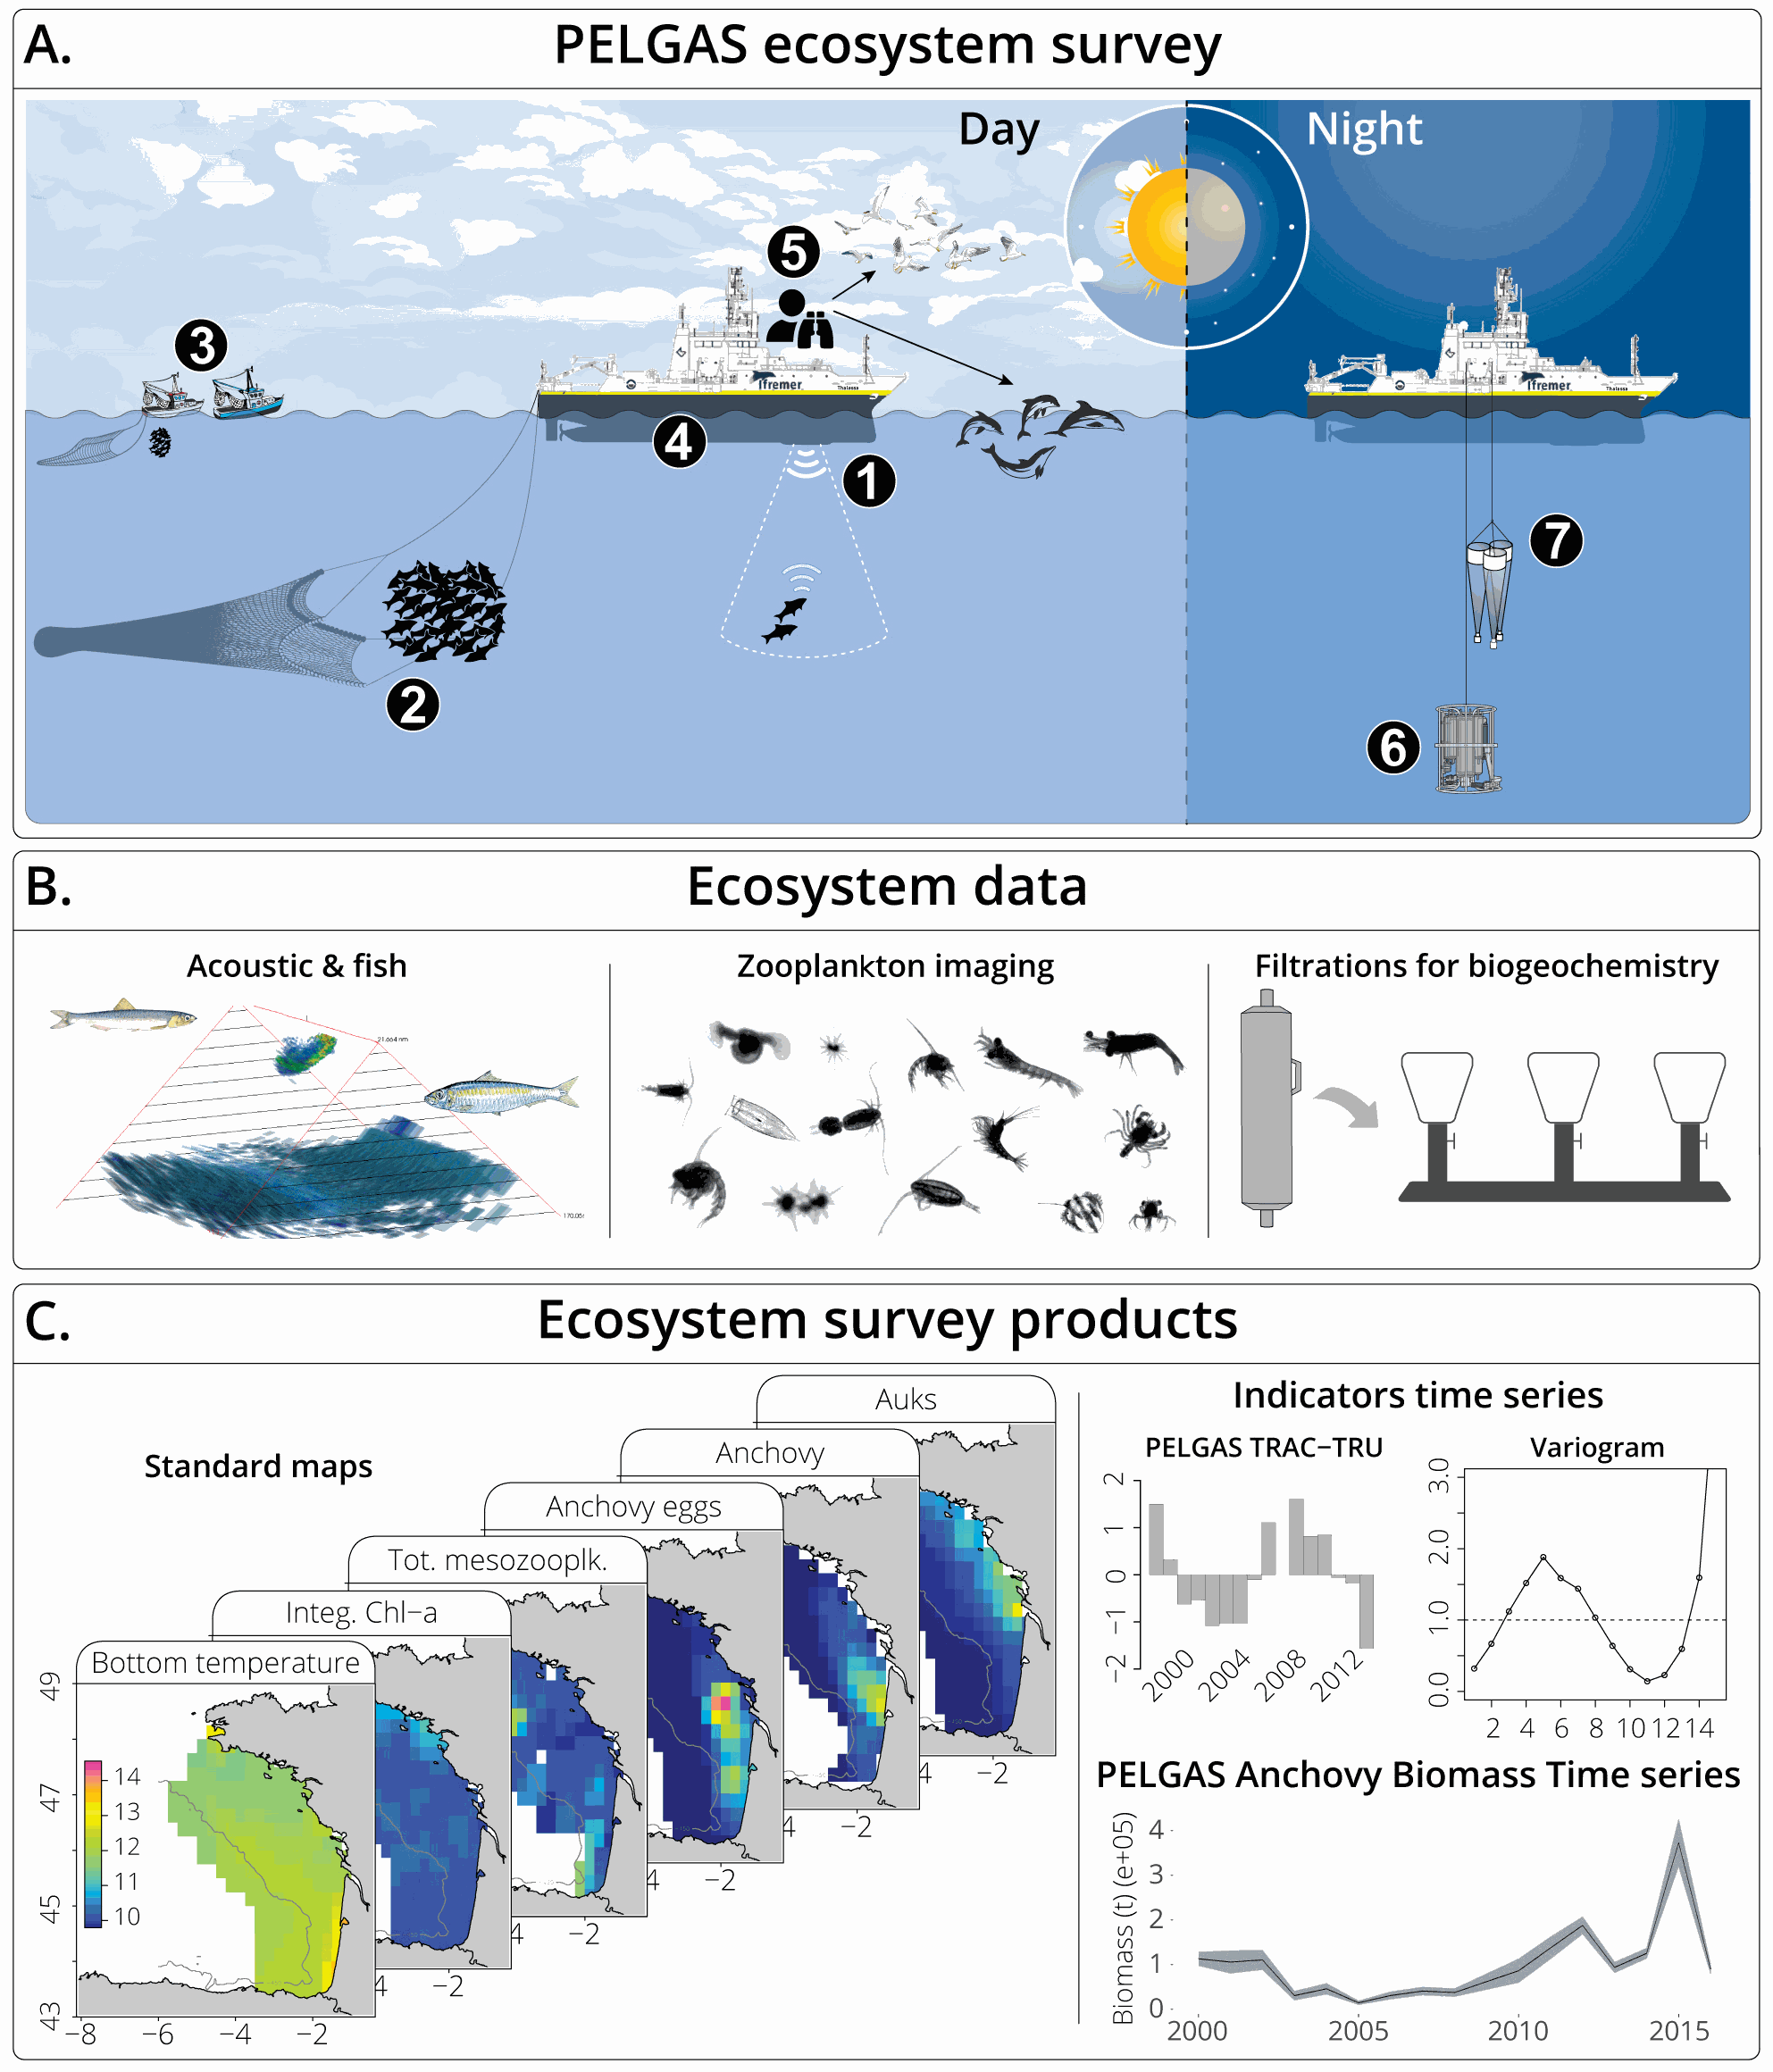
The Pélagiques Gascogne (PELGAS, Doray et al., 2000) integrated survey aims at assessing the biomass of small pelagic fish and monitoring and studying the dynamics and diversity of the Bay of Biscay pelagic ecosystem in springtime. PELGAS has been conducted within the EU Common Fisheries Policy Data Collection Framework and Ifremer’s Fisheries Information System. The PELGAS survey model has allowed for the establishment of a long-term time-series of spatially-explicit data of the Bay of Biscay pelagic ecosystem since the year 2000. Main sampled components of the targeted ecosystem are: hydrology, phytoplankton, mesozooplankton, fish and megafauna (cetacean and seabirds). This dataset presents gridded maps of standard pelagic ecosystem parameters collected in the main sampled components during the PELGAS survey. Ecosystem parameters were mapped on a 15km x 15km grid by applying a block averaging procedure (Petitgas et al., 2009, 2014). The dataset also includes the ecologically meaningful survey dates proposed by Huret et al. (2017), mapped on the same grid. Details on survey protocols and data processing methodologies can be found in Doray et al., (2014, 2017a). This dataset was used in Authier et al., 2017; Doray et al., 2017b, 2017c, 2017a; Huret et al., 2017; Petitgas et al., 2017.
-
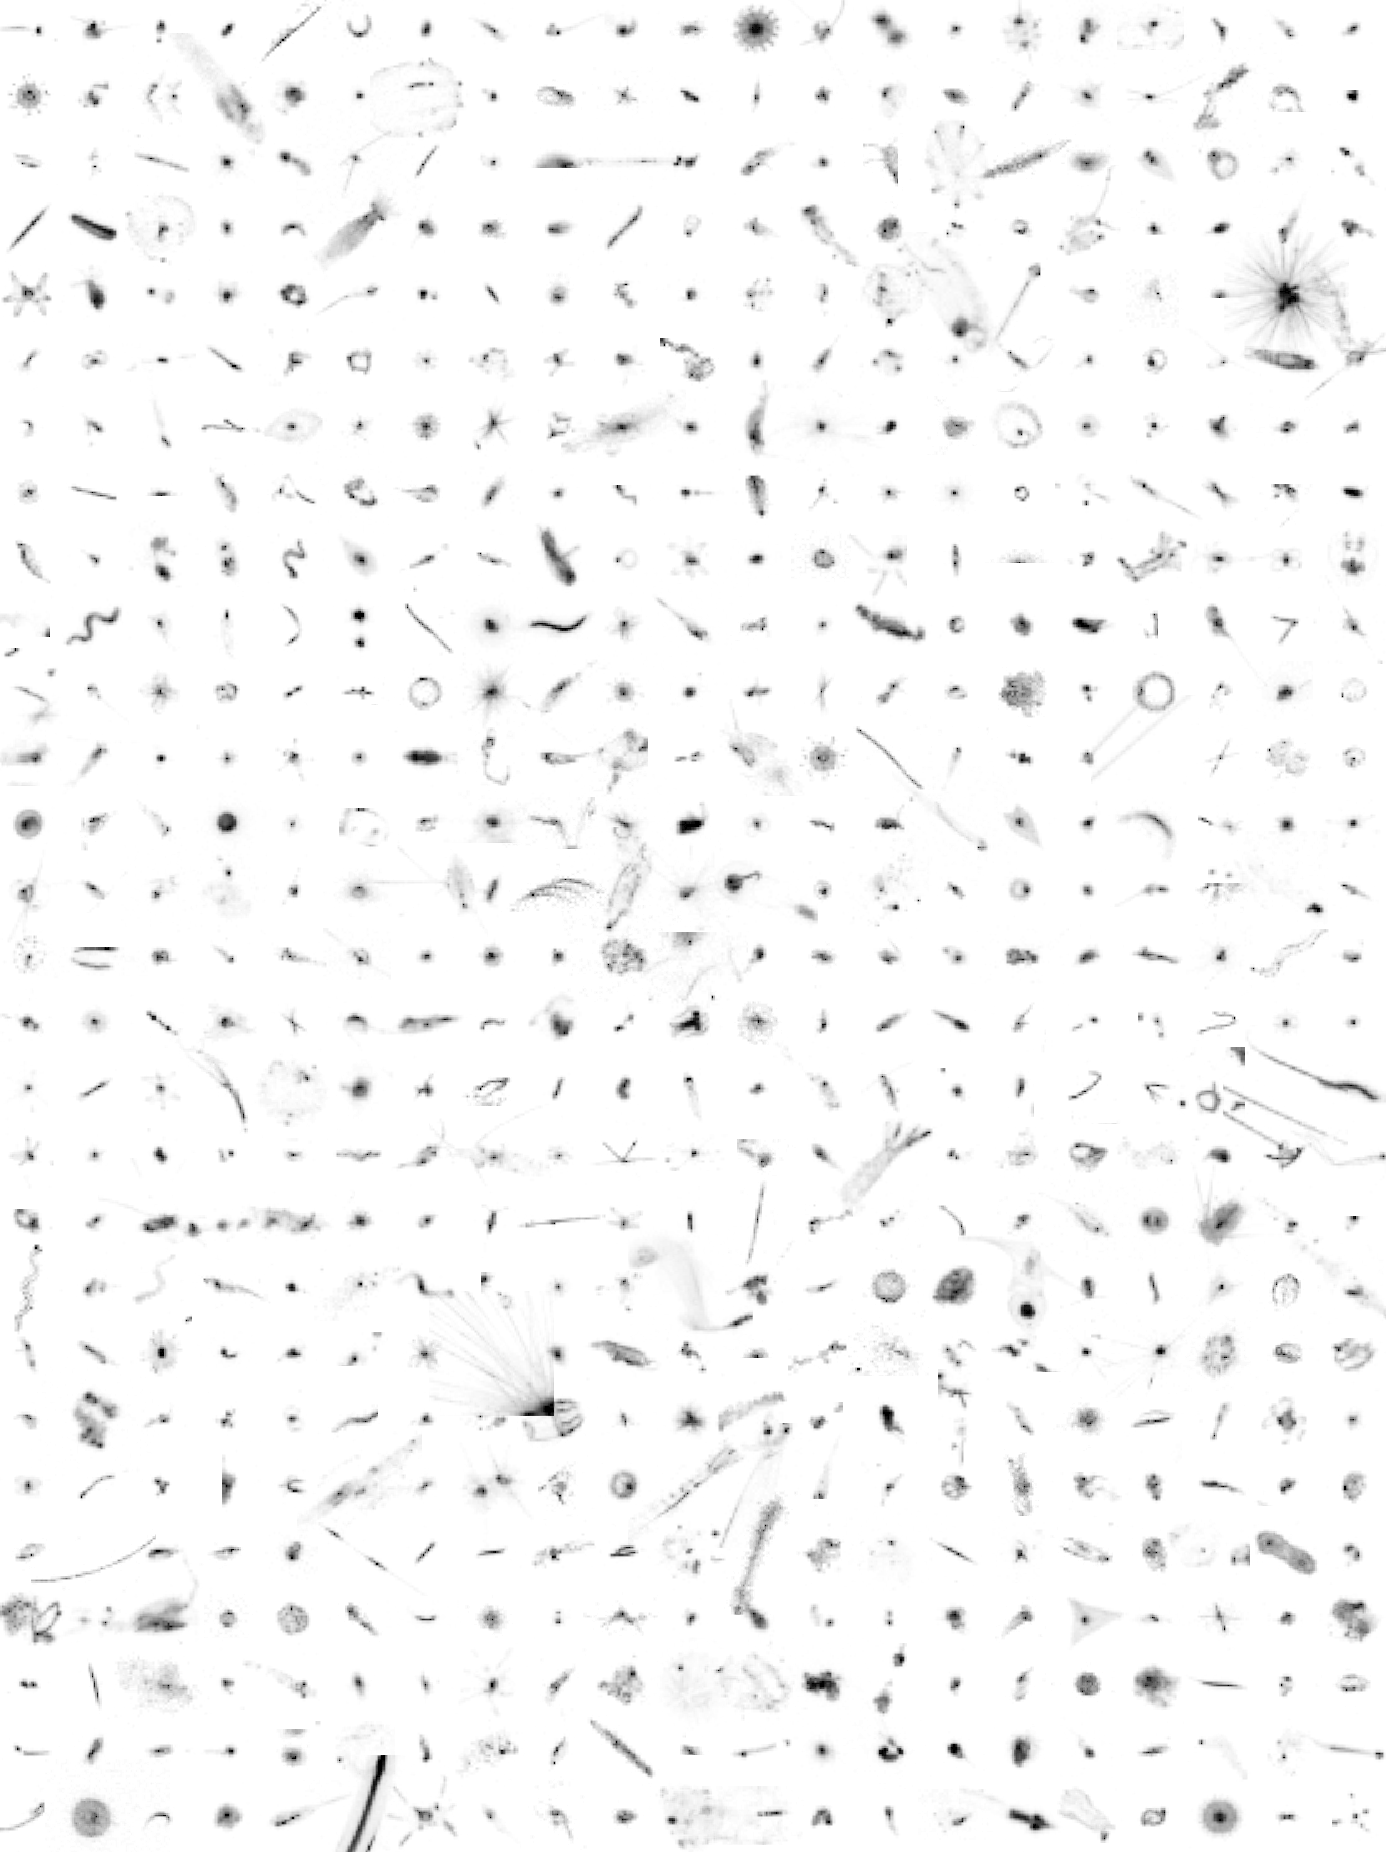
Here, we provide plankton image data that was sorted with the web applications EcoTaxa and MorphoCluster. The data set was used for image classification tasks as described in Schröder et. al (in preparation) and does not include any geospatial or temporal meta-data. Plankton was imaged using the Underwater Vision Profiler 5 (Picheral et al. 2010) in various regions of the world's oceans between 2012-10-24 and 2017-08-08. This data publication consists of an archive containing "training.csv" (list of 392k training images for classification, validated using EcoTaxa), "validation.csv" (list of 196k validation images for classification, validated using EcoTaxa), "unlabeld.csv" (list of 1M unlabeled images), "morphocluster.csv" (1.2M objects validated using MorphoCluster, a subset of "unlabeled.csv" and "validation.csv") and the image files themselves. The CSV files each contain the columns "object_id" (a unique ID), "image_fn" (the relative filename), and "label" (the assigned name). The training and validation sets were sorted into 65 classes using the web application EcoTaxa (http://ecotaxa.obs-vlfr.fr). This data shows a severe class imbalance; the 10% most populated classes contain more than 80% of the objects and the class sizes span four orders of magnitude. The validation set and a set of additional 1M unlabeled images were sorted during the first trial of MorphoCluster (https://github.com/morphocluster). The images in this data set were sampled during RV Meteor cruises M92, M93, M96, M97, M98, M105, M106, M107, M108, M116, M119, M121, M130, M131, M135, M136, M137 and M138, during RV Maria S Merian cruises MSM22, MSM23, MSM40 and MSM49, during the RV Polarstern cruise PS88b and during the FLUXES1 experiment with RV Sarmiento de Gamboa. The following people have contributed to the sorting of the image data on EcoTaxa: Rainer Kiko, Tristan Biard, Benjamin Blanc, Svenja Christiansen, Justine Courboules, Charlotte Eich, Jannik Faustmann, Christine Gawinski, Augustin Lafond, Aakash Panchal, Marc Picheral, Akanksha Singh and Helena Hauss In Schröder et al. (in preparation), the training set serves as a source for knowledge transfer in the training of the feature extractor. The classification using MorphoCluster was conducted by Rainer Kiko. Used labels are operational and not yet matched to respective EcoTaxa classes.
-
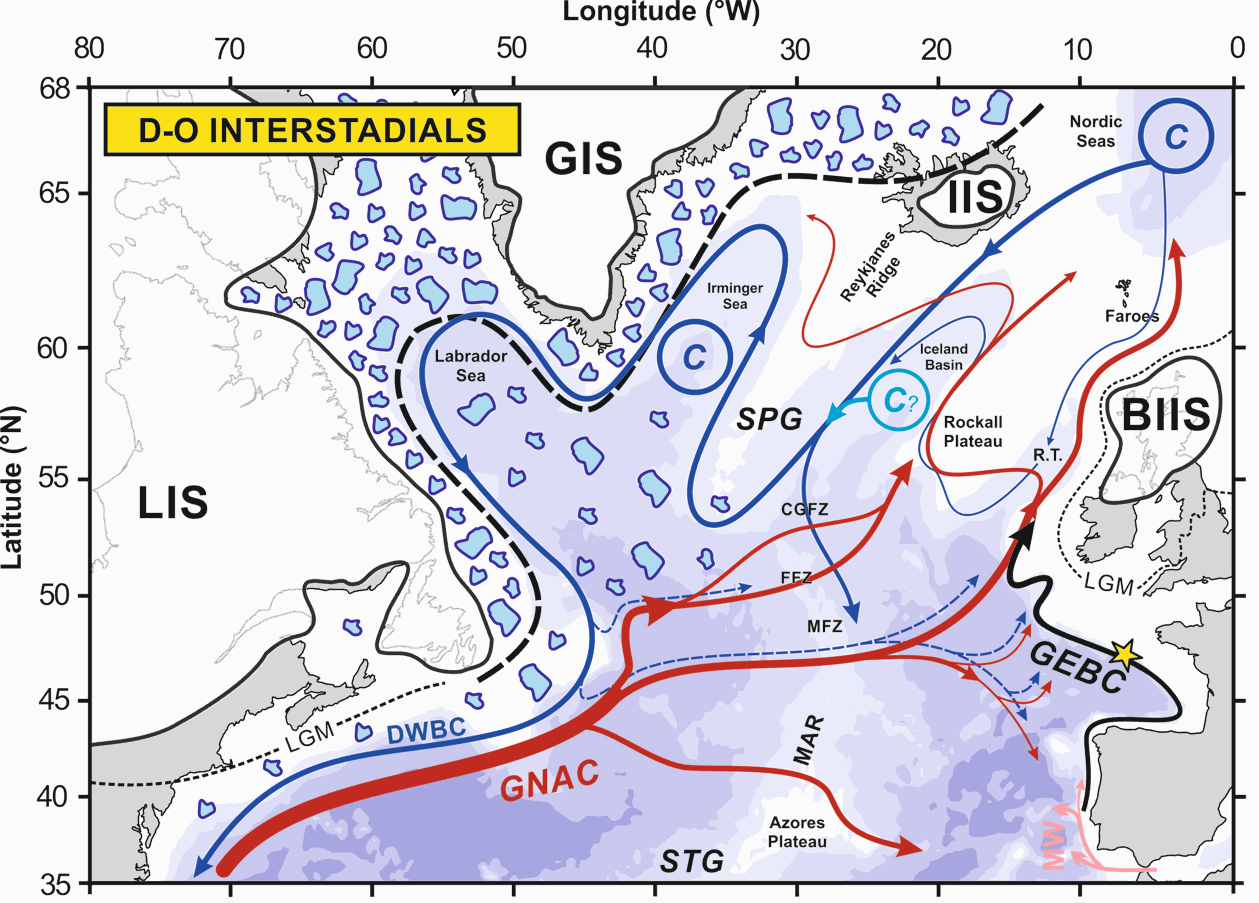
The upper branch of the Atlantic Meridional Overturning Circulation (AMOC) plays a critical role in ocean circulation and climate change, yet its variability during the last glacial period is poorly documented. Here, we investigate the northward-flowing Glacial Eastern Boundary Current (GEBC) in the North Atlantic, known today as the European Slope Current, and representing the easternmost portion of the upper branch of the AMOC. Based on flow speed (sortable silt, XRF) and radiogenic/stable isotopic records, we show that Dansgaard-Oeschger (D/O) interstadials (stadials) correspond to a faster (weaker) GEBC during the ~50-15 ka period. This, by analogy to present-day conditions, suggests enhanced (reduced) strength of the subpolar gyre and, by extension, of northern-sourced water production and AMOC during D-O interstadials (stadials). Concomitant fluctuations of both the European Ice Sheet and the GEBC between ~30 and 17 ka suggest an active role of the upper branch of AMOC in the poleward transport of heat and freshwater to the northern North Atlantic, with direct impacts on deep water formation and AMOC strength. Our GEBC reconstruction is the first physical (non-chemical) record documenting dynamic upper AMOC variability at high resolution in the eastern basin of the North Atlantic. Together with the deep North Atlantic records of northern-sourced water export, they confirm the central role of the AMOC in the generation of abrupt climate changes.
-
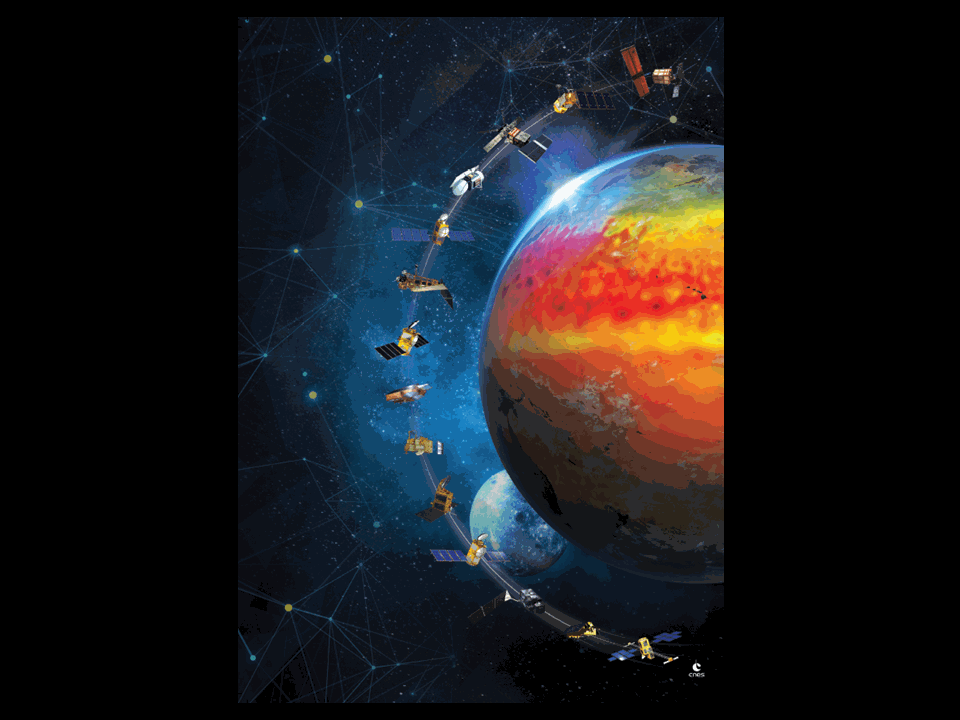
Global mean sea level is an integral of changes occurring in the climate system in response to unforced climate variability as well as natural and anthropogenic forcing factors. Its temporal evolution allows detecting changes (e.g., acceleration) in one or more components. Study of the sea level budget provides constraints on missing or poorly known contributions, such as the unsurveyed deep ocean or the still uncertain land water component. In the context of the World Climate Research Programme Grand Challenge entitled “Regional Sea Level and Coastal Impacts”, an international effort involving the sea level community worldwide has been recently initiated with the objective of assessing the various data sets used to estimate components of the sea level budget during the altimetry era (1993 to present). These data sets are based on the combination of a broad range of space-based and in situ observations, model estimates and algorithms. Evaluating their quality, quantifying uncertainties and identifying sources of discrepancies between component estimates is extremely useful for various applications in climate research. This effort involves several tens of scientists from about sixty research teams/institutions worldwide (www.wcrp-climate.org/grand-challenges/gc-sea-level). The results presented in this paper are a synthesis of the first assessment performed during 2017-2018. We present estimates of the altimetry-based global mean sea level (average rate of 3.1 +/- 0.3 mm/yr and acceleration of 0.1 mm/yr2 over 1993-present), as well as of the different components of the sea level budget. We further examine closure of the sea level budget, comparing the observed global mean sea level with the sum of components. Ocean thermal expansion, glaciers, Greenland and Antarctica contribute by 42%, 21%, 15% and 8% to the global mean sea level over the 1993-present. We also study the sea level budget over 2005-present, using GRACE-based ocean mass estimates instead of sum of individual mass components. Results show closure of the sea level budget within 0.3 mm/yr. Substantial uncertainty remains for the land water storage component, as shown in examining individual mass contributions to sea level.
-
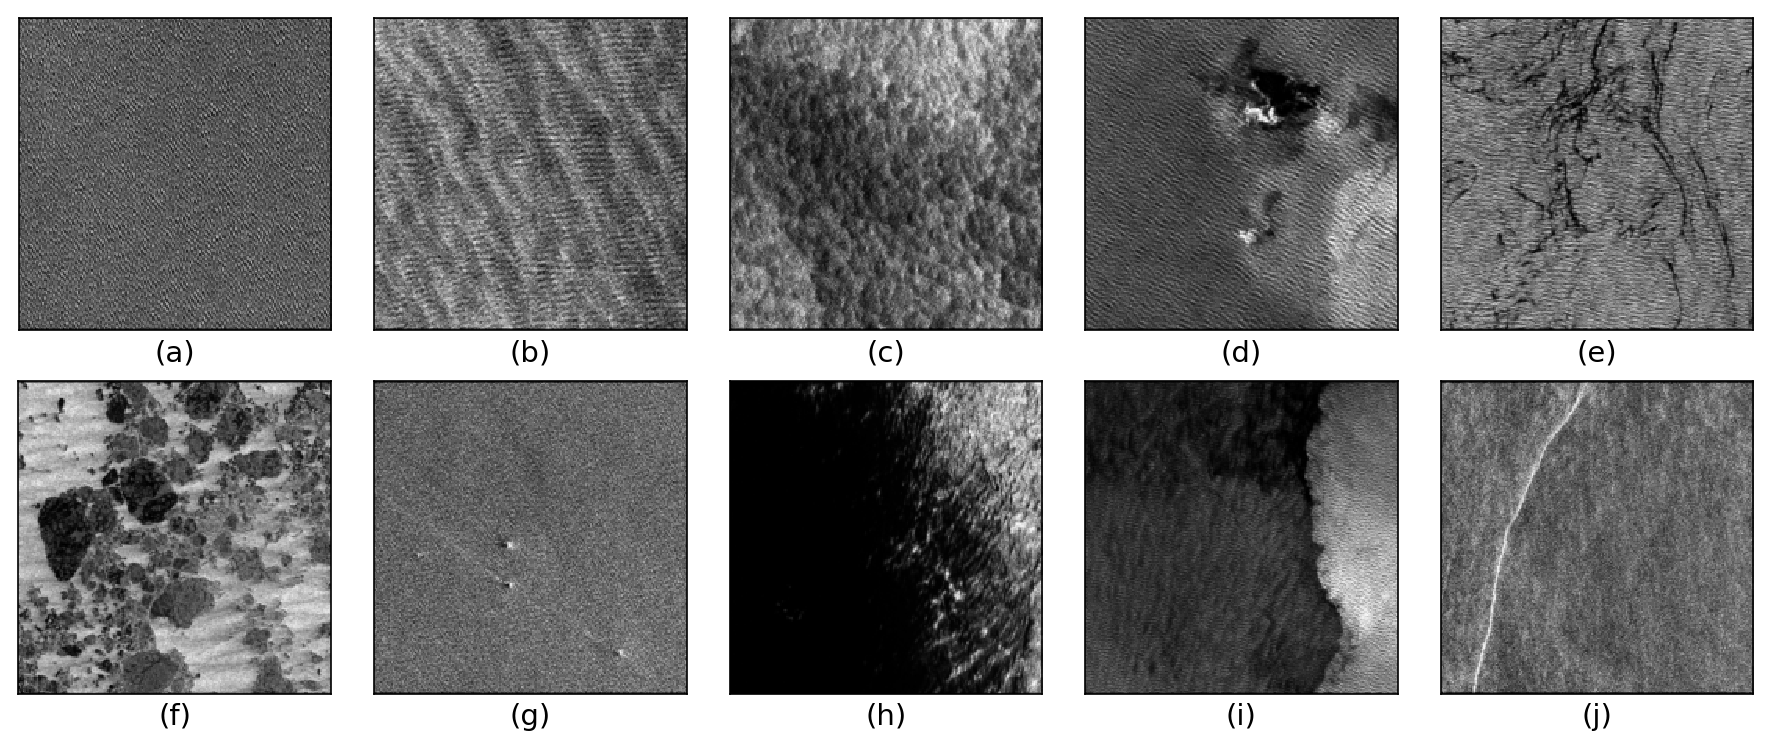
The TenGeoP-SARwv dataset is established based on the acquisitions of Sentinel-1A wave mode (WV) in VV polarization. This dataset consists of more than 37,000 SAR vignettes divided into ten defined geophysical categories, including both oceanic and meteorologic features. These images cover the entire open ocean and are manually selected from Sentinel-1A WV acquisitions in 2016. For each image, only one prevalent geophysical phenomena with its prescribed signature and texture is selected for labeling. The SAR images are processed into a quick-look image provided in the formats of PNG and GeoTIFF as well as the associated labels. They are convenient for both visual inspection and machine-learning-based methods exploitation. The proposed dataset is the first one involving different oceanic or atmospheric phenomena over the open ocean. It seeks to foster the development of strategies or approaches for massive ocean SAR image analysis. A key objective is to allow exploiting the full potential of Sentinel-1 WV SAR acquisitions, which are about 60,000 images per satellite per month and freely available. Such a dataset may be of value to a wide range of users and communities in deep learning, remote sensing, oceanography, and meteorology
-
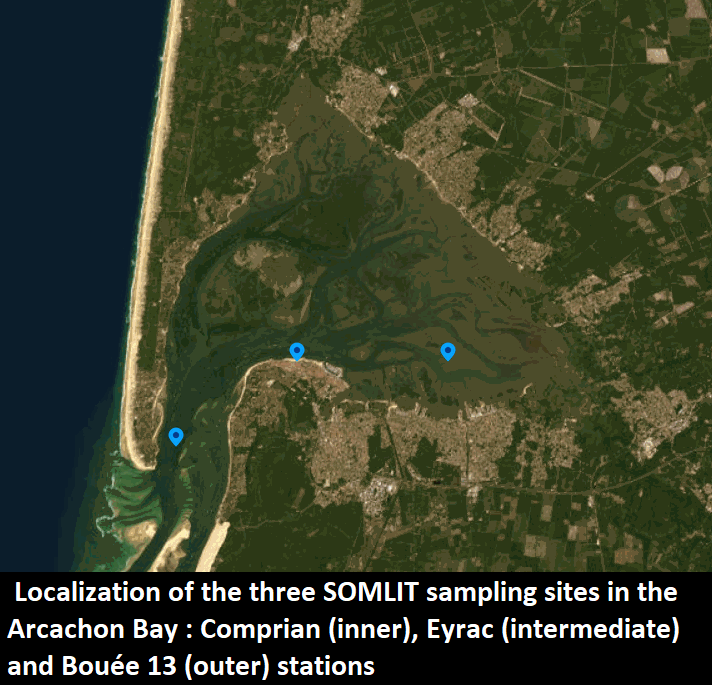
The Arcachon bay is a meso- / macro-tidal (0.8 to 4.6 m), semi-enclosed lagoon of 180 km² located on the South-western coast of France. Three main water masses are described in this bay: (i) the external neritic waters (ENW) directly influenced by the adjacent oceanic waters, (ii) the intermediate neritic waters (ItNW) and (iii) the inner neritic waters (InNW) more influenced by the continental inputs. The watershed of the Arcachon bay, mainly covered by forests, has an area of 3500 km² and the bay is considered as poorly anthropised. It hosts the largest Zostera noltei seagrass meadow in western Europe and is an important site for oyster farming and Manilla clam production. Since 1997, Arcachon Bay waters are monitored for hydrological and bio-geochemical parameters by the “Environnements et Paléoenvironnements Océaniques et Continentaux” (EPOC) Research Unit of the University of Bordeaux-CNRS, first in one single station (Eyrac), then on 2 complementary sites since 2005 (Bouee13 and Comprian). The monitoring is carried out within the national framework of the “SOMLIT” (“Service d’Observation en Milieu Littoral”) which is a French multi-site monitoring network initiated in the mid-1990s. SOMLIT is based on a joint strategy for 19 sites belonging to 12 ecosystems that are distributed over the three maritime facades of mainland France, i.e. the English Channel, the Atlantic Ocean and the Mediterranean Sea. Sampling of surface water samples is performed fortnightly at high tide for a group of 15 parameters (temperature, salinity, dissolved oxygen, pH, nitrate, nitrite, ammonium, phosphate, silicate, suspended matter, chlorophyll a, concentrations and isotopic ratios of particulate organic carbon and nitrogen) and 8 flow cytometry biological variables of pico- and nanoplankton. Vertical profiles of multiparametric probes concerning 4 parameters (temperature, salinity, fluorescence, PAR) are also performed. Given the significant diversity of coastal ecosystems where SOMLIT’s stations are located, strict and joint guidelines with regards to sampling strategy, measurement methods and data qualification and storage are paramount in order to make FAIR data available to users. The whole data acquisition strategy is carried out within the framework of the SOMLIT quality system formalized in 2006-2007 by referring to the ISO 17025: 2017 standard “General requirements for the competence of testing and calibration laboratories”. Unified sampling and analysis protocols are based on recognized disciplinary standards and on the expertise of the research teams. The scientific objectives of SOMLIT are 1) to characterize the multi-decadal evolution of coastal ecosystems; 2) to determine the climatic and anthropogenic forcings and 3) to make data and logistical support available for research activities and other observation activities. SOMLIT is therefore a research tool providing large datasets that also serve as logistical support for related research actions (from seasonal to long-term studies). Two additional national networks operate at the same SOMLIT sites: “COAST-HF” network performs high-frequency measurements (automated in situ measurements every 10 to 20 minutes) and “PHYTOBS-network” provides microphytoplankton biodiversity data. SOMLIT, COAST-HF and PHYTOBS are elementary networks of the Research Infrastructure “Infrastructure Littorale et Côtière” (ILICO) and are National Observation Services (SNO) of the Institut National des Sciences de l'Univers (INSU).
-
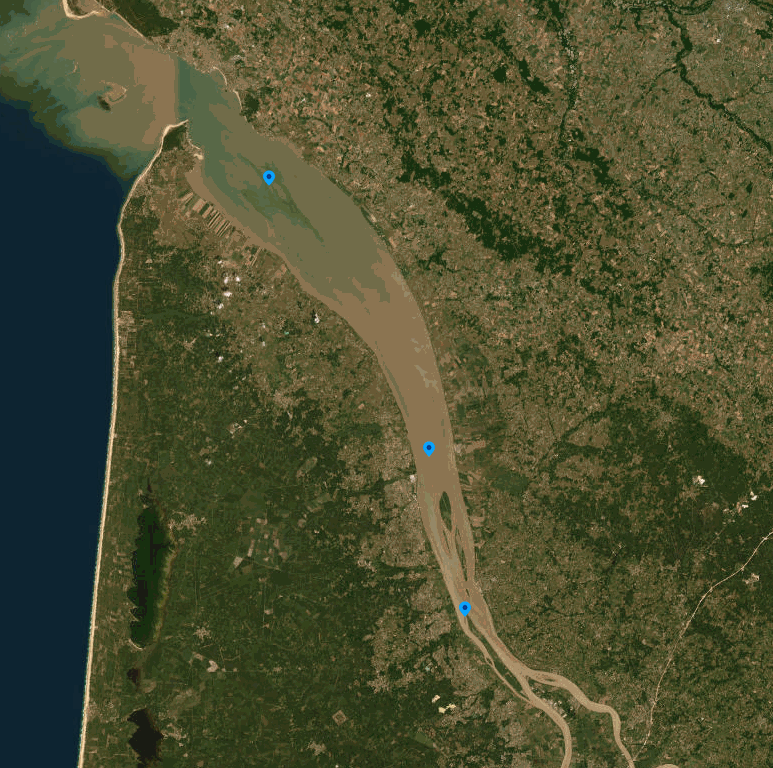
The SOMLIT-SOGIR time-series data characterize the hydrology of the Gironde Estuary ecosystem, located in the South-western France and flowing into the Bay of Biscay. Monthly-like measurements have been undertaken since 1997 by the OASU and EPOC teams (Univ. Bordeaux/CNRS). The SOMLIT-SOGIR time series is a part of the French monitoring network SOMLIT (https://www.somlit.fr/), labelled by the CNRS as a national Earth Science Observatory (Service National d’Observation : SNO). It aims to detect the long-term evolution of monitored ecosystems including both natural and anthropogenic forcings. Implemented at three sites (PK 30: 45.06833°N, 0.63833°W; PK 52: 45.24667°N, 0.725°W; PK 86: 45.5167°N, 0.95°W), the SOMLIT-SOGIR time series is among the oldest long-term coastal observation time series of the French Research Infrastructure dedicated to coastal ocean observations (RI ILICO, https://www.ir-ilico.fr). SOMLIT-SOGIR samples are collected at 1m below the water surface and 1m above the floor, at high and low tide, during slack water. Samples collected are analysed for 15 core parameters: water temperature and salinity, dissolved oxygen, pH, ammonia, nitrate, nitrite, phosphate, silicic acid, suspended particulate matter, particulate organic carbone, particulate nitrogen, chlorophyll a, delta15N and delta13C. CTD-PAR-profile is also performed at site PK86 during high tide. The SOMLIT network quality management system is in line with the ISO/IEC 17025:2017 standard: “General requirements for the competence of testing and calibration laboratories”. Further information on standard operating procedures for sample collection and data acquisition are available at: https://www.somlit.fr/parametres-et-protocoles. For more information on the quality flagging scheme: https://www.somlit.fr/codes-qualite/.
-

The SOMLIT-Antioche observation station, located at 5 nautical miles from Chef de Baie harbor (La Rochelle) is part of the French monitoring network SOMLIT (https://www.somlit.fr/), accredited by the INSU-CNRS as a national Earth Science Observatory (Service National d’Observation : SNO), which comprises 12 observation stations distributed throughout France in coastal locations. It aims to detect long-term changes of these ecosystems under both natural and anthropogenic forcings. SOMLIT is part of the national research infrastructure for coastal ocean observation ILICO (https://www.ir-ilico.fr/?PagePrincipale&lang=en). The SOMLIT-Antioche station (46.0842 °N, 1.30833 °W) is located in the north-eastern part of the Bay of Biscay, halfway between the islands of Ré and Oléron, at the centre of what is commonly known as the Pertuis Charentais area, which correspond to a semi-enclosed shallow basin and includes four islands (Ré, Oléron, Aix and Madame) and three Pertuis (i.e., detroit) (Breton, Antioche and Maumusson). This 40m-deep site, with muddy to sandy marine bottoms, is submitted to a macro-tidal regime and is largely open to the prevailing westerly swells. It remains under a dominant oceanic/neritic influence, even though its winter/spring hydrological context is influenced by the diluted plumes of the Charente, Gironde and Loire rivers, but not by those of too small estuaries (Lay, Seudre and Sèvre Niortaise). SOMLIT-Antioche hydrological monitoring has been carried out by the LIENSs/OASU laboratory on a fortnightly basis since June 2011. Surface water samples are collected at high-tide during intermediate tides (70 ± 10 in SHOM units) on board the research vessel ‘L’Estran’ owned by La Rochelle University. Samples are analyzed for more than 16 core parameters: temperature, salinity, dissolved oxygen, pH, ammonia, nitrates, nitrites, phosphates, silicates, suspended matter, particulate organic carbone, particulate organic nitrogen, chlorophyll, delta15N, delta13C; pico- and nano- plankton. Measurements are carried out in accordance with the ISO/IEC 17025:2017 standard. Simultaneous monitoring of the micro-phytoplankton community (since 2013, SNO PHYTOBS: https://www.phytobs.fr/en) and monitoring of prokaryotic communities (Bacteria and Archaea) are also carried out on a monthly basis. Since 2019, seasonal observations of benthic invertebrate communities (SNO BenthObs : https://www.benthobs.fr/) have also been carried out. This monitoring is complementary to that carried out at hydrological stations in the pre-existing REPHY and DCE networks, some of which are located near marine farming areas (oyster and mussel farms).