 Catalogue PIGMA
2026
Type of resources
Available actions
Topics
Keywords
Contact for the resource
Provided by
Years
Formats
Representation types
Update frequencies
status
Service types
Scale
Resolution
-
The European Union’s Copernicus-funded TRUSTED project (Towards Fiducial Reference Measurements of Sea-Surface Temperature by European Drifters) has deployed over 100 state of the art drifting buoys for improved validation of Sea Surface Temperature (SST) from the Sentinel-3 Sea and Land Surface Temperature Radiometers (SLSTR). These buoys are manufactured by NKE. The TRUSTED drifting buoys data and metadata are distributed in qualtity control NetCDF files, as a subset of DBCP drifting buoys GDAC (Global Data Assembly Centre). Coriolis DAC (Data Assembly Centre) routinely collects, decodes, quality controls, preserves and distributes data and metadata as NetCDF-CF files. The TRUSTED buoys have specific features managed by Coriolis DAC python data processing chain: a high resolution temperature sensor in addition to the classic drifting buoy temperature sensor. The high sampling and high resolution observations are distributed in specific variables TEMP_HR, TEMP_HR_SPOT, TEMP_HR_XX (XX is the percentile sample).
-
Long-term time series of coliform bacteria concentration (fecal coliform or Escherichia coli) in shellfish in four submarine areas (North Sea/Channel, Britany, Atlantic, Mediterranean).
-
-
Numerous reef-forming species have declined dramatically over the last century. Many of these declines have been insufficiently documented due to anecdotal or hard-to-access information. The Ross worm Sabellaria spinulosa (L.) is a tube-building polychaete that can form large mostly subtidal reefs, providing important ecosystem services such as coastal protection and habitat provision. It ranges from Scotland to Morocco and into the Mediterranean as far as the Adriatic, yet little is known about its distribution outside of the North & Wadden Seas, where it is protected under the OSPAR & HELCOM regional sea conventions respectively. As a result, online marine biodiversity information systems currently contain haphazardly distributed records of S. spinulosa. One of the objectives of the REEHAB project (http://www.honeycombworms.org) was to combine historical records with contemporary data to document changes in the distribution and abundance of the two Sabellaria species found in Europe, S. alveolata and S. spinulosa. Here we publish the result of the curation of 555 S. spinulosa sources, gathered from literature, targeted surveys, local conservation reports, museum specimens, personal communications by authors their research teams, national biodiversity information systems (i.e. the UK National Biodiversity Network (NBN), www.nbn.org.uk) and validated citizen science observations (i.e. https://www.inaturalist.org). 56% of these records were not previously referenced in any online information system. Additionally, historic samples from Gustave Gilson were scanned for S. spinulosa information and manually entered. The original taxonomic identification of the 40,261 S. spinulosa records has been kept. Some identification errors may however be present, particularly in the English Channel and Mediterranean where intertidal and shallow subtidal records can be mistaken for Sabellaria alveolata. A further 229 observations (16 sources) are recorded as ‘Sabellaria spp.’ as the available information did not provide an identification down to species level. Many sources reported abundances based on the semi-quantitative SACFOR scale whilst others simply noted its presence, and others still verified both its absence and presence. The result is a curated and comprehensive dataset spanning over two centuries on the past and present global distribution and abundance of S. spinulosa. Sabellaria spinulosa records projected onto a 50km grid. When SACFOR scale abundance scores were given to occurrence records, the highest abundance value per grid cell was retained.
-

Within the ESA Coastal Blue Carbon project, the LIENSs laboratory contributed drone-derived products, SP80 ground survey points (with longitude, latitude, and plant data) and biomass measurements to test classification models for mapping salt marsh vegetation (e.g., Esnandes) and associated biomass/carbon stocks. Links to associated datasets are provided at the bottom of this sheet.
-
EMODnet (Chemical data) Map Server with ocean climatologies.
-
The DBCP – Data Buoy Cooperation Panel - is an international program coordinating the use of autonomous data buoys to observe atmospheric and oceanographic conditions, over ocean areas where few other measurements are taken. DBCP coordinates the global array of 1 600 active drifting buoys (August 2020) and historical observation from 14 000 drifting buoys. Data and metadata collected by drifting buoys are publically available in near real-time via the Global Data Assembly Centers (GDACs) in Coriolis-Ifremer (France) and MEDS (Canada) after an automated quality control (QC). In long term, scientifically quality controlled delayed mode data will be distributed on the GDACs. Disclaimer: the DB-GDAC is under construction. It is currently (January 2020) aggregating data from the Coriolis DAC (E-Surfmar, Canada). Additional DACs are considered. An interim provision from GTS real-time data to GDAC may be provided from Coriolis DAC.
-
This dataset comprises two netcdf files. The first file contains the six global two-dimensional maps necessary to implement the tidal mixing parameterization presented in de Lavergne et al. (2020). Four power fields (E_wwi, E_sho, E_cri and E_hil) represent depth-integrated internal tide energy dissipation, with units of Watts per square meter. Each power field corresponds to a specific dissipative process and associated vertical structure of turbulence production. The two remaining fields, H_cri and H_bot, are decay heights (with units of meters) that enter the vertical structures of the E_cri and E_hil components, respectively. The second file contains three-dimensional fields of turbulence production (with units of Watts per kilogram) obtained by application of the parameterization to the WOCE global hydrographic climatology. The file includes the total turbulence production (epsilon_tid), its four components (epsilon_wwi, epsilon_sho, epsilon_cri, epsilon_hil), and the underlying hydrographic fields, as a function of longitude, latitude and depth. All maps have a horizontal resolution of 0.5º. Detailed documentation of the parameterization can be found in the following publication: de Lavergne, C., Vic, C., Madec, G., Roquet, F., Waterhouse, A.F., Whalen, C.B., Cuypers, Y., Bouruet-Aubertot, P., Ferron, B., Hibiya, T. A parameterization of local and remote tidal mixing. Journal of Advances in Modeling Earth Systems, 12, e2020MS002065 (2020). https://doi.org/10.1029/2020MS002065
-

The PHYTOBS-Network dataset includes long-term time series on marine microphytoplankton, since 1987, along the whole French metropolitan coast. Microphytoplankton data cover microscopic taxonomic identifications and counts. The whole dataset is available, it includes 25 sampling locations. PHYTOBS-Network studies microphytoplankton diversity in the hydrological context along French coasts under gradients of anthropogenic pressures. PHYTOBS-Network allows to analyse the responses of phytoplankton communities to environmental changes, to assess the quality of the coastal environment through indicators, to define ecological niches, to detect variations in bloom phenology, and to support any scientific question by providing data. The PHYTOBS-Network provides the scientific community and stakeholders with validated and qualified data, in order to improve knowledge regarding biomass, abundance and composition of marine microphytoplankton in coastal and lagoon waters in their hydrological context. PHYTOBS-Network originates of two networks. The historical REPHY (French Observation and Monitoring program for Phytoplankton and Hydrology in coastal waters) supported by Ifremer since 1984 and the SOMLIT (Service d'observation en milieu littoral) supported by INSU-CNRS since 1995. The monitoring has started in 1987 on some sites and later in others. Hydrological data are provided by REPHY or SOMLIT network as a function of site locations.
-
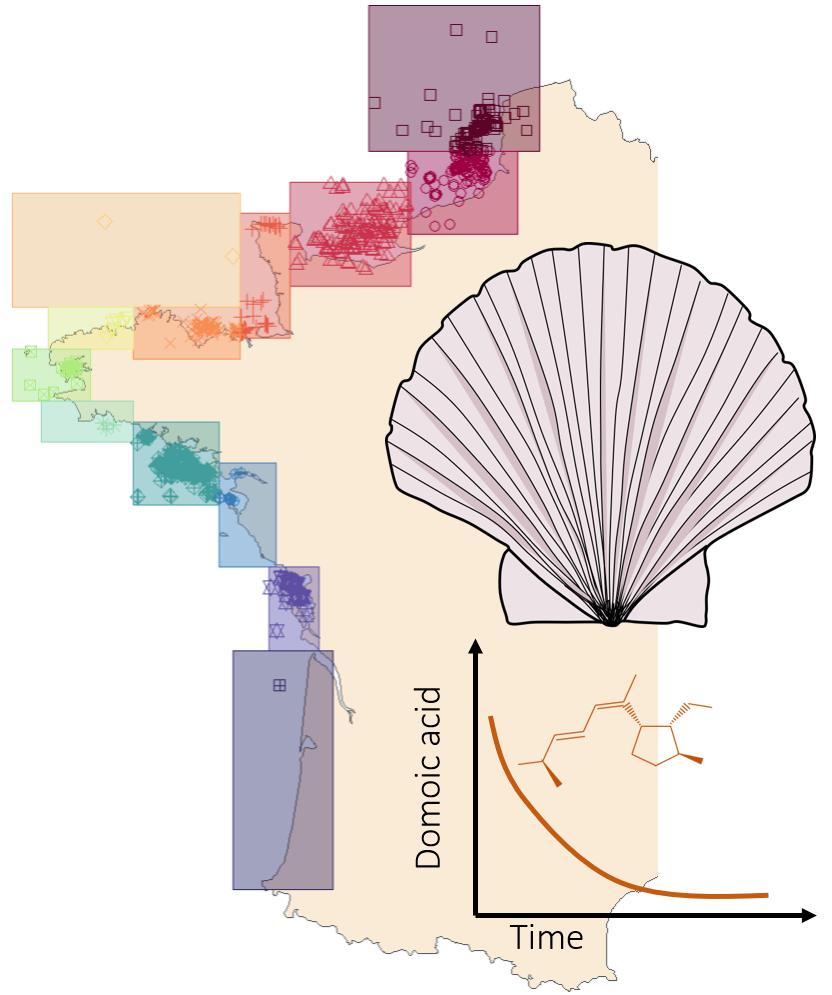
In the context of contamination of shellfish species by domoic acid produced by microalgal species of the genus Pseudo-nitzschia, we studied the particular case of depuration kinetics of king scallops, Pecten maximus. The study was based on the REPHYTOX dataset (https://doi.org/10.17882/47251) which includes, among others, long-term time series of domoic acid in shellfish species. We selected only the locations along the English Channel and the Atlantic coastline. Contamination events were defined for each locations, depuration rates were estimated fitting an exponential decay model using a non-linear least squares regression. Spatio-temporal variability was assessed as well as correlations to environmental conditions, using REPHY dataset (https://doi.org/10.17882/47248). Finally, scenarios for predictions of either the dynamics of depuration or the domoic acid contamination at a precise date were performed. Four files are available as data used for the study and results : (i) subset of REPHYTOX dataset, (ii) subset of REPHY dataset, used in this study and (iii) contamination event information (i.e., initial and end date of the event, initial domoic acid concentration) and depuration rate estimations, and (iv) predictions of depuration dynamics with different scenarios. Information on each file is detailed in the end user manual and methodology and results are linked to an article in preparation.