 Catalogue PIGMA
CDS-OMP
Type of resources
Available actions
Topics
Keywords
Contact for the resource
Provided by
Formats
Update frequencies
status
-
Ocean tide and loading altimetric corrections computed - with SIROCCO Tools : https://sirocco.obs-mip.fr/other-tools/prepost-processing/comodo-tools - from FES2014 atlases : https://doi.org/10.6096/3001 - for all altimetric missions. Validation available at ftp://ftp.legos.obs-mip.fr/pub/ecola/FES2014/CTOH/2021-02-diff-libfes-tools.pdf
-
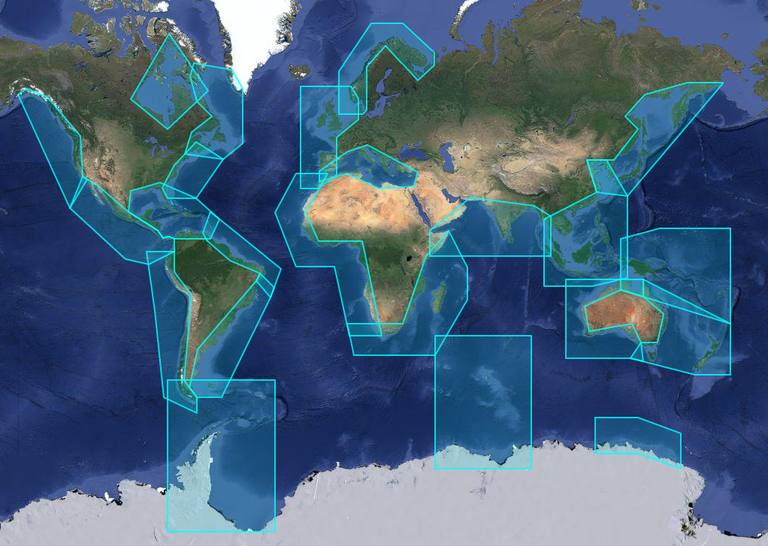
X-TRACK, is a regional altimeter products for coastal applications. It has been developed in order to optimize the completeness and the accuracy of the sea surface height information derived from satellite altimetry in coastal ocean areas. 1hz alongtrack SLA are available in 23 regions for different altimetric missions (Topex, Jason-1&2, Geosat, Ers2, Envisat). SLA is computed on a reference track. X-TRACK SLA files hold alongtrack SLA data together with MSSH, FES2012 tide, Dynamic Atmospheric Corrections and distance to coast parameters. Users can both retrieve filtered and non-filtered data. X-TRACK areas : | short name | long name | |:------------|:---------------------------------| | adelie | Adelie-Mertz | | amazon | Amazon | | asa | Atlantic South America | | chinasea | China Sea | | drake | Drake passage | | eaustralia | East Australia | | gom | Gulf of Mexico - Caribbean Sea | | gulfstream | Gulf Stream | | hudson | Hudson Bay | | humboldt | Humboldt current | | kerguelen | Kerguelen Islands | | labrador | Labrador Sea | | medsea | Mediterranean Sea | | nea | North East Atlantic | | nindian | North Indian Ocean | | norway | Norway | | nwa | North West America | | nwp | North West Pacific | | sea | South and East Africa | | wafrica | West Africa | | waustralia | West Australia | | wla | West Latin America - California | | wtp | West Tropical Pacific |
-
X-TRACK, is a regional altimeter products for coastal applications. It has been developed in order to optimize the completeness and the accuracy of the sea surface height information derived from satellite altimetry in coastal ocean areas. 1hz alongtrack SLA are available in 23 regions for different altimetric missions (Topex, Jason-1&2, Geosat, Ers2, Envisat). SLA is computed on a reference track. X-TRACK SLA files hold alongtrack SLA data together with MSSH, FES2012 tide, Dynamic Atmospheric Corrections and distance to coast parameters. Users can both retrieve filtered and non-filtered data. X-TRACK areas : | short name | long name | | :----------------- | :---------------------------------- | | adelie | Adelie-Mertz | | amazon | Amazon | | asa | Atlantic South America | | chinasea | China Sea | | drake | Drake passage | | eaustralia | East Australia | | gom | Gulf of Mexico - Caribbean Sea | | gulfstream | Gulf Stream | | hudson | Hudson Bay | | humboldt | Humboldt current | | kerguelen | Kerguelen Islands | | labrador | Labrador Sea | | medsea | Mediterranean Sea | | nea | North East Atlantic | | nindian | North Indian Ocean | | norway | Norway | | nwa | North West America | | nwp | North West Pacific | | sea | South and East Africa | | wafrica | West Africa | | waustralia | West Australia | | wla | West Latin America - California | | wtp | West Tropical Pacific |
-
X-TRACK, is a regional altimeter products for coastal applications. It has been developed in order to optimize the completeness and the accuracy of the sea surface height information derived from satellite altimetry in coastal ocean areas. 1hz alongtrack SLA are available in 23 regions for different altimetric missions (Topex, Jason-1&2, Geosat, Ers2, Envisat). SLA is computed on a reference track. X-TRACK SLA files hold alongtrack SLA data together with MSSH, FES2012 tide, Dynamic Atmospheric Corrections and distance to coast parameters. Users can both retrieve filtered and non-filtered data. X-TRACK areas : | short name | long name | |:------------|:---------------------------------| | adelie | Adelie-Mertz | | amazon | Amazon | | asa | Atlantic South America | | chinasea | China Sea | | drake | Drake passage | | eaustralia | East Australia | | gom | Gulf of Mexico - Caribbean Sea | | gulfstream | Gulf Stream | | hudson | Hudson Bay | | humboldt | Humboldt current | | kerguelen | Kerguelen Islands | | labrador | Labrador Sea | | medsea | Mediterranean Sea | | nea | North East Atlantic | | nindian | North Indian Ocean | | norway | Norway | | nwa | North West America | | nwp | North West Pacific | | sea | South and East Africa | | wafrica | West Africa | | waustralia | West Australia | | wla | West Latin America - California | | wtp | West Tropical Pacific |
-
The mean and time-varying position of the main Southern Ocean polar fronts has been calculated from a combination of gridded altimetric sea level anomalies and a new climatology of mean sea level constructed from historical data and ARGO T / S profiles.
-
X-TRACK, is a regional altimeter products for coastal applications. Along-track tidal constants (amplitude, phase lags and associated estimation errors for 73 constituents) derived from the X-TRACK T/P and Jason 1&2 is available every 6-7 km along the satellite ground tracks. X-TRACK areas : | short name | long name | |:------------|:---------------------------------| | adelie | Adelie-Mertz | | amazon | Amazon | | asa | Atlantic South America | | chinasea | China Sea | | drake | Drake passage | | eaustralia | East Australia | | gom | Gulf of Mexico - Caribbean Sea | | gulfstream | Gulf Stream | | hudson | Hudson Bay | | humboldt | Humboldt current | | kerguelen | Kerguelen Islands | | labrador | Labrador Sea | | medsea | Mediterranean Sea | | nea | North East Atlantic | | nindian | North Indian Ocean | | norway | Norway | | nwa | North West America | | nwp | North West Pacific | | sea | South and East Africa | | wafrica | West Africa | | waustralia | West Australia | | wla | West Latin America - California | | wtp | West Tropical Pacific |
-
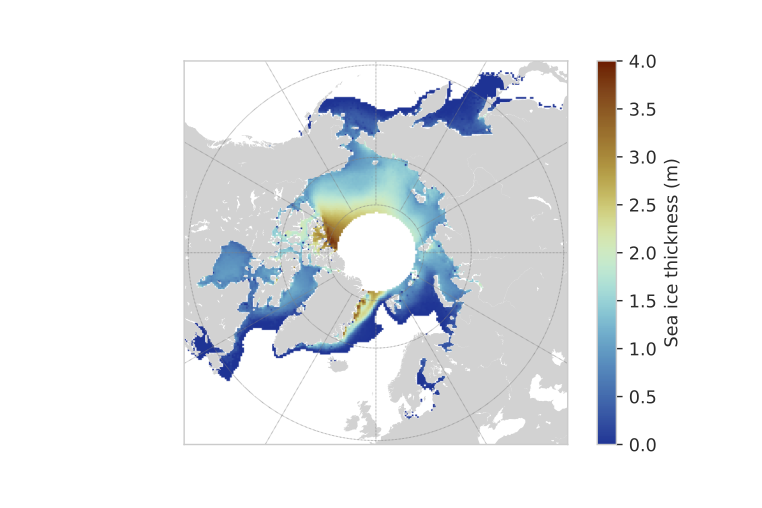
Sea ice thickness climate data record based on altimetry missions : ERS-1, ERS-2, Envisat and CryoSat-2. Data are available as EASE2-grid monthly maps with a spatial resolution of 12.5 km covering the period 1994-2023. The dataset also includes radar freeboard, sea ice freeboard, total freeboard, sea ice thickness as well as external variables such as sea ice density and sea ice concentration. Uncertainty are estimated using an ensemble approach and are distributed as statistics on the corresponding ensemble (mean, median, std, quantiles and percentiles).
-
Climatology of near-inertial currents. Global climatology of near-inertial current characteristics from satellite-tracked drifters. Data analysed : 8500 near-surface satellite-tracked drifter trajectories with drogues attached at 15 m depth.
-
X-TRACK, is a regional altimeter products for coastal applications. Along-track tidal constants (amplitude, phase lags and associated estimation errors for 73 constituents) derived from the X-TRACK T/P and Jason 1&2 is available every 6-7 km along the satellite ground tracks. X-TRACK areas : | short name | long name | |:------------|:---------------------------------| | adelie | Adelie-Mertz | | amazon | Amazon | | asa | Atlantic South America | | chinasea | China Sea | | drake | Drake passage | | eaustralia | East Australia | | gom | Gulf of Mexico - Caribbean Sea | | gulfstream | Gulf Stream | | hudson | Hudson Bay | | humboldt | Humboldt current | | kerguelen | Kerguelen Islands | | labrador | Labrador Sea | | medsea | Mediterranean Sea | | nea | North East Atlantic | | nindian | North Indian Ocean | | norway | Norway | | nwa | North West America | | nwp | North West Pacific | | sea | South and East Africa | | wafrica | West Africa | | waustralia | West Australia | | wla | West Latin America - California | | wtp | West Tropical Pacific |
-
Routine operation over a period shorter than 5 years (Enhanced Observation Period, EOP)