 Catalogue PIGMA
dataset
Type of resources
Available actions
Topics
Keywords
Contact for the resource
Provided by
Years
Formats
Representation types
Update frequencies
status
Scale
Resolution
-
Auteur(s): Buron Anne , Projet d'un équipement culturel dans les îlots des écluses 'Lesieur Céréol' et de l'îlot 'Tête de pont' dans le secteur des bassins à flots de Bordeaux.
-
Auteur(s): Tosini Alessandro , Implantation de 80 logements et leurs annexes, près de la gare d'Orléans dans le quartier de la Bastide à Bordeaux.
-
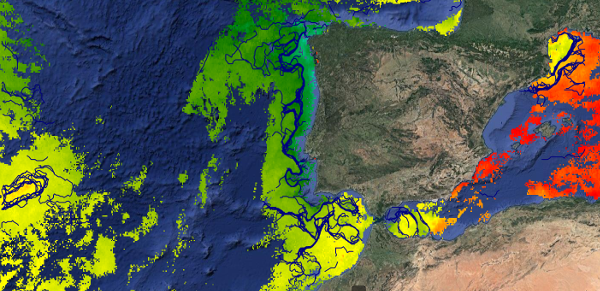
This dataset provides detections of fronts derived from high resolution remote sensing SST observations by SEVIRI L3C from OSISAF over Western Europe region. The data are available through HTTP and FTP; access to the data is free and open. In order to be informed about changes and to help us keep track of data usage, we encourage users to register at: https://forms.ifremer.fr/lops-siam/access-to-esa-world-ocean-circulation-project-data/ This dataset was generated by OceanDataLab and is distributed by Ifremer / CERSAT in the frame of the World Ocean Circulation (WOC) project funded by the European Space Agency (ESA).
-
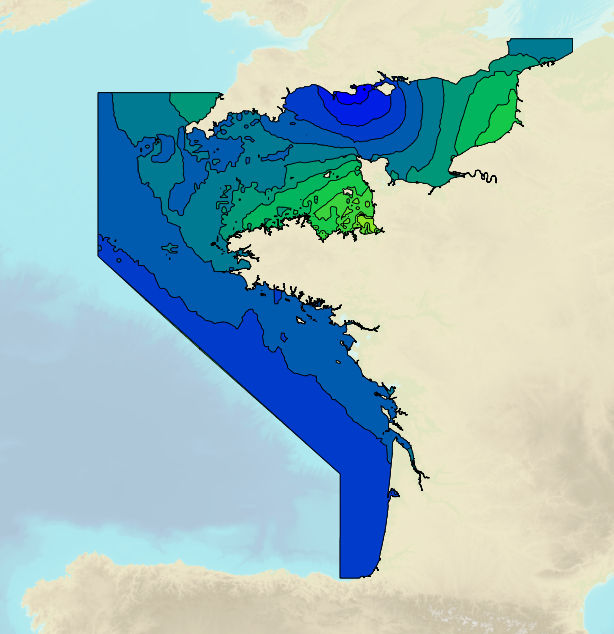
Tidal ranges on the French coasts of the Channel and the Atlantic for a coefficient of 95 : tidal range for mean neap tides for average atmospheric conditions..
-
Auteur(s): Fajolle Alain, Desmoulins Christian , Projet d'implantation d'un centre des arts du cirque au marché des Douves à Bordeaux
-
Annual time series of Total Nitrogen/Nitrates [mg/l] from in situ and model data
-
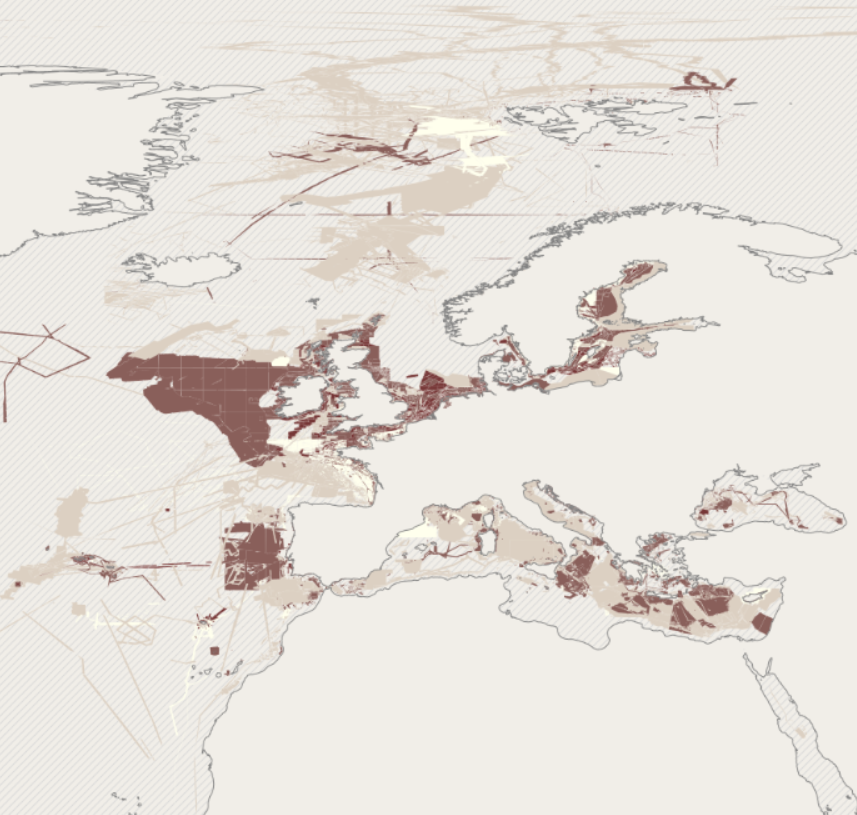
EMODnet bathymetry is composed of a multitude of datasets from a multitude of data providers. Users of the resulting grid and associated datasets need to be able to evaluate at the grid node level the quality of the bathymetric data and product they will be using. For this EMODnet Bathymetry has introduced a Quality index (QI). The QI is available as a WFS service providing vector data and as WMS providing the QI as an image service. The aim of the quality index is to: • help data users to evaluate quickly the dataset they are about to request, • indicate to the EMODnet Basin coordinators what are the limitations of the dataset they are about to merge while building the EMODnet DTM and to • be used as the basis of the evaluation of the quality of the EMODnet DTM. Service URL: https://ows.emodnet-bathymetry.eu/wfs
-

-
La loi du 27 février 2002 relative à la démocratie de proximité fixe comme premier objectif du recensement de la population la publication tous les ans des chiffres des populations légales : population municipale, population comptée à part et population totale. Ces chiffres sont calculés pour la France, toutes ses communes et circonscriptions administratives. La responsabilité du calcul des populations légales est confiée à l'Insee. La population municipale comprend les personnes ayant leur résidence habituelle sur le territoire de la commune. Elle inclut les personnes sans abri ou résidant habituellement dans des habitations mobiles recensées sur le territoire de la commune ainsi que les détenus dans les établissements pénitentiaires de la commune. C'est la population statistique comparable à la population sans double compte des précédents recensements. La population comptée à part comprend certaines personnes dont la résidence habituelle est dans une autre commune mais qui gardent un lien de résidence avec la commune. Elle comprend, par exemple, les élèves ou étudiants majeurs qui logent pour leurs études dans une autre commune mais dont la résidence familiale est située sur le territoire de la commune ou les personnes résidant dans une maison de retraite située dans une autre commune mais qui ont conservé une résidence familiale sur le territoire de la commune. Il est important de dénombrer à part de telles situations, d'abord pour clarifier quelle est véritablement la commune de résidence mais aussi pour ne pas produire des doubles comptes entre deux communes quand on additionne leurs populations. La population totale est la somme de la population municipale et de la population comptée à part. Les populations légales millésimées "n" sont diffusées fin décembre "n+2" pour les communes, cantons, arrondissements, départements et régions de France. Les résultats statistiques du recensement "n" sont diffusés au cours du second semestre "n+3".
-
