Catalogue PIGMA
oceans
Type of resources
Available actions
Topics
Keywords
Contact for the resource
Provided by
Years
Formats
Representation types
Update frequencies
status
Scale
Resolution
-
Specification of the desirable and recommended product attributes for generating time series of average annual sea temperature at mid-water and sea bottom for the last 10 yrs.
-
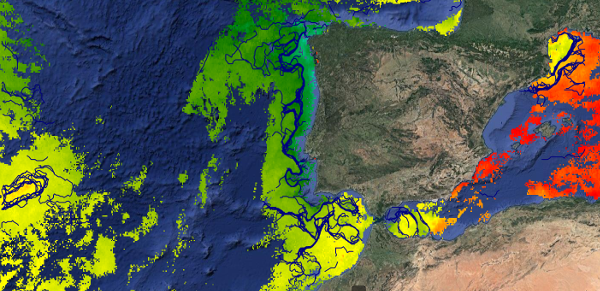
This dataset provides detections of fronts derived from high resolution remote sensing SST observations by SEVIRI L3C from OSISAF over Western Europe region. The data are available through HTTP and FTP; access to the data is free and open. In order to be informed about changes and to help us keep track of data usage, we encourage users to register at: https://forms.ifremer.fr/lops-siam/access-to-esa-world-ocean-circulation-project-data/ This dataset was generated by OceanDataLab and is distributed by Ifremer / CERSAT in the frame of the World Ocean Circulation (WOC) project funded by the European Space Agency (ESA).
-
Tidal ranges on the French coasts of the Channel and the Atlantic for a coefficient of 95 : tidal range for mean neap tides for average atmospheric conditions..
-
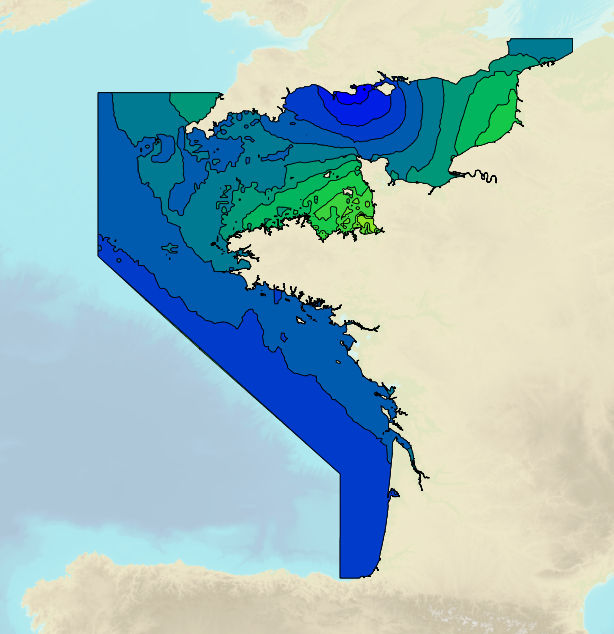
Maps of seasonal p90 (percentile 90) of Chla on the North Atlantic basin for the past ten years (2005-2014) using the Global Copernicus chla level 4 (L4) products (resolution of 4 km). Method as Gohin Francis, Saulquin Bertrand, Bryere Philippe (2010) Atlas de la Température, de la concentration en Chlorophylle et de la Turbidité de surface du plateau continental français et de ses abords de l’Ouest européen. Ifremer. http://archimer.ifremer.fr/doc/00057/16840/
-
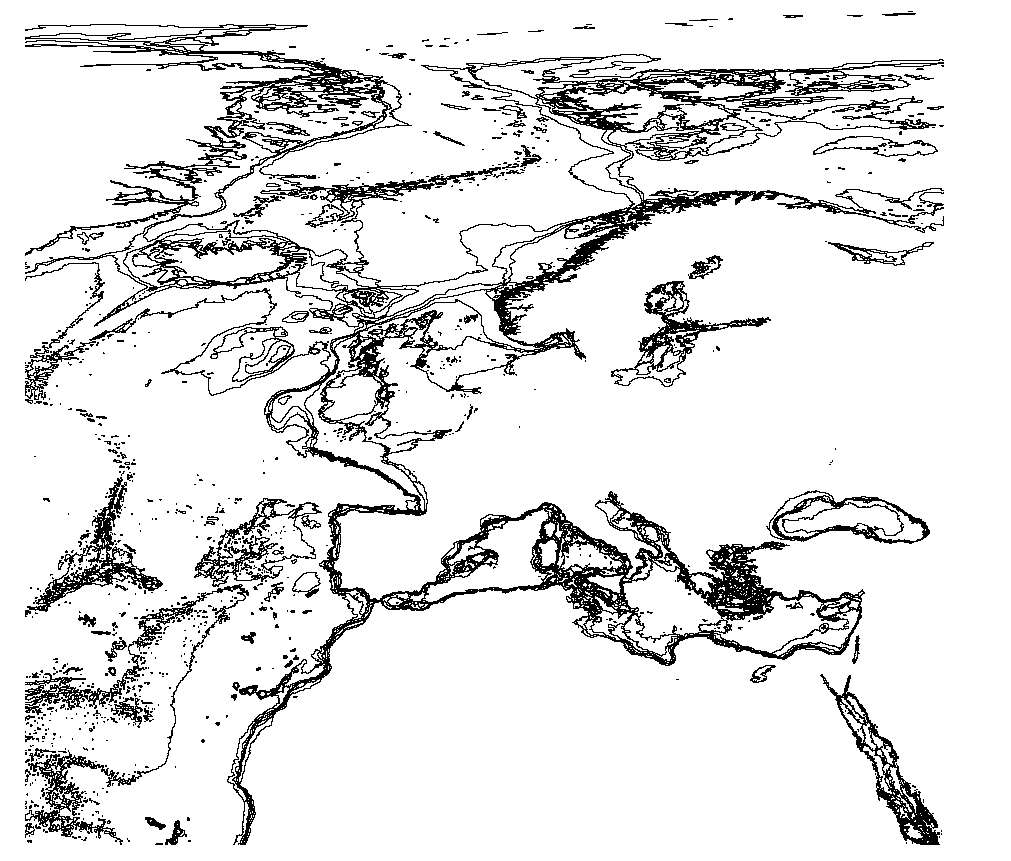
The EMODnet Bathymetric Contours are available as a WFS service from EMODnet Bathymetry. Service URL is: https://ows.emodnet-bathymetry.eu/wfs The bathymetric contours of this layer are generated automatically based on the EMODnet DTM. New contour sets will be available for each consecutive update of the EMODnet DTM. The contours are generated by GGSgc BV using the proprietary GGSgc software.
-
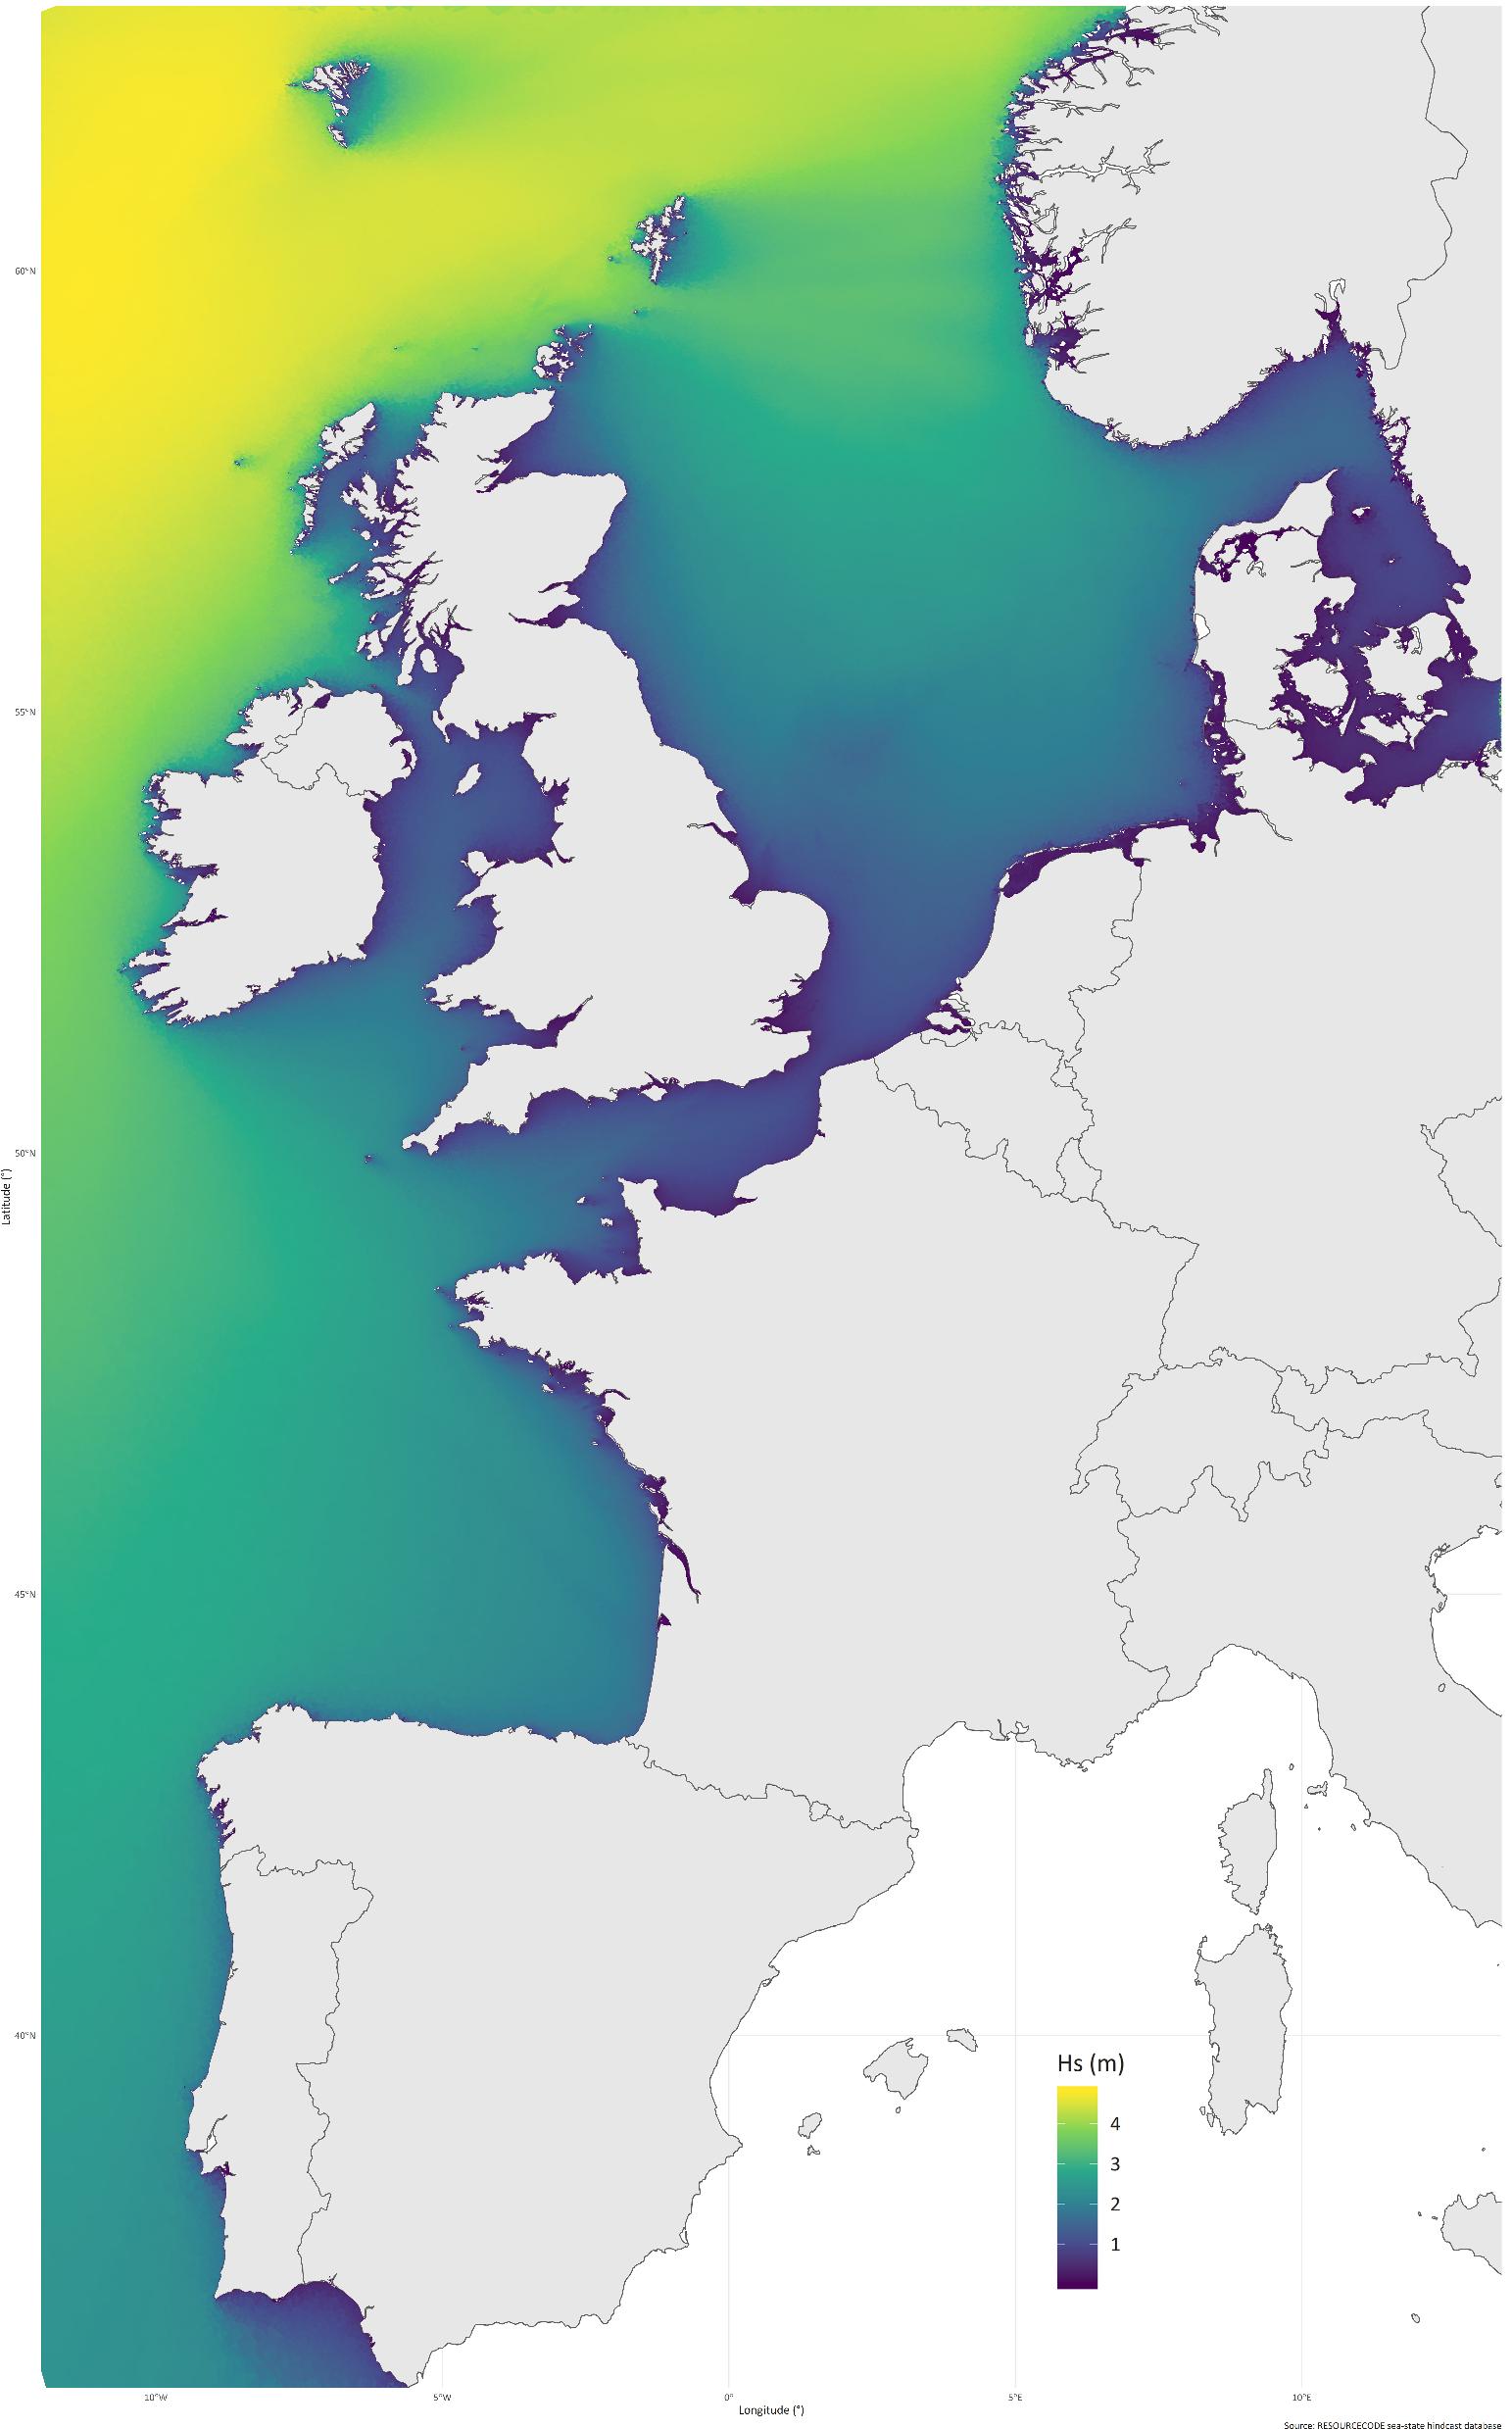
RESOURCECODE sea-states hindcast database generated by the wave model WAVEWATCH-III and forced by ERA5 winds on the European Shelf.
-
-
Annual time series of Total Nitrogen/Nitrates [mg/l] from in situ and model data
-
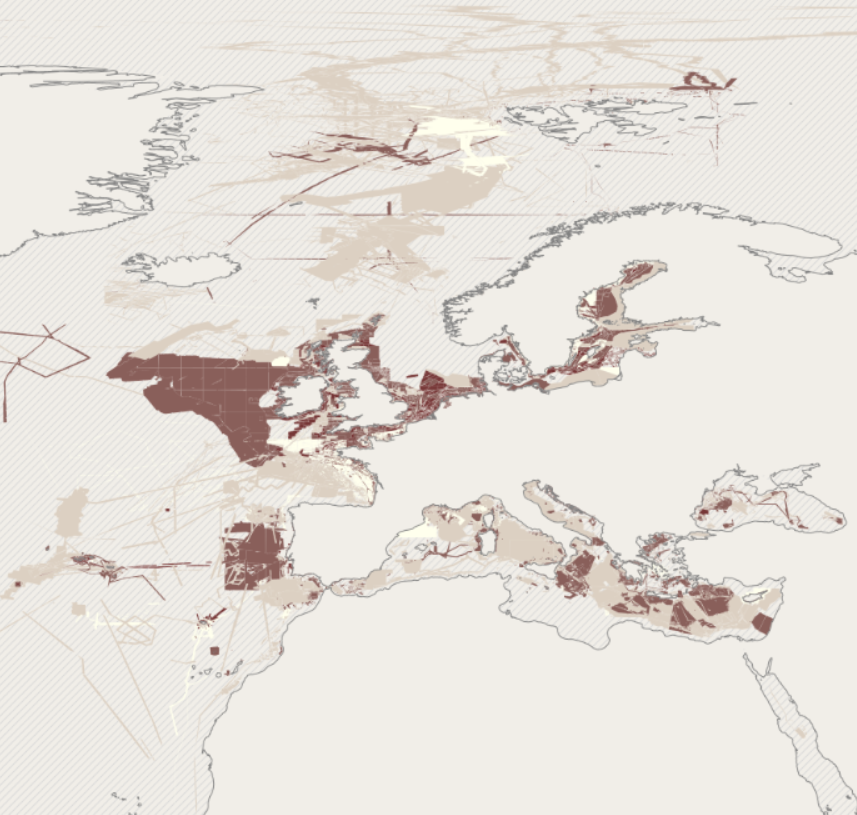
EMODnet bathymetry is composed of a multitude of datasets from a multitude of data providers. Users of the resulting grid and associated datasets need to be able to evaluate at the grid node level the quality of the bathymetric data and product they will be using. For this EMODnet Bathymetry has introduced a Quality index (QI). The QI is available as a WFS service providing vector data and as WMS providing the QI as an image service. The aim of the quality index is to: • help data users to evaluate quickly the dataset they are about to request, • indicate to the EMODnet Basin coordinators what are the limitations of the dataset they are about to merge while building the EMODnet DTM and to • be used as the basis of the evaluation of the quality of the EMODnet DTM. Service URL: https://ows.emodnet-bathymetry.eu/wfs
-