Catalogue PIGMA
NetCDF
Type of resources
Available actions
Topics
Keywords
Contact for the resource
Provided by
Years
Formats
Representation types
Update frequencies
status
Scale
Resolution
-
-

-
-
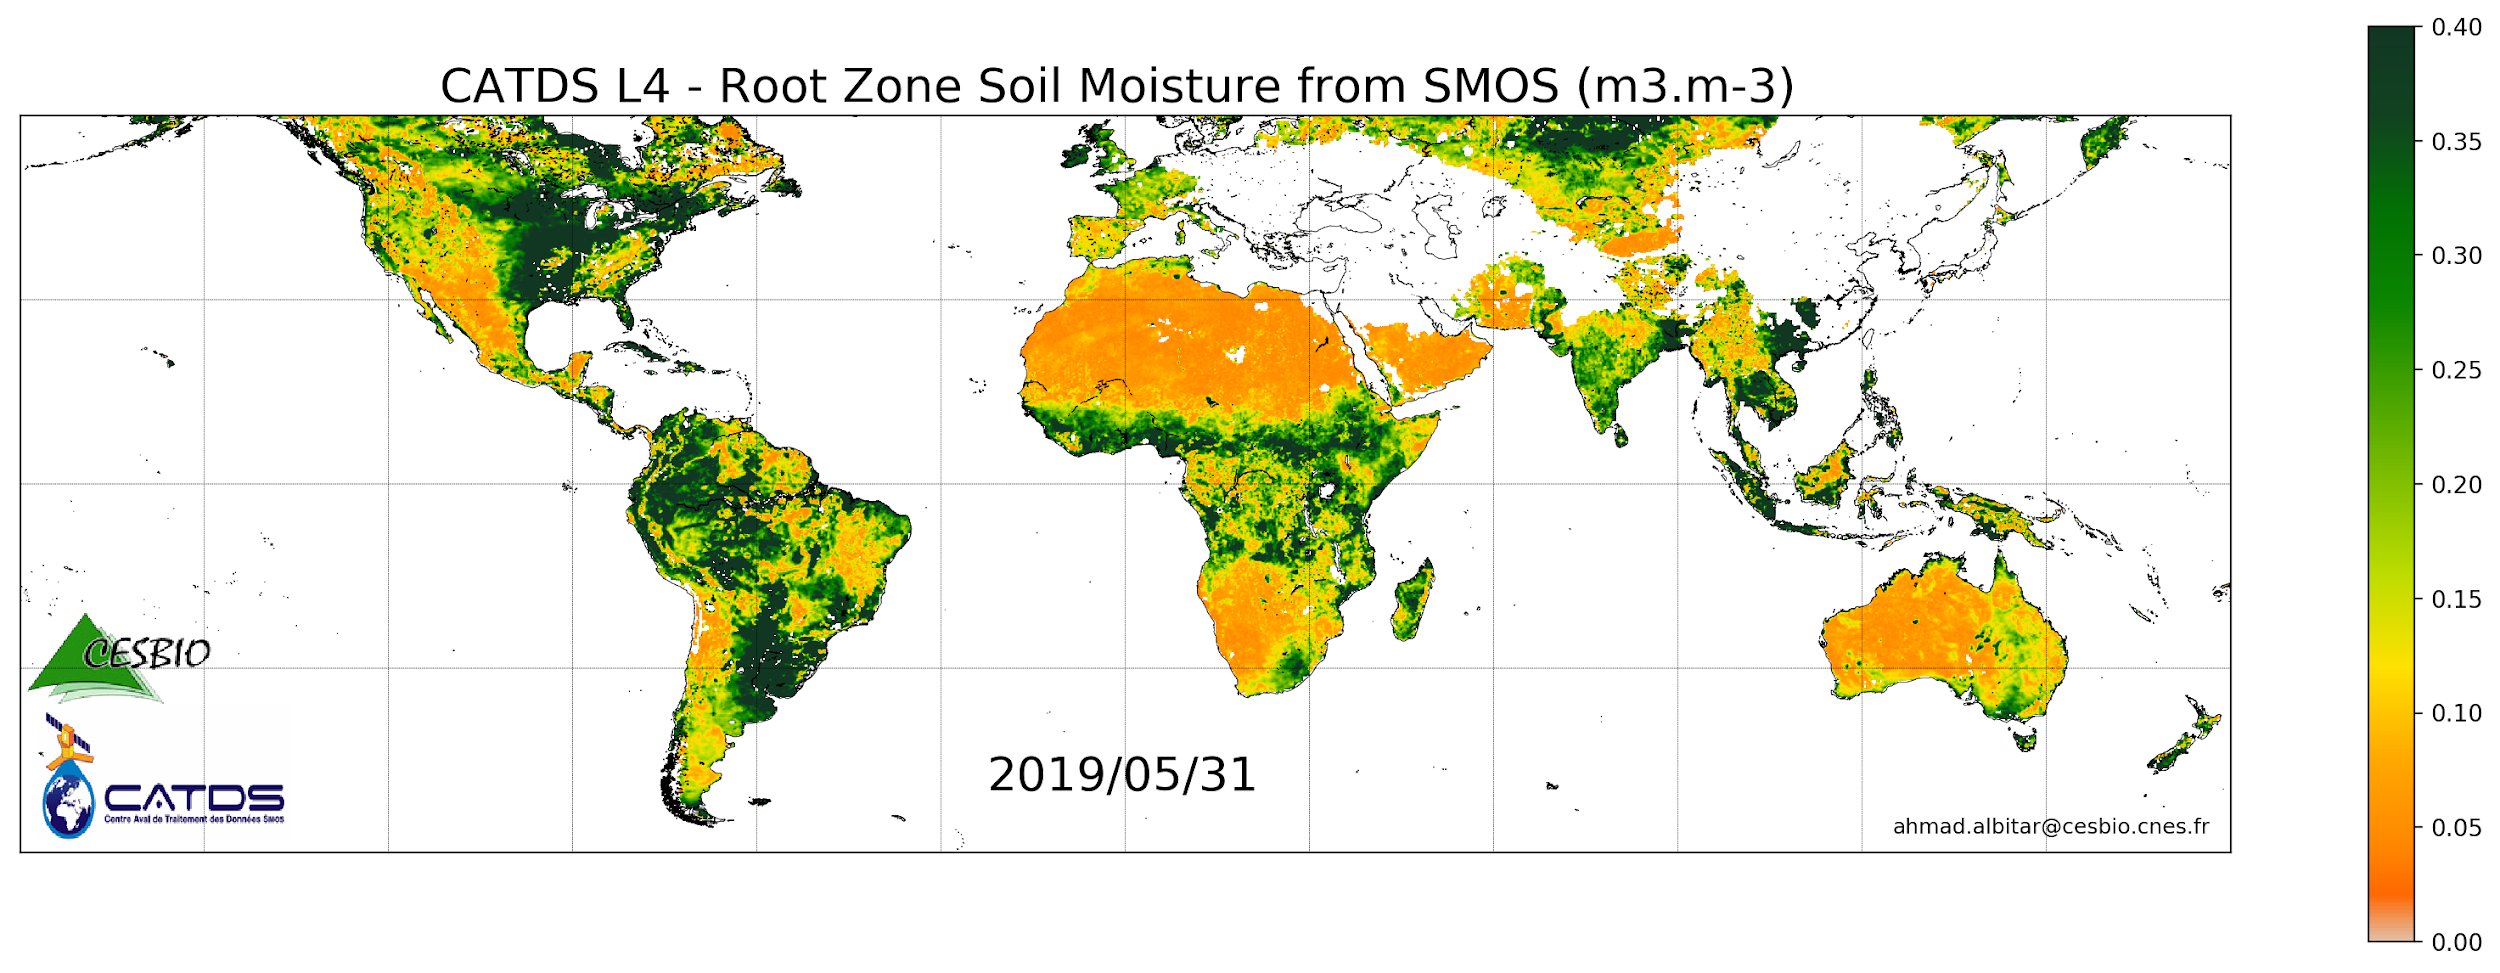
This product is a daily product of root zone soil moisture representative of the 0-1 m depth of the soil. The base products, for all the CATDS-PDC (Centre Aval de Traitement des Données SMOS - Production & Dissemination Center) processing chains, are the SMOS L1B products from ESA (European Space Agency). The L4SM RZSM is the daily product of root zone soil moisture (m3/m3) representative of the 0-1 m depth of the soil. The product contains also a quality index taking into account the presence of Radio Frequency Interference (RFI), low quality of retrieval of the input surface soil moisture, and a high fraction of non-nominal surfaces. Products from reprocessing RE07 are available for the period 01/2010 - 05/2021. Products from operational (OPER) processing are available since 06/2021. Reprocessed products and operational products are derived using the same algorithm and configuration, hence ensuring the temporal continuity.
-

-
This product is a daily product of root zone soil moisture representative of the 0-1 m depth of the soil.
-
NOAA STAR produces two lines of gridded 0.02deg super-collated L3S LEO datasets from Low Earth Orbiting (LEO) satellites, one from the NOAA afternoon JPSS (L3S_LEO_PM) and the other from the EUMETSAT mid-morning Metop-FG (L3S_LEO_AM). The L3S_LEO_PM is derived from JPSS satellites (in v2.80, NPP and N20) with VIIRS sensor onboard (0.75km/nadir). The L3S_LEO_PM dataset is produced by aggregating L3U datasets from two JPSS satellites ( https://doi.org/10.5067/GHVRS-3UO28 and https://doi.org/10.5067/GHV20-3UO28 ) and covers from Feb 2012-present. The L3S-LEO-PM data are reported in two files per 24hr interval, one daytime and one nighttime (nominal JPSS local equator crossing times around 01:30/13:30). Data is in NetCDF4 format, compliant with the GHRSST Data Specification version 2 (GDS2). The Near-Real Time (NRT) L3S-LEO data are archived at PO.DAAC with approximately 6 hours latency and then replaced by the Delayed Mode files about 2 months later, with identical file names. In addition to SST, the L3S-LEO files report the location and intensity of thermal fronts. The NRT/DM data are seamlessly stitched with the full-mission Reanalysis (RAN). The ACSPO L3S products are monitored and validated against in situ data in the NOAA iQuam system ( https://www.star.nesdis.noaa.gov/socd/sst/iquam ) in the NOAA SQUAM system ( https://www.star.nesdis.noaa.gov/socd/sst/squam ). Quality of SST imagery, clear-sky mask and thermal fronts is evaluated in the NOAA ARMS system ( https://www.star.nesdis.noaa.gov/socd/sst/arms ). NOAA plans to include data from other afternoon platforms and sensors, such as N21 and Aqua MODIS, into the future releases of the L3S_LEO_PM.
-
NOAA produces two lines of gridded 0.02deg super-collated L3S LEO SST datasets from Low Earth Orbiting (LEO) satellites, one from the NOAA afternoon JPSS (L3S_LEO_PM) and the other from the EUMETSAT mid-morning Metop-FG (L3S_LEO_AM). The L3S_LEO_AM is derived from Metop-A, -B and -C. The Metop-FG satellite program was jointly established by ESA and EUMETSAT. The US NOAA, under the Initial Joint Polar System Agreement with EUMETSAT, has contributed three AVHRR sensors capable of collecting and transmitting data in the Full Resolution Area Coverage (FRAC; 1km/nadir) format. The L3S_LEO_AM dataset is produced by aggregating three L3U datasets from MetOp-FG satellites ( http://doi.org/10.5067/GHMTA-3US28 , http://doi.org/10.5067/GHMTB-3US28 , http://doi.org/10.5067/GHMTC-3US28 ) and covers from Dec 2006-present. The L3S-LEO-AM data are reported in two files per 24hr interval, one daytime and one nighttime (nominal Metop local equator crossing times around 09:30/21:30, respectively), in NetCDF4 format, compliant with the GHRSST Data Specification version 2 (GDS2). The Near-Real Time (NRT) L3S-LEO data are archived at PO.DAAC with approximately 6 hours latency and then replaced by the Delayed Mode files about 2 months later, with identical file names. The NRT/DM data are seamlessly stitched with the full-mission Reanalysis (RAN). In addition to SST, the L3S-LEO files report the location and intensity of thermal fronts. The ACSPO L3S products are monitored and validated against in situ data in the NOAA iQuam system ( https://www.star.nesdis.noaa.gov/socd/sst/iquam ) in the NOAA SQUAM system ( https://www.star.nesdis.noaa.gov/socd/sst/squam ). Quality of SST imagery and clear-sky mask is evaluated in the NOAA ARMS system ( https://www.star.nesdis.noaa.gov/socd/sst/arms ). NOAA plans to include data from other mid-morning platforms and sensors, such as Metop-SG METImage, into L3S_LEO_AM.
-
-