Sea ice
Type of resources
Available actions
Topics
Keywords
Contact for the resource
Provided by
Years
Formats
Representation types
Update frequencies
status
Resolution
-
This level 3 product contains daily sea ice concentration from the 85 GHz channel of SSM/I on DMSP over Antarctic on polar sterographic 12.5 km resolution grids, available since 1992. The maps are processed from the daily brightness temperature maps from NSIDC. The Artist Sea Ice (ASI) algorithm developped at University of Bremen (Germany) is used to processed daily sea ice concentration maps at 12.5 km resolution. The dataset covers the whole 85 GHz SSM/I mission. We are grateful to NSIDC (Boulder, Colorado) for the SSMI data. This dataset is also available over Arctic.
-
This level 3 product contains artic polar sterographic 12.5 km resolution grids of sea ice concentration from the 85 GHz channel of SSM/I on DMSP, available since 1992. The daily maps are processed from the daily brightness temperature maps from NSIDC. The Artist Sea Ice (ASI) algorithm developped at University of Bremen (Germany) is used to processed daily sea ice concentration maps at 12.5 km resolution. The dataset covers the whole 85 GHz SSM/I mission. We are grateful to NSIDC (Boulder, Colorado) for the SSMI data. temporal resolution = daily SSM/I Sea-Ice concentration Arctic Daily Maps on 12.5 km Polar Grid
-
This dataset provides the version 3.1 of the database of small icebergs (lower than 3km in length) detected in Austral and Arctic Ocean, using the high resolution waveforms from spaceborne altimeters from 1992 to 2021. This database is organized by pole (arctic, antarctic) and provides several product levels for each one: * Level 2 products are the individual detections of icebergs along the altimeter tracks. * Level 3 products contains both antarctic polar stereographic 100 km resolution grids of monthly volume of ice and geographic equirectangular (1° in lat x 2° in lon) resolution grids of monthly volume of ice, probability of presence of icebergs and mean iceberg area. Each product organised by altimeter mission (ERS-1, ERS-2, Jason-1, Jason-2, Jason-3, CryoSat-2, Topex, ENVISAT, SARAL, HY2A, HY2B, Sentinel-3A, Sentinel-3B). A merged product combining all the available altimeters is also provided. This database was developed in the frame of Altiberg project, funded by CNES.
-
Daily sea ice age and sea ice age fractions with uncertainties in the period 1991 - 2025. Coverage: Arctic Ocean. Resolution: 25 km. '''DOI (product) :''' https://doi.org/10.48670/mds-00371
-
Laternula elliptica is one of the largest bivalve mollusk in Antarctic waters. Its shell presents annual growth increments that can be crossdated for the construction of master chronologies. Inter-annual variations of the resulting growth indices are driven by environmental forcings, among which sea ice and sympagic algae dynamics are the main ones. These two datasets present shell growth data collected in cross-sections of chondrophores (hinge area) of 27 Laternula elliptica specimens harvested by SCUBA diving near Dumont d'Urville Station (Adélie Land, East Antarctica) in January 2016. A calendar year was assigned to each annual growth increment by visual crossdating backward from the sampling year. Growth increment widths, expressed in micrometers, were measured from the last deposited growth increment (margin) toward earlier growth years (raw increment width µm file). Each individual time-series of growth increment width was first power-transformed, then detrended with a negative exponential function to compute two time-series of annual growth indices, with or without prewhitening by fitting an autoregressive model (growth indices file).
-
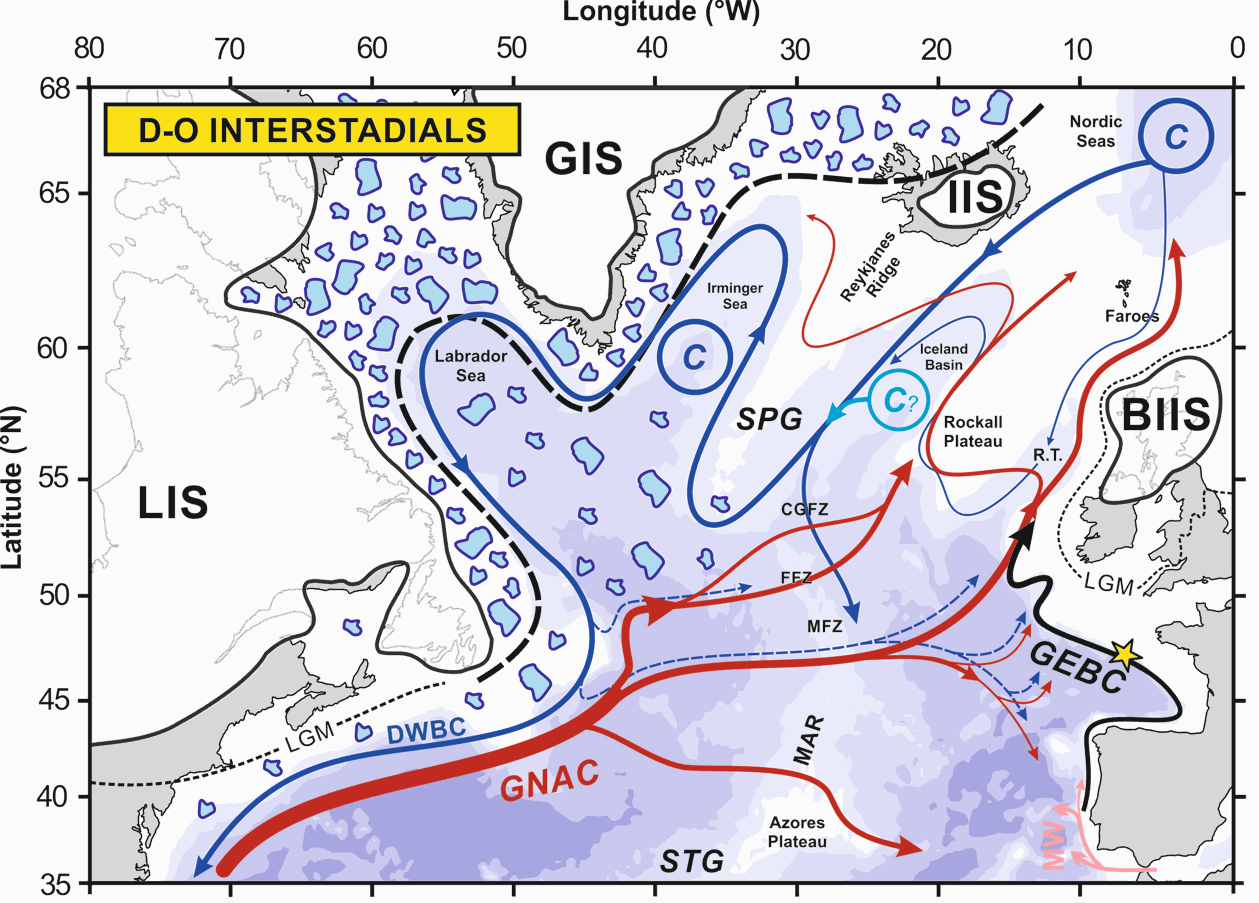
The upper branch of the Atlantic Meridional Overturning Circulation (AMOC) plays a critical role in ocean circulation and climate change, yet its variability during the last glacial period is poorly documented. Here, we investigate the northward-flowing Glacial Eastern Boundary Current (GEBC) in the North Atlantic, known today as the European Slope Current, and representing the easternmost portion of the upper branch of the AMOC. Based on flow speed (sortable silt, XRF) and radiogenic/stable isotopic records, we show that Dansgaard-Oeschger (D/O) interstadials (stadials) correspond to a faster (weaker) GEBC during the ~50-15 ka period. This, by analogy to present-day conditions, suggests enhanced (reduced) strength of the subpolar gyre and, by extension, of northern-sourced water production and AMOC during D-O interstadials (stadials). Concomitant fluctuations of both the European Ice Sheet and the GEBC between ~30 and 17 ka suggest an active role of the upper branch of AMOC in the poleward transport of heat and freshwater to the northern North Atlantic, with direct impacts on deep water formation and AMOC strength. Our GEBC reconstruction is the first physical (non-chemical) record documenting dynamic upper AMOC variability at high resolution in the eastern basin of the North Atlantic. Together with the deep North Atlantic records of northern-sourced water export, they confirm the central role of the AMOC in the generation of abrupt climate changes.
-
'''This product has been archived''' For operationnal and online products, please visit https://marine.copernicus.eu '''Short description:''' You can find here the CMEMS Global Ocean Ensemble Reanalysis product at ¼ degree resolution : monthly means of Temperature, Salinity, Currents and Ice variables for 75 vertical levels, starting from 1993 onward. Global ocean reanalyses are homogeneous 3D gridded descriptions of the physical state of the ocean covering several decades, produced with a numerical ocean model constrained with data assimilation of satellite and in situ observations. These reanalyses are built to be as close as possible to the observations (i.e. realistic) and in agreement with the model physics The multi-model ensemble approach allows uncertainties or error bars in the ocean state to be estimated. The ensemble mean may even provide for certain regions and/or periods a more reliable estimate than any individual reanalysis product. The four reanalyses, used to create the ensemble, covering “altimetric era” period (starting from 1st of January 1993) during which altimeter altimetry data observations are available: * GLORYS2V4 from Mercator Ocean (Fr); * ORAS5 from ECMWF; * GloSea5 from Met Office (UK); * and C-GLORSv7 from CMCC (It); These four products provided four different time series of global ocean simulations 3D monthly estimates. All numerical products available for users are monthly or daily mean averages describing the ocean. '''DOI (product) :''' https://doi.org/10.48670/moi-00024
-
In April 2017, two Ice Atmosphere Arctic Ocean Observing System platforms (IAOOS 23 and IAOOS 24) were deployed near the North Pole. Over the next 8 months, they meandered southwards with the ice in the Transpolar Drift, collecting measurements in the upper 250 m of Amundsen Basin, Nansen Basin and Fram Strait. The ocean profilers are PROVOR SPI (from French manufacturer NKE), which includes a Seabird SBE41 CTD (Conductivity, Temperature, Depth) and a dissolved oxygen (DO) Aandera 4330 optode. IAOOS 23 also featured a bio-optics sensor suite and a submersible ultraviolet nitrate analyzer (SUNA, Satlantic-Seabird Inc.). The bio-optics sensor suite (called Pack Rem A) combines a three-optical-sensor instrument (ECO Triplet, WET Labs Inc.) and a multispectral radiometer (OCR-504, Satlantic Inc.). The present dataset is composed of chlorophyll-a fluorescence, backscatter, irradiances (at 412, 490 and 555 nm), photosynthetically active radiation (PAR), nitrate and colored-dissolved organic matter data from the IAOOS 23 platform, as well as composites of absolute salinity, conservative temperature and apparent oxygen utilization data from both profilers. The profilers were set to perform two upward profiles a day from 250 m starting at approximately 6 am and 6 pm. In this dataset, chlorophyll-a, PAR and irradiances were corrected with a shift to set dark values to zero. Nitrate was interpolated vertically every 5 m, and all other parameters were interpolated vertically every 0.5 m.
Catalogue PIGMA