 Catalogue PIGMA
series
Type of resources
Available actions
Topics
Keywords
Contact for the resource
Provided by
Years
Formats
Representation types
Update frequencies
status
Scale
Resolution
-

'''Short description:''' Le modèle biogéochimique ECO-MARS3D sur la façade Manche Atlantique (PREVIMER_B1-ECOMARS3D-MANGA4000) est un modèle 3D de résolution spatiale 4km qui fournit les concentrations de nutriments et de plancton toutes les heures sur 30 niveaux (fenêtre de prévision à 4 jours). '''Paramètres calculés :''' Les paramètres calculés sont les suivants : * SAL : sea_water_salinity * TEMP : sea_water_temperature * suspended_inorganic_particulate_matter : mass_concentration_of_suspended_matter_in_sea_water * nanopicoplankton_nitrogen : mole_concentration_of_nanoplankton_expressed_as_nitrogen_in_sea_water * diatom_nitrogen : mole_concentration_of_diatoms_expressed_as_nitrogen_in_sea_water * dinoflagellate_nitrogen : mole_concentration_of_dinoflagellates_expressed_as_nitrogen_in_sea_water * microzooplankton_nitrogen : mole_concentration_of_microzooplankton_expressed_as_nitrogen_in_sea_water * mesozooplankton_nitrogen : mole_concentration_of_mesozooplankton_expressed_as_nitrogen_in_sea_water * colonial_phaeocystis_nitrogen : mole_concentration_of_colonial_phaeocystis_expressed_as_nitrogen_in_sea_water * phaeocystis_mucus : concentration_of_phaeocystis_mucus_expressed_as_mass_in_sea_water * ammonium : mole_concentration_of_ammonium_in_sea_water * nitrate : mole_concentration_of_nitrate_in_sea_water * dissolved_silicate : mole_concentration_of_silicate_in_sea_water * dissolved_phosphate : mole_concentration_of_phosphate_in_sea_water * dissolved_oxygen : dissolved_oxygen_in_water_column * cumulative_nanoflagellate_carbon_production : cumulative_nanoflagellate_production_expressed_as_carbon_in_sea_water * cumulative_diatom_carbon_production : cumulative_diatom_production_expressed_as_carbon_in_sea_water * cumulative_dinoflagellate_carbon_production : cumulative_dinoflagellate_production_expressed_as_carbon_in_sea_water * cumulative_phaeocystis_carbon_production : cumulative_phaeocystis_production_expressed_as_carbon_in_sea_water * organic_nitrogen_benth : mole_concentration_of_organic_detritus_expressed_as_nitrogen_in_benthos Les paramètres diagnostiques calculés sont les suivants : * XE : sea_surface_height_above_geoid * maximum_de_diat : maximum_diatom_mass_concentration_in_sea_water * maximum_de_dino : maximum_dinoflagellate_mass_concentration_in_sea_water * maximum_de_nano : maximum_nanoflagellate_mass_concentration_in_sea_water * grad_vert_salinite : maximum_vertical_gradient_of_sea_water_salinity * grad_vert_temp : maximum_vertical_gradient_of_sea_water_temperature * extinction_lumineuse : light_extinction_in_sea_water * prod_diat : cumulated_production_of_diatoms_in_sea_water_column_expressed_in_carbon * prod_dino : cumulated_production_of_dinoflagellates_in_sea_water_column_expressed_in_carbon * prod_nano : cumulated_production_of_nanoflagellates_in_sea_water_column_expressed_in_carbon * chlorophylle_a : chlorophyll_mass_concentration_in_sea_water * prod_cumul_chloro : cumulated_total_production_in_sea_water_column_expressed_in_carbon * maximum_de_phaeocystis : maximum_phaeocystis_mass_concentration_in_sea_water * prod_phaeocystis : cumulated_production_of_phaeocystis_in_sea_water_column_expressed_in_carbon * oxygen_saturation : oxygen_saturation * ammoniumGIRON_tracer_sign: mole_concentration_of_ammonium_in_sea_waterGIRON_tracer_sign * ammoniumGIRON_tracer_age: mole_concentration_of_ammonium_in_sea_waterGIRON_tracer_age * nitrateGIRON_tracer_sign: mole_concentration_of_nitrate_in_sea_waterGIRON_tracer_sign * nitrateGIRON_tracer_age: mole_concentration_of_nitrate_in_sea_waterGIRON_tracer_age * nanopicoplankton_nitrogenGIRON_tracer_sign: mole_concentration_of_nanoplankton_expressed_as_nitrogen_in_sea_waterGIRON_tracer_sign * nanopicoplankton_nitrogenGIRON_tracer_age: mole_concentration_of_nanoplankton_expressed_as_nitrogen_in_sea_waterGIRON_tracer_age * diatom_nitrogenGIRON_tracer_sign: mole_concentration_of_diatoms_expressed_as_nitrogen_in_sea_waterGIRON_tracer_sign * diatom_nitrogenGIRON_tracer_age: mole_concentration_of_diatoms_expressed_as_nitrogen_in_sea_waterGIRON_tracer_age * dinoflagellate_nitrogenGIRON_tracer_sign: mole_concentration_of_dinoflagellates_expressed_as_nitrogen_in_sea_waterGIRON_tracer_sign * dinoflagellate_nitrogenGIRON_tracer_age: mole_concentration_of_dinoflagellates_expressed_as_nitrogen_in_sea_waterGIRON_tracer_age * microzooplankton_nitrogenGIRON_tracer_sign: mole_concentration_of_microzooplankton_expressed_as_nitrogen_in_sea_waterGIRON_tracer_sign * microzooplankton_nitrogenGIRON_tracer_age: mole_concentration_of_microzooplankton_expressed_as_nitrogen_in_sea_waterGIRON_tracer_age * mesozooplankton_nitrogenGIRON_tracer_sign: mole_concentration_of_mesozooplankton_expressed_as_nitrogen_in_sea_waterGIRON_tracer_sign * mesozooplankton_nitrogenGIRON_tracer_age: mole_concentration_of_mesozooplankton_expressed_as_nitrogen_in_sea_waterGIRON_tracer_age * detrital_nitrogenGIRON_tracer_sign: mole_concentration_of_organic_detritus_expressed_as_nitrogen_in_sea_waterGIRON_tracer_sign * detrital_nitrogenGIRON_tracer_age: mole_concentration_of_organic_detritus_expressed_as_nitrogen_in_sea_waterGIRON_tracer_age * colonial_phaeocystis_nitrogenGIRON_tracer_sign: mole_concentration_of_colonial_phaeocystis_expressed_as_nitrogen_in_sea_waterGIRON_tracer_sign * colonial_phaeocystis_nitrogenGIRON_tracer_age: mole_concentration_of_colonial_phaeocystis_expressed_as_nitrogen_in_sea_waterGIRON_tracer_age * phaeocystis_cells_nitrogenGIRON_tracer_sign: mole_concentration_of_phaeocystis_cells_expressed_as_nitrogen_in_sea_waterGIRON_tracer_sign * phaeocystis_cells_nitrogenGIRON_tracer_age: mole_concentration_of_phaeocystis_cells_expressed_as_nitrogen_in_sea_waterGIRON_tracer_age * organic_nitrogen_benthGIRON_tracer_sign: mole_concentration_of_organic_detritus_expressed_as_nitrogen_in_benthosGIRON_tracer_sign * organic_nitrogen_benthGIRON_tracer_age: mole_concentration_of_organic_detritus_expressed_as_nitrogen_in_benthosGIRON_tracer_age * phytoplankton_sign_N_GIRON: nitrogen_fraction_in_phytoplankton_from_source_GIRON * phytoplankton_age_N_GIRON: age_of_nitrogen_fraction_in_phytoplankton_from_source_GIRON * ammoniumLOIRE_tracer_sign: mole_concentration_of_ammonium_in_sea_waterLOIRE_tracer_sign * ammoniumLOIRE_tracer_age: mole_concentration_of_ammonium_in_sea_waterLOIRE_tracer_age * nitrateLOIRE_tracer_sign: mole_concentration_of_nitrate_in_sea_waterLOIRE_tracer_sign * nitrateLOIRE_tracer_age: mole_concentration_of_nitrate_in_sea_waterLOIRE_tracer_age * nanopicoplankton_nitrogenLOIRE_tracer_sign: mole_concentration_of_nanoplankton_expressed_as_nitrogen_in_sea_waterLOIRE_tracer_sign * nanopicoplankton_nitrogenLOIRE_tracer_age: mole_concentration_of_nanoplankton_expressed_as_nitrogen_in_sea_waterLOIRE_tracer_age * diatom_nitrogenLOIRE_tracer_sign: mole_concentration_of_diatoms_expressed_as_nitrogen_in_sea_waterLOIRE_tracer_sign * diatom_nitrogenLOIRE_tracer_age: mole_concentration_of_diatoms_expressed_as_nitrogen_in_sea_waterLOIRE_tracer_age * dinoflagellate_nitrogenLOIRE_tracer_sign: mole_concentration_of_dinoflagellates_expressed_as_nitrogen_in_sea_waterLOIRE_tracer_sign * dinoflagellate_nitrogenLOIRE_tracer_age: mole_concentration_of_dinoflagellates_expressed_as_nitrogen_in_sea_waterLOIRE_tracer_age * microzooplankton_nitrogenLOIRE_tracer_sign: mole_concentration_of_microzooplankton_expressed_as_nitrogen_in_sea_waterLOIRE_tracer_sign * microzooplankton_nitrogenLOIRE_tracer_age: mole_concentration_of_microzooplankton_expressed_as_nitrogen_in_sea_waterLOIRE_tracer_age * mesozooplankton_nitrogenLOIRE_tracer_sign: mole_concentration_of_mesozooplankton_expressed_as_nitrogen_in_sea_waterLOIRE_tracer_sign * mesozooplankton_nitrogenLOIRE_tracer_age: mole_concentration_of_mesozooplankton_expressed_as_nitrogen_in_sea_waterLOIRE_tracer_age * detrital_nitrogenLOIRE_tracer_sign: mole_concentration_of_organic_detritus_expressed_as_nitrogen_in_sea_waterLOIRE_tracer_sign * detrital_nitrogenLOIRE_tracer_age: mole_concentration_of_organic_detritus_expressed_as_nitrogen_in_sea_waterLOIRE_tracer_age * colonial_phaeocystis_nitrogenLOIRE_tracer_sign: mole_concentration_of_colonial_phaeocystis_expressed_as_nitrogen_in_sea_waterLOIRE_tracer_sign * colonial_phaeocystis_nitrogenLOIRE_tracer_age: mole_concentration_of_colonial_phaeocystis_expressed_as_nitrogen_in_sea_waterLOIRE_tracer_age * phaeocystis_cells_nitrogenLOIRE_tracer_sign: mole_concentration_of_phaeocystis_cells_expressed_as_nitrogen_in_sea_waterLOIRE_tracer_sign * phaeocystis_cells_nitrogenLOIRE_tracer_age: mole_concentration_of_phaeocystis_cells_expressed_as_nitrogen_in_sea_waterLOIRE_tracer_age * organic_nitrogen_benthLOIRE_tracer_sign: mole_concentration_of_organic_detritus_expressed_as_nitrogen_in_benthosLOIRE_tracer_sign * organic_nitrogen_benthLOIRE_tracer_age: mole_concentration_of_organic_detritus_expressed_as_nitrogen_in_benthosLOIRE_tracer_age * phytoplankton_sign_N_LOIRE: nitrogen_fraction_in_phytoplankton_from_source_LOIRE * phytoplankton_age_N_LOIRE: age_of_nitrogen_fraction_in_phytoplankton_from_source_LOIRE * ammoniumSEINE_tracer_sign: mole_concentration_of_ammonium_in_sea_waterSEINE_tracer_sign * ammoniumSEINE_tracer_age: mole_concentration_of_ammonium_in_sea_waterSEINE_tracer_age * nitrateSEINE_tracer_sign: mole_concentration_of_nitrate_in_sea_waterSEINE_tracer_sign * nitrateSEINE_tracer_age: mole_concentration_of_nitrate_in_sea_waterSEINE_tracer_age * nanopicoplankton_nitrogenSEINE_tracer_sign: mole_concentration_of_nanoplankton_expressed_as_nitrogen_in_sea_waterSEINE_tracer_sign * nanopicoplankton_nitrogenSEINE_tracer_age: mole_concentration_of_nanoplankton_expressed_as_nitrogen_in_sea_waterSEINE_tracer_age * diatom_nitrogenSEINE_tracer_sign: mole_concentration_of_diatoms_expressed_as_nitrogen_in_sea_waterSEINE_tracer_sign * diatom_nitrogenSEINE_tracer_age: mole_concentration_of_diatoms_expressed_as_nitrogen_in_sea_waterSEINE_tracer_age * dinoflagellate_nitrogenSEINE_tracer_sign: mole_concentration_of_dinoflagellates_expressed_as_nitrogen_in_sea_waterSEINE_tracer_sign * dinoflagellate_nitrogenSEINE_tracer_age: mole_concentration_of_dinoflagellates_expressed_as_nitrogen_in_sea_waterSEINE_tracer_age * microzooplankton_nitrogenSEINE_tracer_sign: mole_concentration_of_microzooplankton_expressed_as_nitrogen_in_sea_waterSEINE_tracer_sign * microzooplankton_nitrogenSEINE_tracer_age: mole_concentration_of_microzooplankton_expressed_as_nitrogen_in_sea_waterSEINE_tracer_age * mesozooplankton_nitrogenSEINE_tracer_sign: mole_concentration_of_mesozooplankton_expressed_as_nitrogen_in_sea_waterSEINE_tracer_sign * mesozooplankton_nitrogenSEINE_tracer_age: mole_concentration_of_mesozooplankton_expressed_as_nitrogen_in_sea_waterSEINE_tracer_age * detrital_nitrogenSEINE_tracer_sign: mole_concentration_of_organic_detritus_expressed_as_nitrogen_in_sea_waterSEINE_tracer_sign * detrital_nitrogenSEINE_tracer_age: mole_concentration_of_organic_detritus_expressed_as_nitrogen_in_sea_waterSEINE_tracer_age * colonial_phaeocystis_nitrogenSEINE_tracer_sign: mole_concentration_of_colonial_phaeocystis_expressed_as_nitrogen_in_sea_waterSEINE_tracer_sign * colonial_phaeocystis_nitrogenSEINE_tracer_age: mole_concentration_of_colonial_phaeocystis_expressed_as_nitrogen_in_sea_waterSEINE_tracer_age * phaeocystis_cells_nitrogenSEINE_tracer_sign: mole_concentration_of_phaeocystis_cells_expressed_as_nitrogen_in_sea_waterSEINE_tracer_sign * phaeocystis_cells_nitrogenSEINE_tracer_age: mole_concentration_of_phaeocystis_cells_expressed_as_nitrogen_in_sea_waterSEINE_tracer_age * organic_nitrogen_benthSEINE_tracer_sign: mole_concentration_of_organic_detritus_expressed_as_nitrogen_in_benthosSEINE_tracer_sign * organic_nitrogen_benthSEINE_tracer_age: mole_concentration_of_organic_detritus_expressed_as_nitrogen_in_benthosSEINE_tracer_age * phytoplankton_sign_N_SEINE: nitrogen_fraction_in_phytoplankton_from_source_SEINE * phytoplankton_age_N_SEINE: age_of_nitrogen_fraction_in_phytoplankton_from_source_SEINE
-

'''Short description:''' Mediterranean Sea - near real-time (NRT) in situ quality controlled observations, hourly updated and distributed by INSTAC within 24-48 hours from acquisition in average '''DOI (product) :''' https://doi.org/10.48670/moi-00044
-
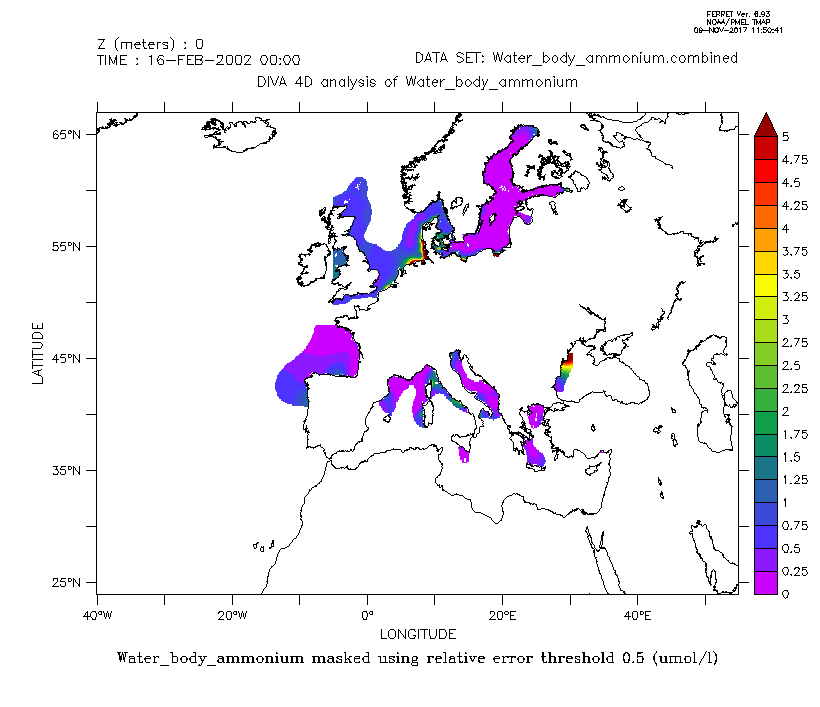
Combined product of Water body ammonium based on DIVA 4D 10-year analysis on five regions : Northeast Atlantic Ocean, North Sea, Baltic Sea, Black Sea, Mediterranean Sea. The boundaries and overlapping zones between these five regions were filtered to avoid any unrealistic spatial discontinuities. This combined Water body ammonium product is masked using the relative error threshold 0.5. Units: umol/l.
-
This product displays the stations present in EMODnet validated dataset where cadmium levels have been measured in water. EMODnet Chemistry has included the gathering of contaminants data since the beginning of the project in 2009. For the maps for EMODnet Chemistry Phase III, it was requested to plot data per matrix (water,sediment, biota), per biological entity and per chemical substance. The series of relevant map products have been developed according to the criteria D8C1 of the MSFD Directive, specifically focusing on the requirements under the new Commission Decision 2017/848 (17th May 2017). The Commission Decision points to relevant threshold values that are specified in the WFD, as well as relating how these contaminants should be expressed (units and matrix etc.) through the related Directives i.e. Priority substances for Water. EU EQS Directive does not fix any threshold values in sediments. On the contrary Regional Sea Conventions provide some of them, and these values have been taken into account for the development of the visualization products. To produce the maps the following process has been followed: 1. Data collection through SeaDataNet standards (CDI+ODV) 2. Harvesting, harmonization, validation and P01 code decomposition of data 3. SQL query on data sets from point 2 4. Production of map with each point representing at least one record that match the criteria The harmonization of all the data has been the most challenging task considering the heterogeneity of the data sources, sampling protocols. Preliminary processing were necessary to harmonize all the data : • For water: contaminants in the dissolved phase; • For sediment: data on total sediment (regardless of size class) or size class < 2000 μm • For biota: contaminant data will focus on molluscs, on fish (only in the muscle), and on crustaceans • Exclusion of data values equal to 0
-

-

-
-

EMODnet Chemistry aims to provide access to marine chemistry datasets and derived data products concerning eutrophication, acidity and contaminants. The importance of the selected substances and other parameters relates to the Marine Strategy Framework Directive (MSFD). This aggregated dataset contains all unrestricted EMODnet Chemistry data on eutrophication and acidity, and covers the Northeast Atlantic Ocean (40W). Data were aggregated and quality controlled by 'IFREMER / IDM / SISMER - Scientific Information Systems for the SEA' in France. ITS-90 water temperature and water body salinity variables have also been included ('as are') to complete the eutrophication and acidity data. If you use these variables for calculations, please refer to SeaDataNet for the quality flags: https://www.seadatanet.org/Products/Aggregated-datasets . Regional datasets concerning eutrophication and acidity are automatically harvested, and the resulting collections are aggregated and quality controlled using ODV Software and following a common methodology for all sea regions ( https://doi.org/10.13120/8xm0-5m67 ). Parameter names are based on P35 vocabulary, which relates to EMODnet Chemistry aggregated parameter names and is available at: https://vocab.nerc.ac.uk/search_nvs/P35/ . When not present in original data, water body nitrate plus nitrite was calculated by summing all nitrate and nitrite parameters. The same procedure was applied for water body dissolved inorganic nitrogen (DIN), which was calculated by summing all nitrate, nitrite, and ammonium parameters. Concentrations per unit mass were converted to a unit volume using a constant density of 1.025 kg/L. The aggregated dataset can also be downloaded as an ODV collection and spreadsheet, which is composed of a metadata header followed by tab separated values. This spreadsheet can be imported to ODV Software for visualisation (more information can be found at: https://www.seadatanet.org/Software/ODV ).
-
'''This product has been archived''' For operationnal and online products, please visit https://marine.copernicus.eu '''Short description''' The Operational Mercator global ocean analysis and forecast system at 1/12 degree is providing 10 days of 3D global ocean forecasts updated daily. The time series is aggregated in time in order to reach a two full year’s time series sliding window. This product includes daily and monthly mean files of temperature, salinity, currents, sea level, mixed layer depth and ice parameters from the top to the bottom over the global ocean. It also includes hourly mean surface fields for sea level height, temperature and currents. The global ocean output files are displayed with a 1/12 degree horizontal resolution with regular longitude/latitude equirectangular projection. 50 vertical levels are ranging from 0 to 5500 meters. This product also delivers a special dataset for surface current which also includes wave and tidal drift called SMOC (Surface merged Ocean Current). '''DOI (product) :''' https://doi.org/10.48670/moi-00016
-

'''This product has been archived''' For operationnal and online products, please visit https://marine.copernicus.eu '''Short description:''' For the Global Ocean- In-situ observation delivered in delayed mode. This In Situ delayed mode product integrates the best available version of in situ oxygen, chlorophyll / fluorescence and nutrients data '''DOI (product) :''' https://doi.org/10.17882/86207