 Catalogue PIGMA
Pressure
Type of resources
Available actions
Topics
Keywords
Contact for the resource
Provided by
Years
Formats
Representation types
Resolution
-
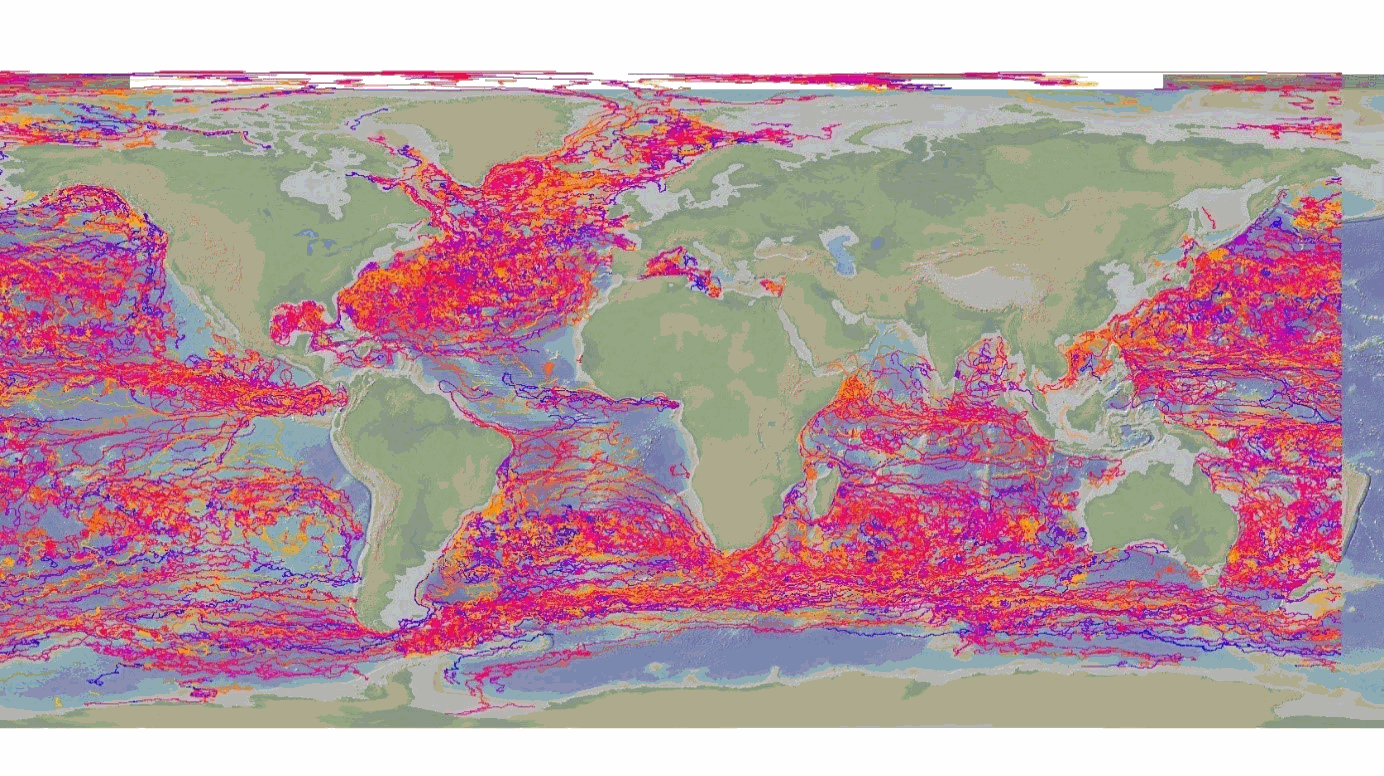
The DBCP – Data Buoy Cooperation Panel - is an international program coordinating the use of autonomous data buoys to observe atmospheric and oceanographic conditions, over ocean areas where few other measurements are taken. DBCP coordinates the global array of 1 600 active drifting buoys (August 2020) and historical observation from 14 000 drifting buoys. Data and metadata collected by drifting buoys are publically available in near real-time via the Global Data Assembly Centers (GDACs) in Coriolis-Ifremer (France) and MEDS (Canada) after an automated quality control (QC). In long term, scientifically quality controlled delayed mode data will be distributed on the GDACs. Disclaimer: the DB-GDAC is under construction. It is currently (January 2020) aggregating data from the Coriolis DAC (E-Surfmar, Canada). Additional DACs are considered. An interim provision from GTS real-time data to GDAC may be provided from Coriolis DAC.
-

This dataset provides global surface winds and pressure fields on a 0.25° resolution horizontal grid with hourly frequency, based on the global ERA5 reanalysis but with enhanced realistic TCs, built from a parametric wind formulation fitted to SAR high-resolution observations. TC wind structures in ERA5 are indeed known to be strongly biased. The methodology, developed in Herry et al. (2025) and applied here, is to replace ERA5 underestimated winds in TCs by the parametric wind formulation of Wood et al. (2013) with optimized parameters (fitted to SAR data), while keeping ERA5 wind field elsewhere. The wind profile and the transition area between the parametric and ERA5 winds are adjusted for each TC, according to its intensity and size. This blended product manages to represent a variety of realistic TC structures, and ensure an asymmetry associated to the synoptic flow for each case.
-
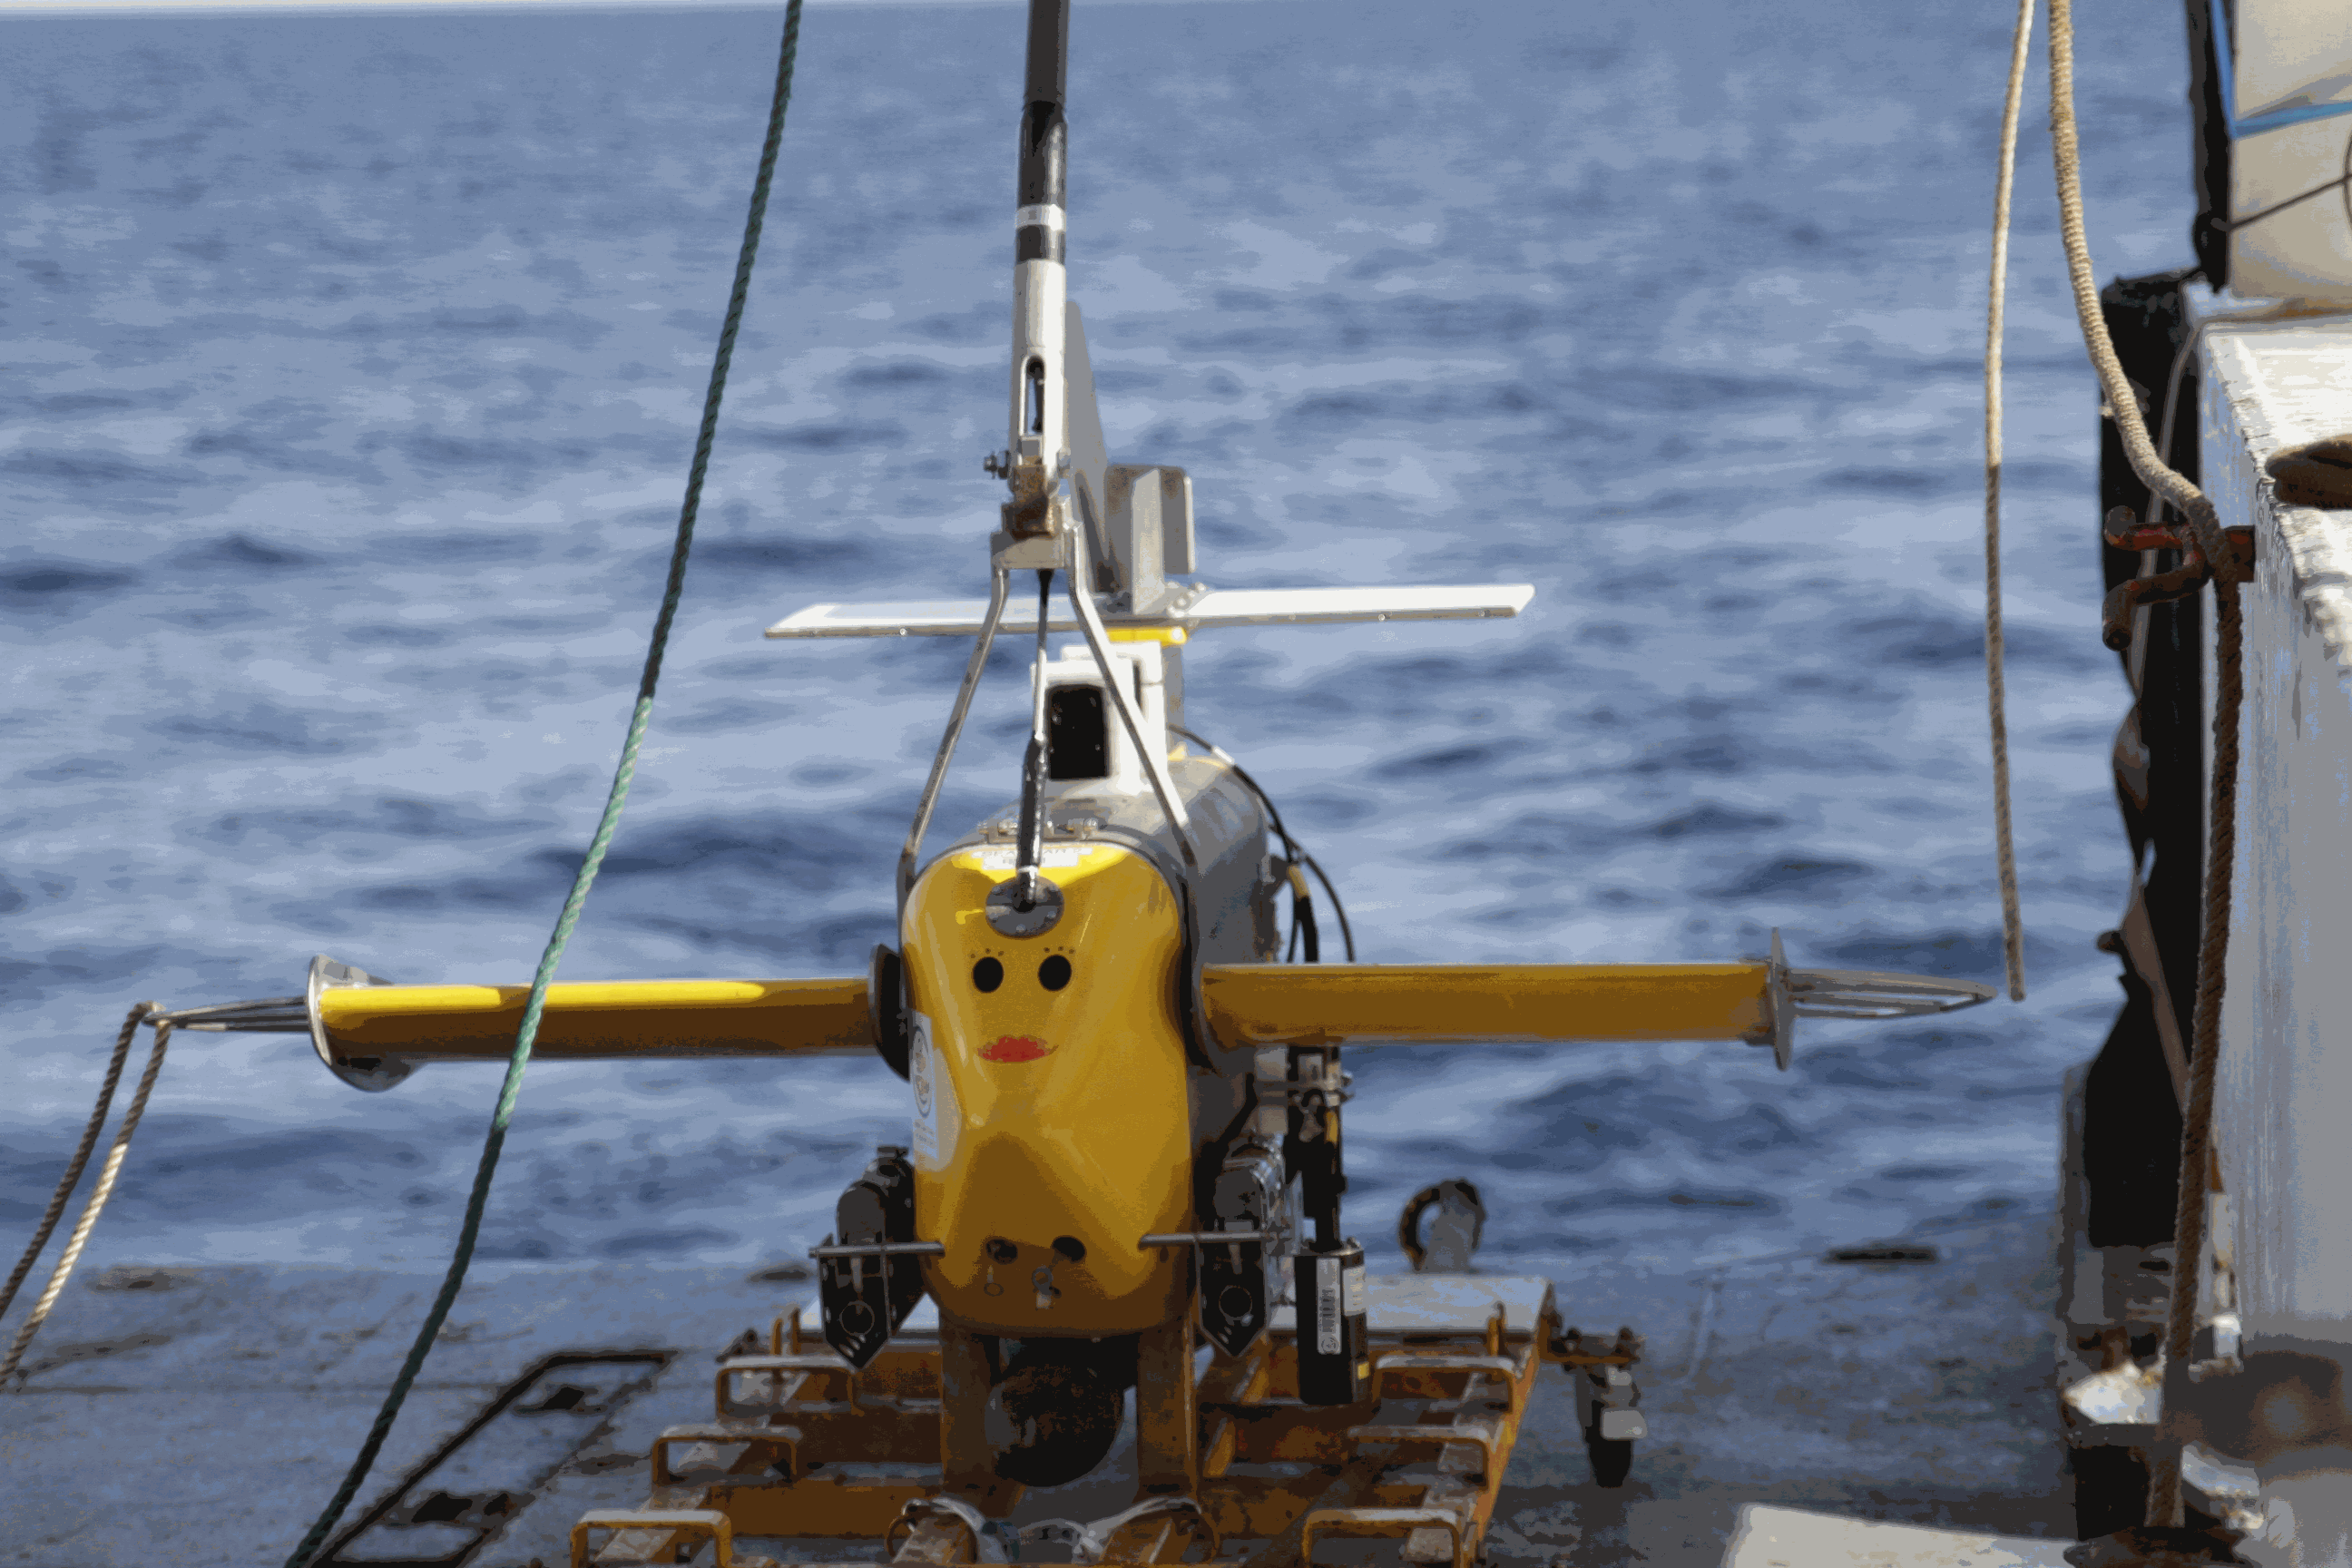
From 2015 to 2018 five field experiments (9 legs) have been performed in the Western Mediterranean Basin during winter or early spring. Thanks to the intensive use of a towed vehicle undulating in the upper oceanic layer between 0 and 400 meter depth (i.e. a Seasoar), a large amount of very high resolution hydrographic transects have been performed, to measure the mesoscale dynamics (slope current and its instabilities, anticyclonic eddies, sub-mesoscale coherent vortices, frontal dynamics convection events, strait outflows) and sub-mesoscale processes like stirring, mixed layer or symmetric instabilities. When available, the data were completed with velocities recorded by Vessel Mounted Acoustic Doppler Current Profiler (VMADCP) and by surface salinity and temperature recorded by ThermosalinoGraph (TSG). Some CTD casts have also been performed giving the background hydrography of the deep layers. In 2017, a Moving Vessel Profiler (MVP) has been deployed to manage even higher horizontal resolution. This data set is an unprecedented opportunity to investigate the very fine scale processes as the Mediterranean Sea is known for its intense and contrasted dynamics. It should be useful for modellers (who reduce the grid size below a few hundred meters) and expect to properly catch finer scale dynamics. Likewise, theoretical work could also be illustrated by in situ evidence embedded in this data set.
-
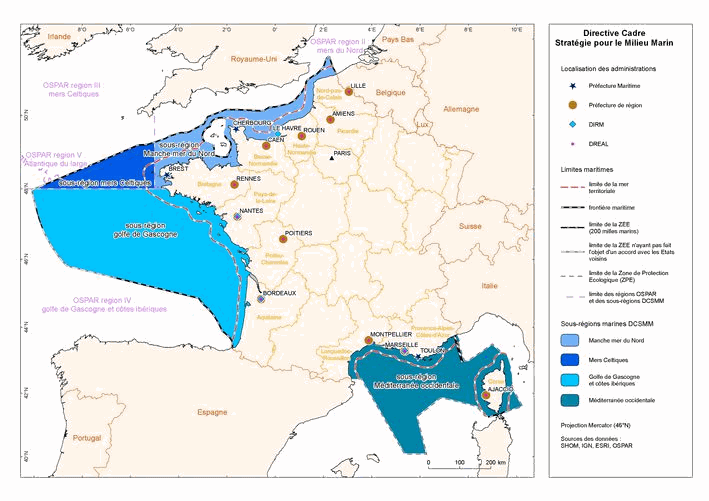
This dataset is an aggregation of all availale in situ data from Coriolis and Copernicus in situ data centres, observed in the French DCSMM area. It contains 5167 NetCDF CF files from 1903 to 2017. Each file contains the observations of a specific platform (e.g. vessel, mooring site, sea level station). Observed parameters are temperature, salinity, pressure, oxygen, nitrate, chlorophyll (and other bio-geo-chemicals), current, wave, sea level, river flow.
-
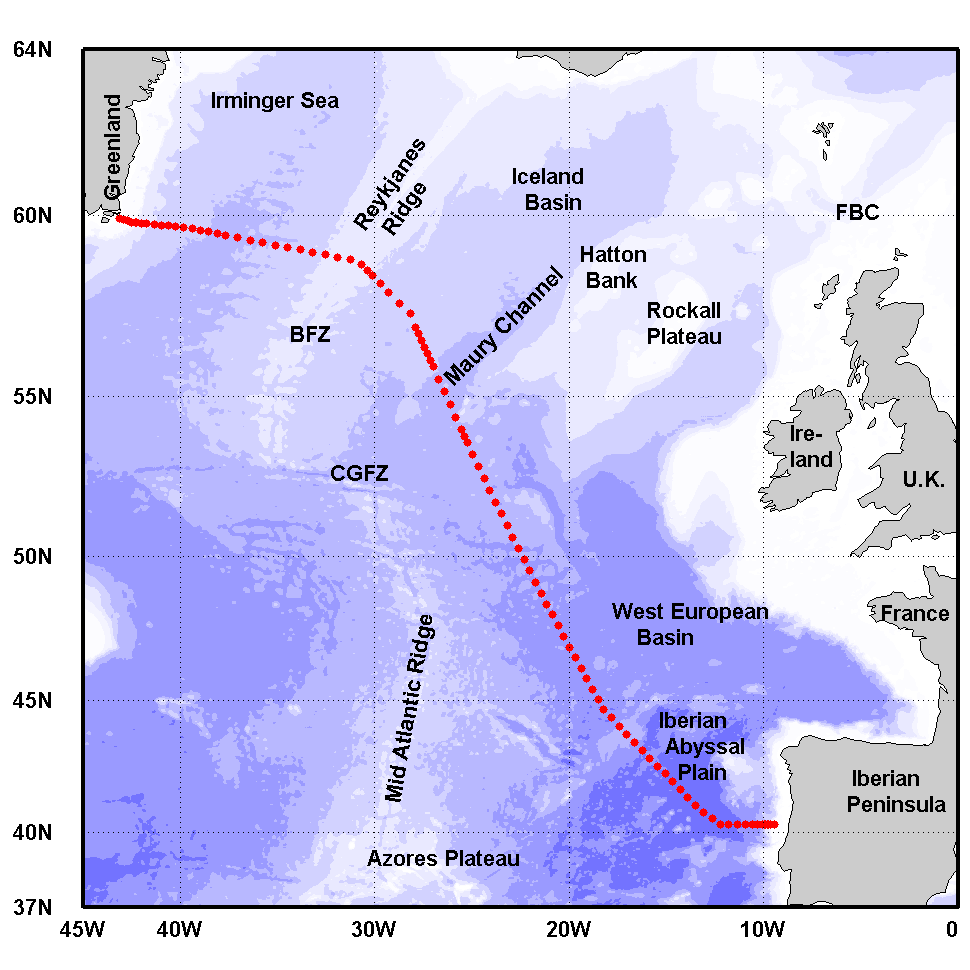
The Greenland-Portugal A25 OVIDE line is carried out biennially since 2002. The section is composed of 98 stations where hydrographic, biogeochemical and current measurements are carried out down to the bottom. OVIDE is a contribution to the international programs Go-Ship, IOCCP, and CLIVAR. This data set contains the final (adjusted) CTDO2 data.
-
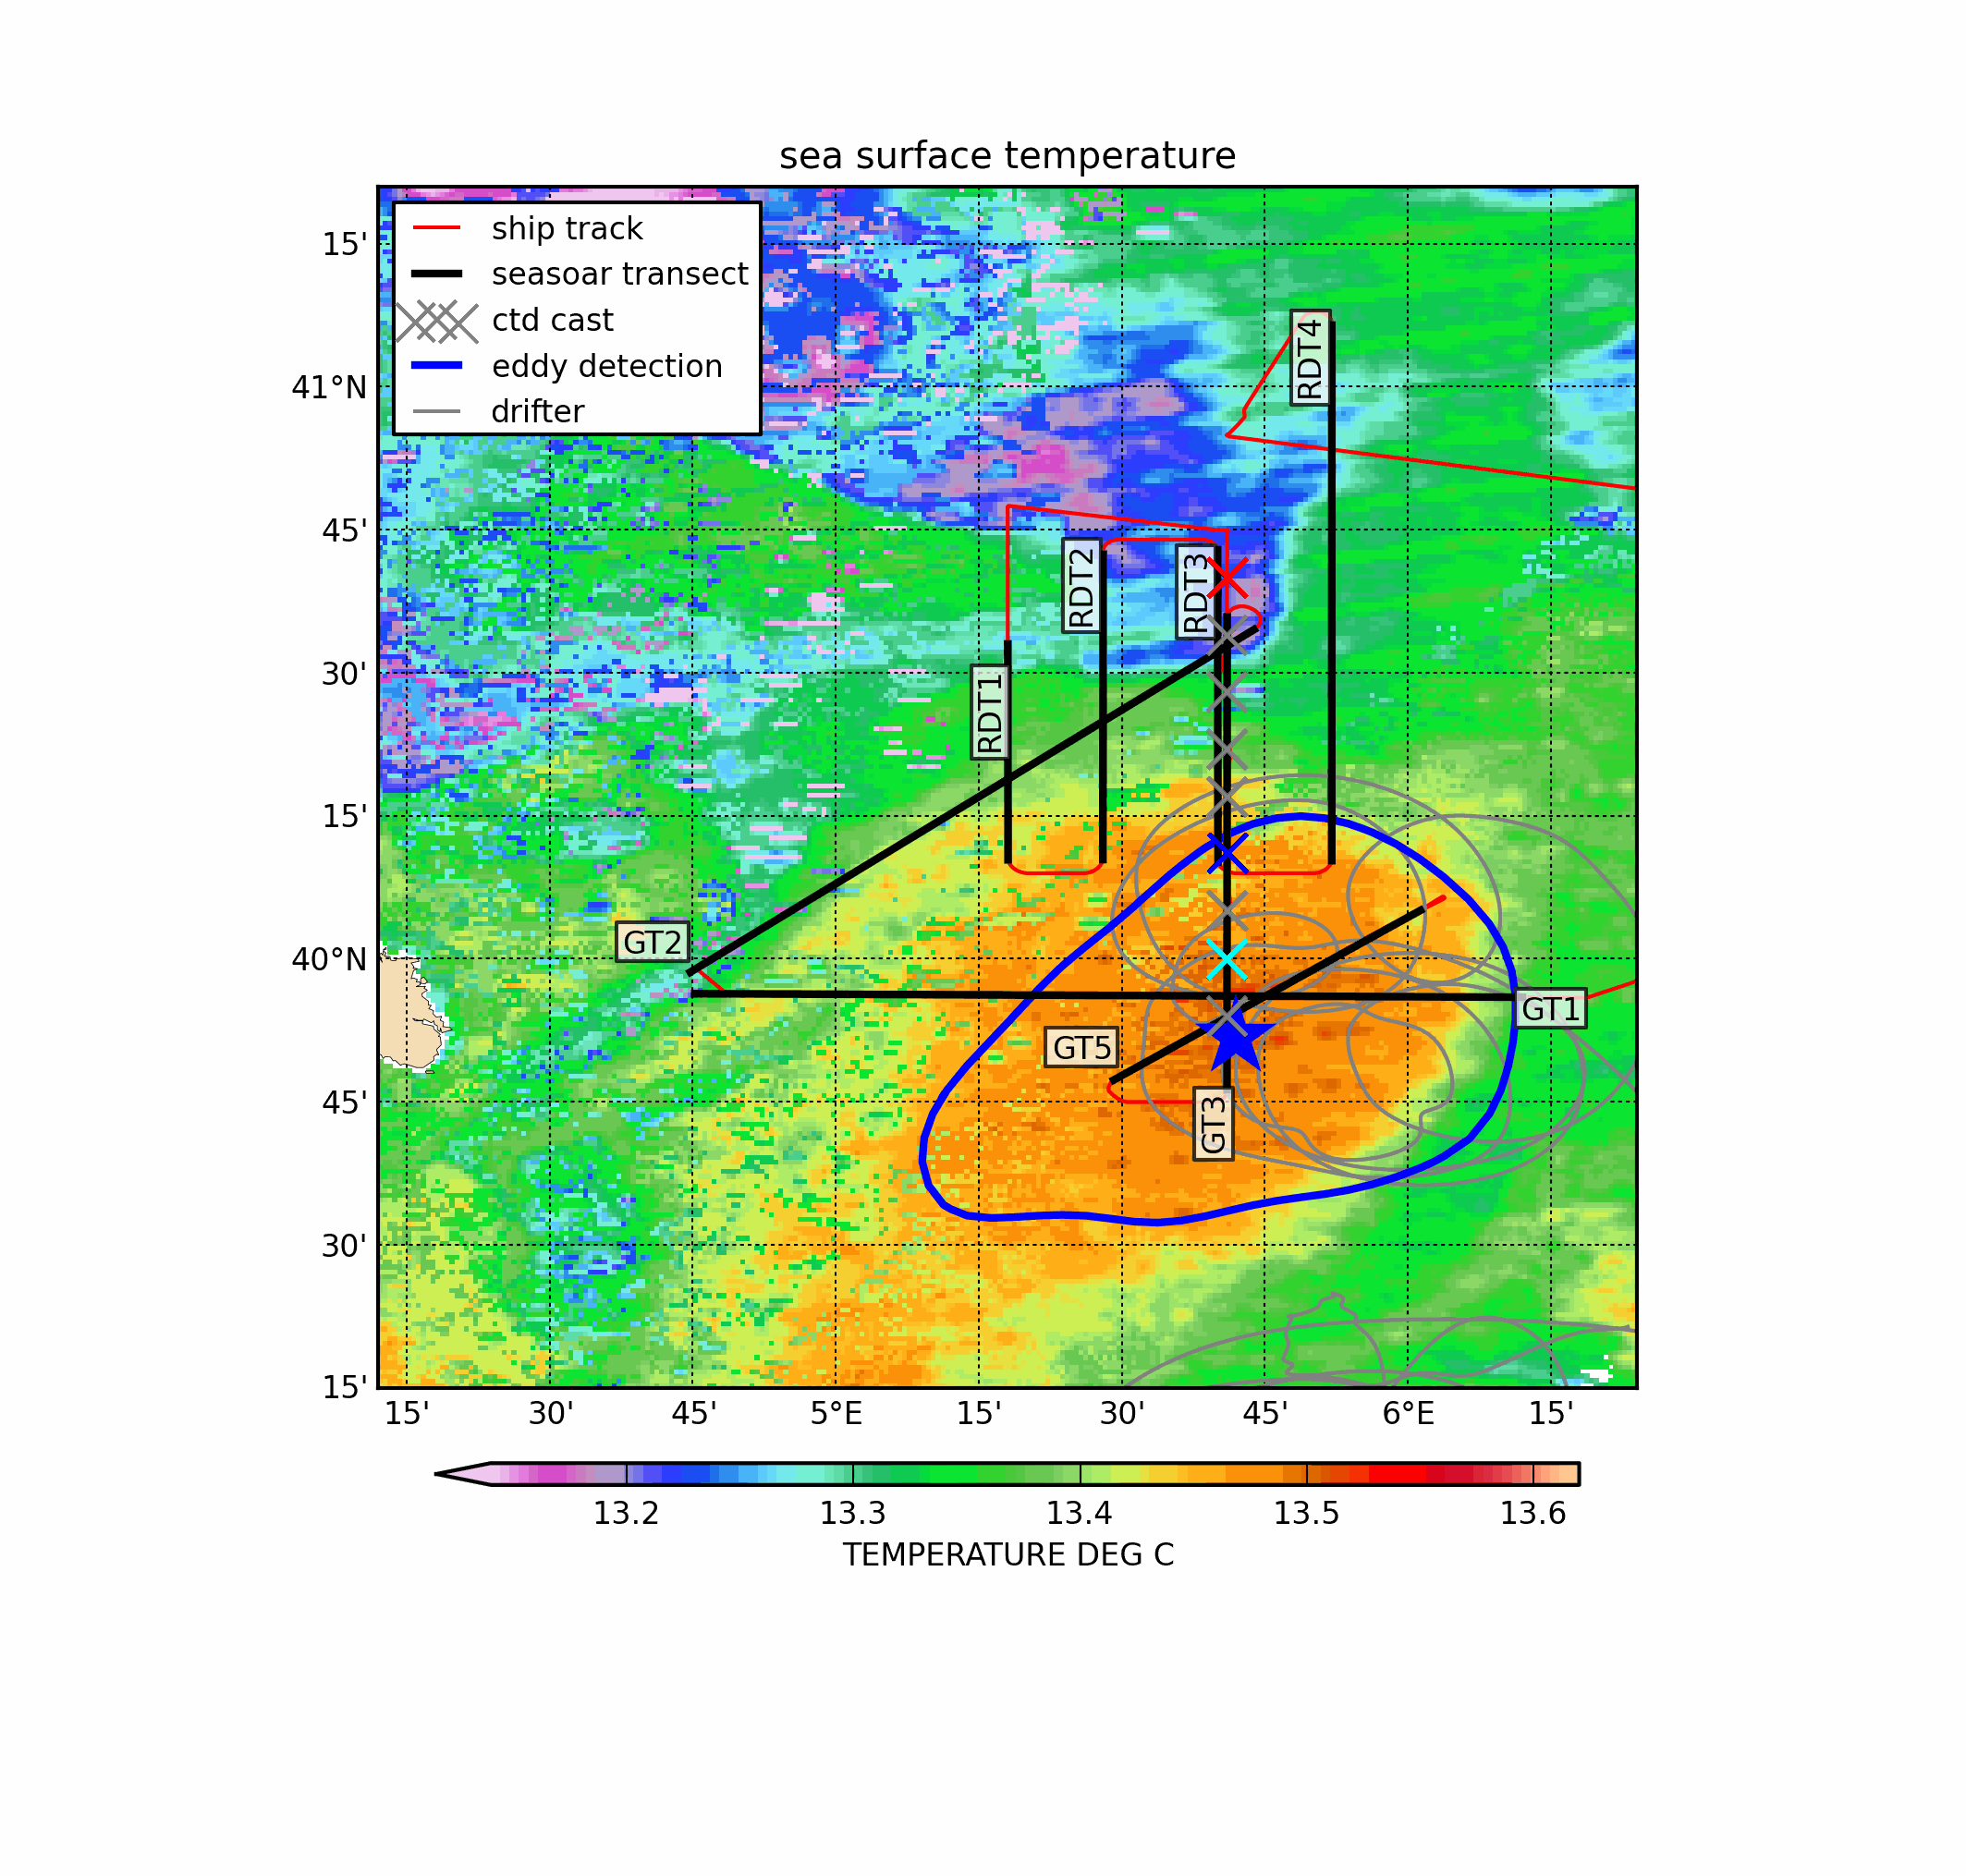
Mesoscale dynamics in the Mediterranean Sea have been investigated for years and anticyclonic eddies are regularly observed features in the Algerian Basin. In early spring 2016, a field experiment during the ProtevsMed 2016 cruise thoroughly investigated this specific eddy, when it was located near the North Balearic Front, taking high-resolution (Seasoar) hydrological transects, several CTD casts and LADCP measurements. In addition, four drifting buoys were released in the eddy core. These in situ measurements revealed that the vertical structure of this anticyclone was made of two water lenses of very different origins (Atlantic Water above and Western Intermediate Water below) spinning together. In the vicinity of the North Balearic Front, which may act as a dynamical barrier for structures, the eddy interacted with a subsurface anticyclonic eddy made of modal water, which fostered cross-front exchanges generating filaments by stirring. The high-resolution sampling revealed fine scales structures both adjacent to the eddy and within its core. The eddy has been targeted from 21 March to 1 April 2016 taking advantage of a meteorological window. It has been sampled with: - a towed undulating vehicle, the SeaSoar designed and built by Chelsea Instruments; it gets mounted on its sides two Sea-bird SBE-9 (SBE 3 temperature and SBE 4 conductivity sensors) and a Wetlabs Fluorometer of type ChloroA WetStar - CTD casts performed with a Sea-bird SBE-9 (SBE 3 temperature and SBE 4 conductivity sensor) and an RDI 150 kHz current profiler mounted in a general oceanics 12-place rosette, with12l Niskin bottles - drifters with holey-sock positioned at 50 m deep below the expected Ekman layer thickness (remaining in the eddy until mid May).
-
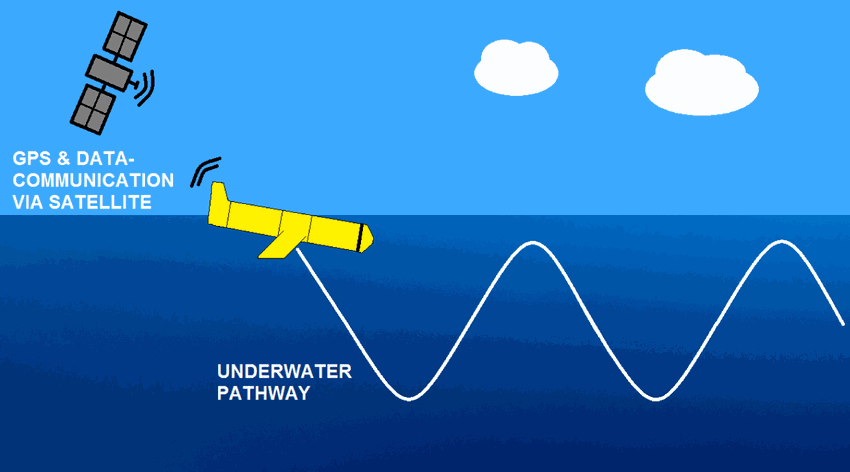
The observations of campe glider on imedia deployment (Mediterranean Sea - Western basin) are distributed in 4 files: - EGO NetCDF time-series (data, metadata, derived sea water current) - NetCDF profiles extracted from the above time-series - Raw data - JSON metadata used by the decoder The following parameters are provided : - Practical salinity - Sea temperature in-situ ITS-90 scale - Electrical conductivity - Sea water pressure, equals 0 at sea-level
-
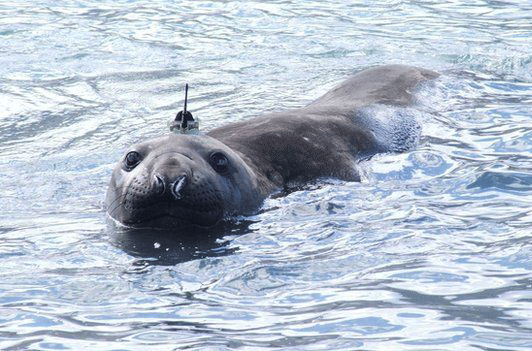
The Southern Ocean plays a fundamental role in regulating the global climate. This ocean also contains a rich and highly productive ecosystem, potentially vulnerable to climate change. Very large national and international efforts are directed towards the modeling of physical oceanographic processes to predict the response of the Southern Ocean to global climate change and the role played by the large-scale ocean climate processes. However, these modeling efforts are greatly limited by the lack of in situ measurements, especially at high latitudes and during winter months. The standard data that are needed to study ocean circulation are vertical profiles of temperature and salinity, from which we can deduce the density of seawater. These are collected with CTD (Conductivity-Temperature-Depth) sensors that are usually deployed on research vessels or, more recently, on autonomous Argo profilers. The use of conventional research vessels to collect these data is very expensive, and does not guarantee access to areas where sea ice is found at the surface of the ocean during the winter months. A recent alternative is the use of autonomous Argo floats. However, this technology is not easy to use in glaciated areas. In this context, the collection of hydrographic profiles from CTDs mounted on marine mammals is very advantageous. The choice of species, gender or age can be done to selectively obtain data in particularly under-sampled areas such as under the sea ice or on continental shelves. Among marine mammals, elephant seals are particularly interesting. Indeed, they have the particularity to continuously dive to great depths (590 ± 200 m, with maxima around 2000 m) for long durations (average length of a dive 25 ± 15 min, maximum 80 min). A Conductivity-Temperature-Depth Satellite Relay Data Logger (CTD-SRDLs) has been developed in the early 2000s to sample temperature and salinity vertical profiles during marine mammal dives (Boehme et al. 2009, Fedak 2013). The CTD-SRDL is attached to the seal on land, then it records hydrographic profiles during its foraging trips, sending the data by satellite ARGOS whenever the seal goes back to the surface.While the principle intent of seal instrumentation was to improve understanding of seal foraging strategies (Biuw et al., 2007), it has also provided as a by-product a viable and cost-effective method of sampling hydrographic properties in many regions of the Southern Ocean (Charrassin et al., 2008; Roquet et al., 2013).
-

As part of the marine water quality monitoring of the “Pertuis” and the “baie de l’Aiguillon” (France), commissioned by the OFB and carried out by setec énergie environnement, three monitoring stations were installed. Two of them were set up at the mouths of the Charente and Seudre rivers on February 6 and 27, 2019, respectively, while a third was deployed in the Bay of Aiguillon on March 24, 2021. The dataset presented here concerns the station installed in the Bay of Aiguillon. Measurements are organized into .csv files, with one file per year. Data is collected using a WiMO multiparameter probe, which records the following parameters: • Temperature (-2 to 35 °C) • Conductivity (0 to 100 mS/cm) • Pressure (0 to 30 m) • Turbidity (0 to 4000 NTU) • Dissolved Oxygen (0 to 23 mg/L & 0 to 250 %) • Fluorescence (0 to 500 ppb)
-

As part of the marine water quality monitoring of the “Pertuis” and the “baie de l’Aiguillon” (France), commissioned by the OFB and carried out by setec énergie environnement, three monitoring stations were installed. Two of them were set up at the mouths of the Charente and Seudre rivers on February 6 and 27, 2019, respectively, while a third was deployed in the Bay of Aiguillon on March 24, 2021. The dataset presented here concerns the station installed in the Charente estuary. Measurements are organized into .csv files, with one file per year. Data is collected using a SAMBAT multiparameter probe, which records the following parameters: - Temperature (-5 to 35 °C) - Conductivity (0 to 10 mS/cm) - Pressure (0 to 10 m) - Turbidity (0 to 300 NTU) - Dissolved Oxygen (0 to 20 mg/L & 0 to 200 %) - Fluorescence (0 to 50 µg/l) - PH (0/14)