 Catalogue PIGMA
2021
Type of resources
Available actions
Topics
Keywords
Contact for the resource
Provided by
Years
Formats
Representation types
Update frequencies
status
Scale
Resolution
-
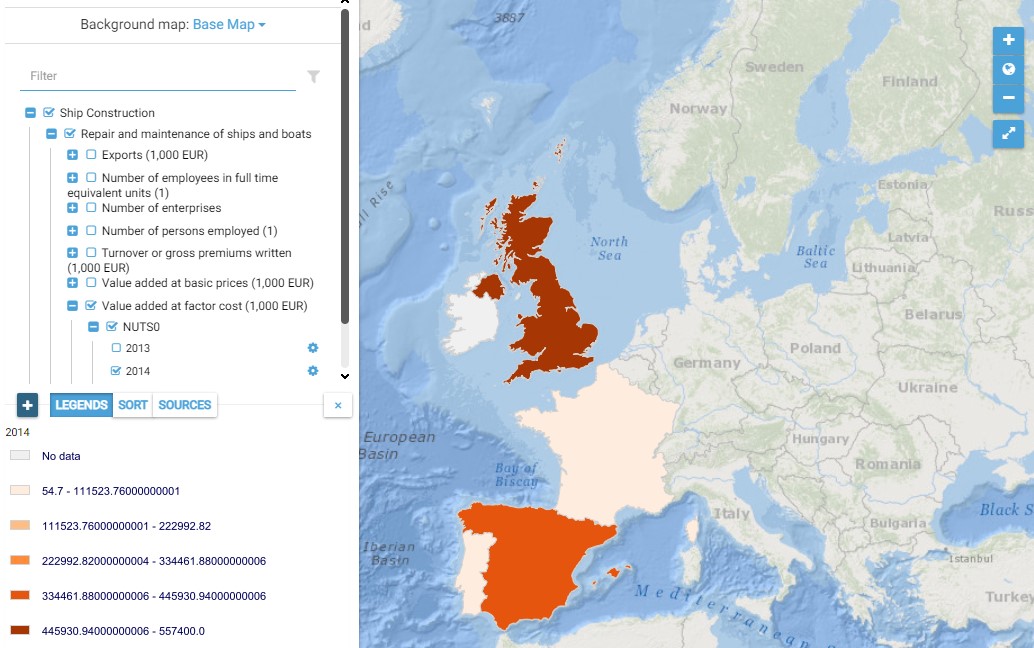
This map presents all layers corresponding to "Repair and maintenance of ships and boats" activities in the Atlantic area. For more information about this NACE code : https://ec.europa.eu/eurostat/ramon/nomenclatures/index.cfm?TargetUrl=DSP_NOM_DTL_VIEW&StrNom=NACE_REV2&StrLanguageCode=EN&IntPcKey=18496334&IntKey=18506474&StrLayoutCode=HIERARCHIC&IntCurrentPage=1 Indicators collected are : Business indicators per country Number of persons employed and number of employees in full time equivalent units per NUTS 3 unit of the Atlantic Area
-
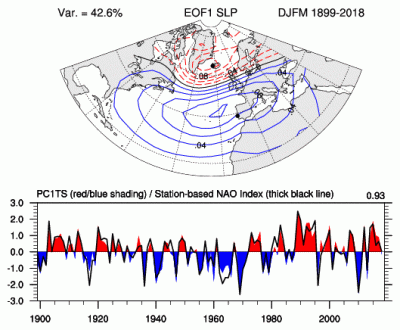
The principal component (PC)-based indices of the North Atlantic Oscillation (NAO) are the time series of the leading Empirical Orthogonal Function (EOF) of SLP anomalies over the Atlantic sector, 20°-80°N, 90°W-40°E. These indices are used to measure the NAO throughout the year, tracking the seasonal movements of the Icelandic low and Azores high. These movements are illustrated in the Figures on this page. Positive values of the NAO index are typically associated with stronger-than-average westerlies over the middle latitudes, more intense weather systems over the North Atlantic and wetter/milder weather over western Europe.
-
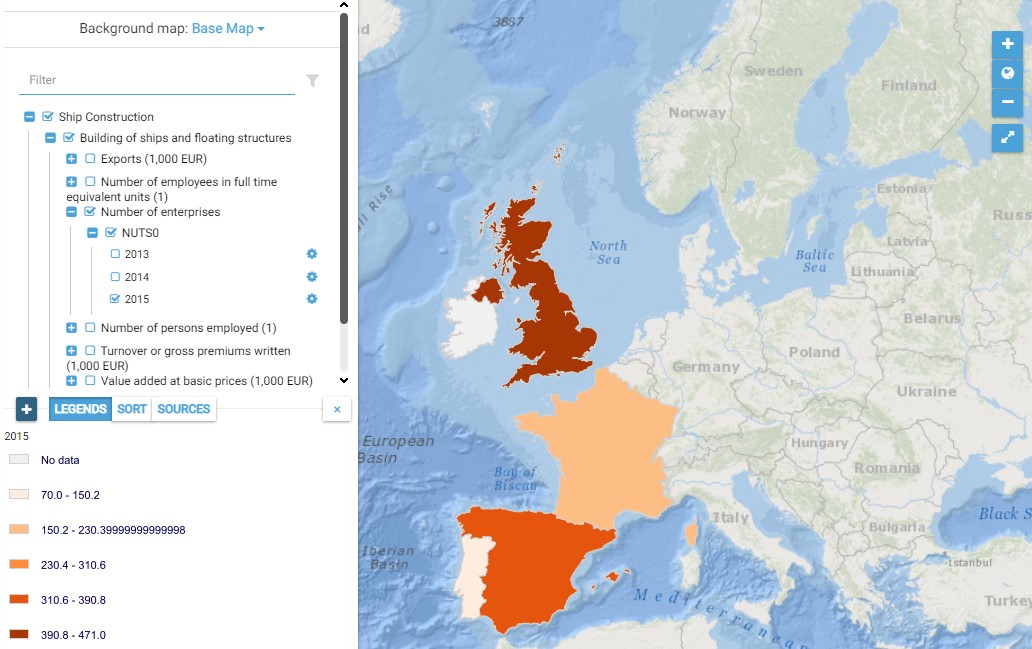
This map presents all layers corresponding to "Building of ships and floating structures" activities in the Atlantic area. For more information about this NACE code : https://ec.europa.eu/eurostat/ramon/nomenclatures/index.cfm?TargetUrl=DSP_NOM_DTL_VIEW&StrNom=NACE_REV2&StrLanguageCode=EN&IntPcKey=18505424&IntKey=18505454&StrLayoutCode=HIERARCHIC&IntCurrentPage=1 Indicators collected are : Business indicators per country Number of persons employed and number of employees in full time equivalent units per NUTS 3 unit of the Atlantic Area
-
This map presents all layers corresponding to "Cargo handling" activities in the Atlantic area. For more information about this NACE code : https://ec.europa.eu/eurostat/ramon/nomenclatures/index.cfm?TargetUrl=DSP_NOM_DTL_VIEW&StrNom=NACE_REV2&StrLanguageCode=EN&IntPcKey=18513344&IntKey=18513464&StrLayoutCode=HIERARCHIC&IntCurrentPage=1 Indicators collected are : Number of persons employed and number of employees in full time equivalent units per NUTS 3 unit of the Atlantic Area
-
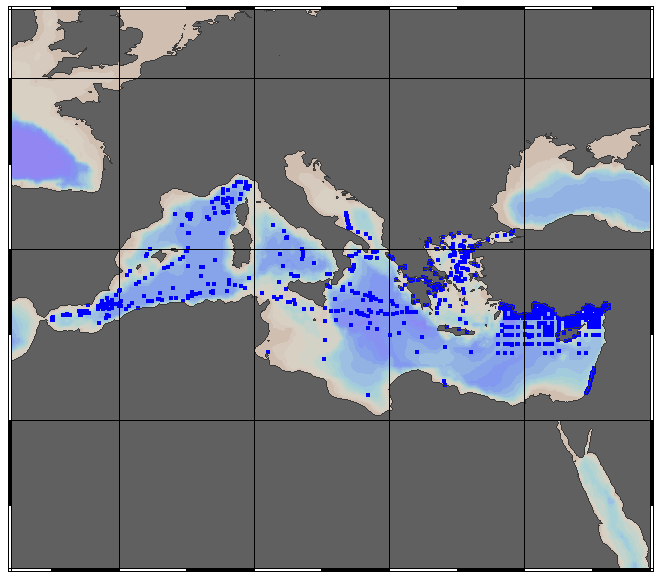
EMODnet Chemistry aims to provide access to marine chemistry data sets and derived data products concerning eutrophication, ocean acidification and contaminants. The chemicals chosen reflect importance to the Marine Strategy Framework Directive (MSFD). This regional aggregated dataset contains all unrestricted EMODnet Chemistry data on contaminants; temperature, salinity and additional sampling parameters are included when available. The spatial coverage is the Mediterranean Sea with 10917 CDI records divided per matrices: 3095 water profiles and 1385 water timeseries, 1511 sediment profiles and 4083 sediment timeseries, 42 biota profiles and 801 biota timeseries. In the water datasets, the vertical profiles temporal range is from 1974-09-12 to 2015-12-11 and the timeseries temporal range is from 2006-08-17 to 2018-04-26. In the sediment datasets, vertical profiles temporal range is from 1971-01-12 to 2016-04-07 and time series temporal range is from 1981-06-27 to 2018-12-14. For the biota datasets, vertical profiles temporal range is from 2008-05-05 to 2013-05-22 and time series temporal range is from 1979-03-29 to 2017-03-15. Data were harmonised and quality controlled by ‘Hellenic Centre for Marine Research, Hellenic National Oceanographic Data Centre (HCMR/HNODC)’ from Greece. Regional datasets concerning contaminants are automatically harvested. Parameter names in these datasets are based on P01, BODC Parameter Usage Vocabulary, which is available at: https://vocab.seadatanet.org/p01-facet-search. Each measurement value has a quality flag indicator. The resulting data collections for each Sea Basin are harmonised, and the collections are quality controlled by EMODnet Chemistry Regional Leaders using ODV Software and following a common methodology for all Sea Regions. Harmonisation means that: (1) unit conversion is carried out to express contaminant concentrations with a limited set of measurement units (according to EU directives 2013/39/UE; Comm. Dec. EU 2017/848) and (2) merging of variables described by different “local names” ,but corresponding exactly to the same concepts in BODC P01 vocabulary. Detailed documentation is available at: https://doi.org/10.6092/8b52e8d7-dc92-4305-9337-7634a5cae3f4 Explore and extract data at: https://emodnet-chemistry.webodv.awi.de/contaminants%3EMediterranean The harmonised dataset can also be downloaded as ODV spreadsheet (TXT file), which is composed of metadata header followed by tab separated values. This worksheet can be imported to ODV Software for visualisation (More information can be found at: https://www.seadatanet.org/Software/ODV ). The same dataset is offered also as TXT file in a long/vertical format, in which each P01 measurement is a record line. Additionally, there are a series of columns that split P01 terms in subcomponents (measure, substance, CAS number, matrix...).This transposed format is more adapted to worksheet applications users (e.g. LibreOffice Calc). The original datasets can be searched and downloaded from EMODnet Chemistry Chemistry CDI Data and Discovery Access Service: https://emodnet-chemistry.maris.nl/search
-

'''Short description:''' The High-Resolution Ocean Colour (HR-OC) Consortium (Brockmann Consult, Royal Belgian Institute of Natural Sciences, Flemish Institute for Technological Research) distributes Remote Sensing Reflectances (RRS, expressed in sr-1), Turbidity (TUR, expressed in FNU), Solid Particulate Matter Concentration (SPM, expressed in mg/l), spectral particulate backscattering (BBP, expressed in m-1) and chlorophyll-a concentration (CHL, expressed in µg/l) for the Sentinel 2/MSI sensor at 100m resolution for a 20km coastal zone. RRS and BBP are delivered at nominal central bands of 443, 492, 560, 665, 704, 740, 783, 865 nm. The primary variable from which it is virtually possible to derive all the geophysical and transparency products is the spectral RRS. This, together with the spectral BBP, constitute the category of the 'optics' products. The spectral BBP product is generated from the RRS products using a quasi-analytical algorithm (Lee et al. 2002). The 'tur_tsm_chl' products include TUR, SPM and CHL). They are retrieved through the application of automated switching algorithms to the RRS spectra adapted to varying water conditions (Novoa et al. 2017). The GEOPHYSICAL product consists of the Chlorophyll-a concentration (CHL) retrieved via a multi-algorithm approach with optimized quality flagging (O'Reilly et al. 2019, Gons et al. 2005, Lavigne et al. 2021). The NRT products are generally provided withing 24 hours up to 3 days after end of the day. The RRS product is accompanied by a relative uncertainty estimate (unitless) derived by direct comparison of the products to corresponding fiducial reference measurements provided through the AERONET-OC network. '''Processing information:''' The HR-OC processing system is deployed on Creodias where Sentinel 2/MSI L1C data are available. The production control element is being hosted within the infrastructure of Brockmann Consult. The processing chain consists of: * Resampling to 60m and mosaic generation of the set of Sentinel-2 MSI L1C granules of a single overpass that cover a single UTM zone. * Application of a glint correction taking into account the detector viewing angles * Application of a coastal mask with 20km water + 20km land. The result is a L1C mosaic tile with data just in the coastal area optimized for compression. * Level 2 processing with pixel identification (IdePix), atmospheric correction (C2RCC and ACOLITE or iCOR), in-water processing and merging (HR-OC L2W processor). The result is a 60m product with the same extent as the L1C mosaic, with variables for optics, transparency, and geophysics, and with data filled in the water part of the coastal area. * invalid pixel identification takes into account corrupted (L1) pixels, clouds, cloud shadow, glint, dry-fallen intertidal flats, coastal mixed-pixels, sea ice, melting ice, floating vegetation, non-water objects, and bottom reflection. * Daily L3 aggregation merges all Level 2 mosaics of a day intersecting with a target tile. All valid water pixels are included in the 20km coastal stripes; all other values are set to NaN. There may be more than a single overpass a day, in particular in the northern regions. The main contribution usually is the mosaic of the zone, but also adjacent mosaics may overlap. This step comprises resampling to the 100m target grid. * Monthly L4 aggregation combines all Level 3 products of a month. The output is a set of 32 NetCDF datasets for (1) optics and (2) transparency, suspended matter and chlorophyll concentration respectively per month. * Gap filling combines all daily products of a period and generates (partially) gap-filled daily products again. The output of gap filling are 32 datasets for optics (BBP443 only), and (2) transparency, suspended matter and chlorophyll concentration and geophysics per day. '''Description of observation methods/instruments:''' Ocean colour technique exploits the emerging electromagnetic radiation from the sea surface in different wavelengths. The spectral variability of this signal defines the so-called ocean colour which is affected by the presence of phytoplankton. '''Quality / Accuracy / Calibration information:''' A detailed description of the calibration and validation activities performed over this product can be found on the CMEMS web portal and in CMEMS-BGP_HR-QUID-009-201to212. '''Suitability, Expected type of users / uses:''' This product is meant for use for educational purposes and for the managing of the marine safety, marine resources, marine and coastal environment and for climate and seasonal studies. '''Dataset names: ''' *cmems_obs_oc_med_bgc_tur-spm-chl_nrt_l3-hr-mosaic_P1D-m *cmems_obs_oc_med_bgc_optics_nrt_l3-hr-mosaic_P1D-v01 '''Files format:''' *netCDF-4, CF-1.7 *INSPIRE compliant." '''DOI (product) :''' https://doi.org/10.48670/moi-00109
-

'''Short description:''' The Reprocessed (REP) Mediterranean (MED) dataset provides a stable and consistent long-term Sea Surface Temperature (SST) time series over the Mediterranean Sea (and the adjacent North Atlantic box) developed for climate applications. This product consists of daily (nighttime), merged multi-sensor (L3S), satellite-based estimates of the foundation SST (namely, the temperature free, or nearly-free, of any diurnal cycle) at 0.05° resolution grid covering the period from 1st January 1981 to present (approximately one month before real time). The MED-REP-L3S product is built from a consistent reprocessing of the collated level-3 (merged single-sensor, L3C) climate data record (CDR) v.3.0, provided by the ESA Climate Change Initiative (CCI) and covering the period up to 2021, and its interim extension (ICDR) that allows the regular temporal extension for 2022 onwards. '''DOI (product) :''' https://doi.org/10.48670/moi-00314
-
This visualization product displays fishing related items density per trawl. EMODnet Chemistry included the collection of marine litter in its 3rd phase. Since the beginning of 2018, data of seafloor litter collected by international fish-trawl surveys have been gathered and processed in the EMODnet Chemistry Marine Litter Database (MLDB). The harmonization of all the data has been the most challenging task considering the heterogeneity of the data sources, sampling protocols (OSPAR and MEDITS protocols) and reference lists used on a European scale. Moreover, within the same protocol, different gear types are deployed during fishing bottom trawl surveys. In cases where the wingspread and/or the number of items were unknown, data could not be used because these fields are needed to calculate the density. Data collected before 2011 are affected by this filter. When the distance reported in the data was null, it was calculated from: - the ground speed and the haul duration using this formula: Distance (km) = Haul duration (h) * Ground speed (km/h); - the trawl coordinates if the ground speed and the haul duration were not filled in. The swept area is calculated from the wingspread (which depends on the fishing gear type) and the distance trawled: Swept area (km²) = Distance (km) * Wingspread (km) Densities have been calculated on each trawl using the following computation: Density of fishing related items (number of items per km²) = ∑Number of fishing related items / Swept area (km²) Percentiles 50, 75, 95 & 99 have been calculated taking into account data for all years. The list of selected items for this product is attached to this metadata. Information on data processing and calculation is detailed in the attached methodology document. Warning: the absence of data on the map doesn't necessarily mean that they don't exist, but that no information has been entered in the Marine Litter Database for this area.
-
NOAA STAR produces two lines of gridded 0.02deg super-collated L3S LEO datasets from Low Earth Orbiting (LEO) satellites, one from the NOAA afternoon JPSS (L3S_LEO_PM) and the other from the EUMETSAT mid-morning Metop-FG (L3S_LEO_AM). The L3S_LEO_PM is derived from JPSS satellites (in v2.80, NPP and N20) with VIIRS sensor onboard (0.75km/nadir). The L3S_LEO_PM dataset is produced by aggregating L3U datasets from two JPSS satellites ( https://doi.org/10.5067/GHVRS-3UO28 and https://doi.org/10.5067/GHV20-3UO28 ) and covers from Feb 2012-present. The L3S-LEO-PM data are reported in two files per 24hr interval, one daytime and one nighttime (nominal JPSS local equator crossing times around 01:30/13:30). Data is in NetCDF4 format, compliant with the GHRSST Data Specification version 2 (GDS2). The Near-Real Time (NRT) L3S-LEO data are archived at PO.DAAC with approximately 6 hours latency and then replaced by the Delayed Mode files about 2 months later, with identical file names. In addition to SST, the L3S-LEO files report the location and intensity of thermal fronts. The NRT/DM data are seamlessly stitched with the full-mission Reanalysis (RAN). The ACSPO L3S products are monitored and validated against in situ data in the NOAA iQuam system ( https://www.star.nesdis.noaa.gov/socd/sst/iquam ) in the NOAA SQUAM system ( https://www.star.nesdis.noaa.gov/socd/sst/squam ). Quality of SST imagery, clear-sky mask and thermal fronts is evaluated in the NOAA ARMS system ( https://www.star.nesdis.noaa.gov/socd/sst/arms ). NOAA plans to include data from other afternoon platforms and sensors, such as N21 and Aqua MODIS, into the future releases of the L3S_LEO_PM.
-

"'Short description:''' The High-Resolution Ocean Colour (HR-OC) Consortium (Brockmann Consult, Royal Belgian Institute of Natural Sciences, Flemish Institute for Technological Research) distributes Level 4 (L4) Turbidity (TUR, expressed in FNU), Solid Particulate Matter Concentration (SPM, expressed in mg/l), particulate backscattering at 443nm (BBP443, expressed in m-1) and chlorophyll-a concentration (CHL, expressed in µg/l) for the Sentinel 2/MSI sensor at 100m resolution for a 20km coastal zone. The products are delivered on a geographic lat-lon grid (EPSG:4326). BBP443, constitute the category of the 'optics' products. The BBP443 product is generated from the L3 RRS products using a quasi-analytical algorithm (Lee et al. 2002). he 'tur_tsm_chl' products include TUR, SPM and CHL. They are retrieved through the application of automated switching algorithms to the RRS spectra adapted to varying water conditions (Novoa et al. 2017). The GEOPHYSICAL product consists of the Chlorophyll-a concentration (CHL) retrieved via a multi-algorithm approach with optimized quality flagging (O'Reilly et al. 2019, Gons et al. 2005, Lavigne et al. 2021). Monthly products (P1M) are temporal aggregates of the daily L3 products. Daily products contain gaps in cloudy areas and where there is no overpass at the respective day. Aggregation collects the non-cloudy (and non-frozen) contributions to each pixel. Contributions are averaged per variable. While this does not guarantee data availability in all pixels in case of persistent clouds, it provides a more complete product compared to the sparsely filled daily products. The Monthly L4 products (P1M) are generally provided withing 4 days after the last acquisition date of the month. Daily gap filled L4 products (P1D) are generated using the DINEOF (Data Interpolating Empirical Orthogonal Functions) approach which reconstructs missing data in geophysical datasets by using a truncated Empirical Orthogonal Functions (EOF) basis in an iterative approach. DINEOF reconstructs missing data in a geophysical dataset by extracting the main patterns of temporal and spatial variability from the data. While originally designed for low resolution data products, recent research has resulted in the optimization of DINEOF to handle high resolution data provided by Sentinel-2 MSI, including cloud shadow detection (Alvera-Azcárate et al., 2021). These types of L4 products are generated and delivered one month after the respective period. '''Processing information:''' The HR-OC processing system is deployed on Creodias where Sentinel 2/MSI L1C data are available. The production control element is being hosted within the infrastructure of Brockmann Consult. The processing chain consists of: * Resampling to 60m and mosaic generation of the set of Sentinel-2 MSI L1C granules of a single overpass that cover a single UTM zone. * Application of a glint correction taking into account the detector viewing angles * Application of a coastal mask with 20km water + 20km land. The result is a L1C mosaic tile with data just in the coastal area optimized for compression. * Level 2 processing with pixel identification (IdePix), atmospheric correction (C2RCC and ACOLITE or iCOR), in-water processing and merging (HR-OC L2W processor). The result is a 60m product with the same extent as the L1C mosaic, with variables for optics, transparency, and geophysics, and with data filled in the water part of the coastal area. * invalid pixel identification takes into account corrupted (L1) pixels, clouds, cloud shadow, glint, dry-fallen intertidal flats, coastal mixed-pixels, sea ice, melting ice, floating vegetation, non-water objects, and bottom reflection. * Daily L3 aggregation merges all Level 2 mosaics of a day intersecting with a target tile. All valid water pixels are included in the 20km coastal stripes; all other values are set to NaN. There may be more than a single overpass a day, in particular in the northern regions. This step comprises resampling to the 100m target grid. * Monthly L4 aggregation combines all Level 3 products of a month and a single tile. The output is a set of 3 NetCDF datasets for (1) optics and (2) turbidity, suspended matter and chlorophyll concentration, respectively for the month. * Gap filling combines all daily products of a period and generates (partially) gap-filled daily products again. The output of gap filling are 2 datasets for (1) optics (BBP443 only) and (2) turbidity, suspended mattr and chlorophyll concentration per day. '''Description of observation methods/instruments:''' Ocean colour technique exploits the emerging electromagnetic radiation from the sea surface in different wavelengths. The spectral variability of this signal defines the so-called ocean colour which is affected by the presence of phytoplankton. '''Quality / Accuracy / Calibration information:''' A detailed description of the calibration and validation activities performed over this product can be found on the CMEMS web portal and in CMEMS-BGP_HR-QUID-009-201_to_212. '''Suitability, Expected type of users / uses:''' This product is meant for use for educational purposes and for the managing of the marine safety, marine resources, marine and coastal environment and for climate and seasonal studies. '''Dataset names: ''' *cmems_obs_oc_med_bgc_tur_spm_chl_nrt_l4-hr-mosaic_P1M-v01 *cmems_obs_oc_med_bgc_optics_nrt_l4-hr-mosaic_P1M-v01 *cmems_obs_oc_med_bgc_tur_spm_chl_nrt_l4-hr-mosaic_P1D-v01 *cmems_obs_oc_med_bgc_optics_nrt_l4-hr-mosaic_P1D-v01 '''Files format:''' *netCDF-4, CF-1.7 *INSPIRE compliant." '''DOI (product) :''' https://doi.org/10.48670/moi-00110