 Catalogue PIGMA
2026
Type of resources
Available actions
Topics
Keywords
Contact for the resource
Provided by
Years
Formats
Representation types
Update frequencies
status
Service types
Scale
Resolution
-

The BioSWOT-Med campaign (Doglioli et al., 2023) was conducted aboard R/V L’Atalante from April 20 to May 15, 2023 in the Northwestern Mediterranean Sea, in the region of the North Balearic Front (NBF) to study interactions between fine-scale oceanic circulation and biogeochemical processes. Three water masses were sampled across the NBF, northern ('A'), southern ('B'), and frontal ('F'). Each Lagrangian station consisted of a 24-hour sampling period following the displacement of a water parcel (Doglioli et al., 2024). Vertical profiles down to 500 m were collected every 6 hours at 06:00 ('T1'), 12:00 ('T2'), 18:00 ('T3'), and 00:00 ('T4') UTC, for a total of 28 Lagrangian stations: first between April~24-28 (A1, F1, B1), and again between May~4-7 (B2, F2, A2), with a final station in southern waters (B3) on May~12-13. B2 and B3 stations were located inside an anticyclonic eddy. Hydrological profiles were obtained using a Sea-Bird CTD, with data averaged to a 1~m vertical resolution, they include potential temperature (°C), practical salinity, fluorescence-derived chlorophyll-a (µg/L) and oxygen (µmol/kg). Samples for nitrate + nitrite and phosphate (µM) were collected from Niskin bottles and analyzed onboard within 2-12~hours using a segmented flow analyzer (AAIII HR Seal Analytical) following (Aminot et al., 2007). Quantification limits (QL) were 0.05 µM for nitrate and 0.02 µM for phosphate. Phosphate concentrations at a nanomolar level analyses were performed in the laboratory using a high-sensitivity method combining a 1 m Liquid Waveguide Capillary Cell (LWCC) and an auto-analyzer (Zhang et al. 2002), achieving a detection limit of 0.002µM. A BGC-Argo float (WMO: 1902605 - Provor CTS4 SUNA) equipped with a CTD and SUNA nitrate sensor was deployed near station B2 and sampled the anticyclonic eddy. To better resolve the photic and nutricline layers, the standard sampling cycle was modified to a 6-hour frequency, reaching depths of 300-400~m. The BGC-Argo float nitrate dataset spans May~2-16 and includes 55~profiles, with a 0.5 µM limit of quantification. It passed through a nitrate calibration procedure against 8 ship-made profiles at B2 and B3. Data export in NetCDF format - Dataset at the 7 Lagrangian stations (28 vertical profiles for each variable, 4 at each station): ‘BioSWOT-Med_LS_Date_Time.nc’ (with day, time, longitude and latitude); ‘BioSWOT-Med_LS_Nutrients.nc’ (with nitrate, phosphate and phosphate at nanomolar level concentrations and depths); 'BioSWOT-Med_LS_CTD.nc' (with temperature in situ, practical salinity, chlorophyll-a and oxygen concentrations, photosynthetically active radiations and depth). - Dataset of the BGC-Argo float including 55 vertical profiles recorded between May 2 and 16: 'BioSWOT-Med_BGC-Argo' (with day and time, longitude, latitude; nitrate concentrations with associated depth; temperature in situ and practical salinity associated depth; chlorophyll-a concentrations with associated predepthssure; and oxygen concentrations with associated depth). Contact list Aude Joël (aude.joel@mio.osupytheas.fr), Sandra Nunige (sandra.nunige@mio.osupytheas.fr, for ship-made nutrient dataset), Riccardo Martellucci (rmartellucci@ogs.it, for the BGC-Argo float dataset) and Andrea Doglioli (andrea.doglioli@mio.osupytheas.fr, for the BioSWOT-Med cruise). References Aminot, A., & Kérouel, R. 2007. Dosage automatique des nutriments dans les eaux marines: méthodes en flux continu. Méthodes d’analyse en milieu marin. Ifremer. Doglioli, A.M., & Gregori, G. 2023. BioSWOT-Med cruise, RV L’Atalante. doi:10.17600/18002392. Doglioli, A., Grégori, G., D’Ovidio, F., Bosse, P. E., A., Carlotti, F., Lescot, M.,. . . Waggonet, E. (2024). Bioswot med. biological applicati.ons of the satellite surface water and ocean topography in the mediterranean. ref. rapport de campagne. université aix-marseille. (doi:10.13155/100060) Zhang, J.Z., & Chi, J. 2002. Automated analysis of nanomolar concentrations of phosphate in natural waters with liquid waveguide. Environ Sci Technol., 1;36(5), 1048–53. doi: 10.1021/es011094v.
-
-

The European Union’s Copernicus-funded TRUSTED project (Towards Fiducial Reference Measurements of Sea-Surface Temperature by European Drifters) has deployed over 100 state of the art drifting buoys for improved validation of Sea Surface Temperature (SST) from the Sentinel-3 Sea and Land Surface Temperature Radiometers (SLSTR). These buoys are manufactured by NKE. The TRUSTED drifting buoys data and metadata are distributed in qualtity control NetCDF files, as a subset of DBCP drifting buoys GDAC (Global Data Assembly Centre). Coriolis DAC (Data Assembly Centre) routinely collects, decodes, quality controls, preserves and distributes data and metadata as NetCDF-CF files. The TRUSTED buoys have specific features managed by Coriolis DAC python data processing chain: a high resolution temperature sensor in addition to the classic drifting buoy temperature sensor. The high sampling and high resolution observations are distributed in specific variables TEMP_HR, TEMP_HR_SPOT, TEMP_HR_XX (XX is the percentile sample).
-
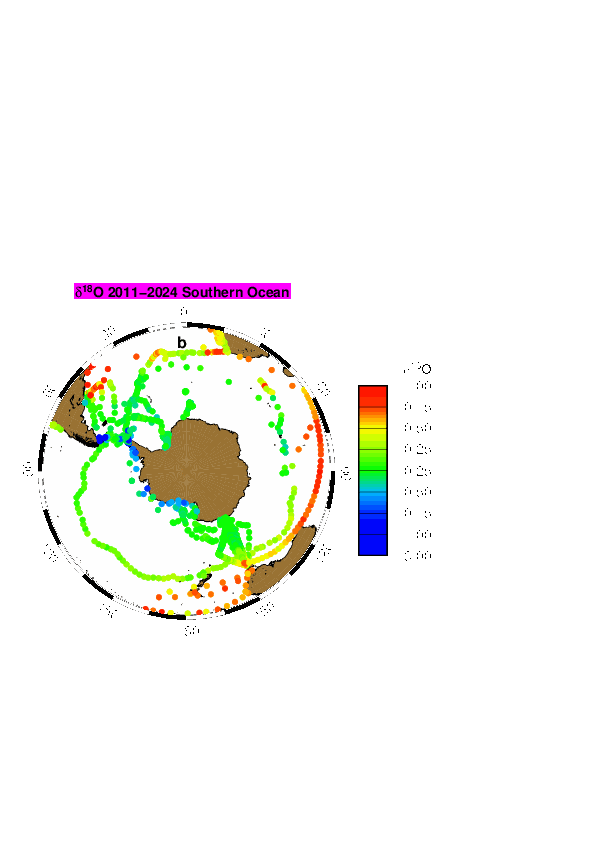
LOCEAN has been in charge of collecting sea water for the analysis of water isotopes on a series of cruises or ships of opportunity mostly in the equatorial Atlantic, in the North Atlantic, in the southern Indian Ocean, in the southern Seas, Nordic Seas, and in the Arctic. The LOCEAN data set of the oxygen and hydrogen isotope (δ18O and δD) of marine water covers the period 1998 to 2019, but the effort is ongoing. Most data prior to 2010 (only δ18O) were analyzed using isotope ratio mass spectrometry (Isoprime IRMS) coupled with a Multiprep system (dual inlet method), whereas most data since 2010 (and a few earlier data) were obtained by cavity ring down spectrometry (CRDS) on a Picarro CRDS L2130-I, or less commonly on a Picarro CRDS L2120-I. Occasionally, some data were also run by Marion Benetti on an Isoprime IRMS coupled to a GasBench (dual inlet method) at the university of Iceland (Reykjavik). On the LOCEAN Picarro CRDS, most samples were initially analyzed after distillation, but since 2016, they have often been analyzed using a wire mesh to limit the spreading of sea salt in the vaporizer. Some of the samples on the CRDS were analyzed more than once on different days, when repeatability for the same sample was not sufficient or the daily run presented a too large drift. Accuracy is best when samples are distilled, and for δD are better on the Picarro CRDS L2130-I than on the Picarro CRDS L2120-I. Usually, we found that the reproducibility of the δ18O measurements is within ± 0.05 ‰ and of the δD measurements within ± 0.30 ‰, which should be considered an upper estimate of the error on the measurement on a Picarro CRDS. The water samples were kept in darkened glass bottles (20 to 50 ml) with special caps, and were often (but not always) taped afterwards. Once brought back in Paris, the samples were often stored in a cold room (with temperature close to 4°C), in particular if they were not analyzed within the next three months. There is however the possibility that some samples have breathed during storage. We found it happening on a number of samples, more commonly when they were stored for more than 5 years before being analyzed. We also used during one cruise bottles with not well-sealed caps (M/V Nuka Arctica in April 2019), which were analyzed within 3 months, but for which close to one third of the samples had breathed. We have retained those analyses, but added a flag ‘3’ meaning probably bad, at least on d-excess (outside of regions where sea ice forms or melts, for the analyses done on the Picarro CRDS, excessive evaporation is usually found with a d-excess criterium (which tends to be too low); for the IRMS analyses, it is mostly based when excessive scatter is found in the S- δ18O scatter plots or between successive data, in which case some outliers were flagged at ‘3’). In some cases when breathing happened, we found that d-excess can be used to produce a corrected estimate of δ18O and δD (Benetti et al., 2016). When this method was used a flag ‘1’ is added, indicating ‘probably good’ data, and should be thought as not as accurate as the data with no ‘correction’, which are flagged ‘2’ or ‘0’. We have adjusted data to be on an absolute fresh-water scale based on the study of Benetti et al. (2017), and on further tests with the different wire meshes used more recently. We have also checked the consistency of the runs in time, as there could have been changes in the internal standards used. On the Isoprime IRMS, it was mostly done using different batches of ‘Eau de Paris’ (EDP), whereas on the Picarro CRDS, we used three internal standards kept in metal tanks with a slight overpressure of dry air). The internal standards have been calibrated using VSMOW and GISP, and were also sent to other laboratories to evaluate whether they had drifted since the date of creation (as individual sub-standards have typically stored for more than 5-years). These comparisons are still not fully statisfactory to evaluate possible drifts in the sub-standards. Version V5 contains only one global file (ALL-Wisotopes-V5). However, up to version V4, individual files corresponded to regional subsets : - SO: Southern Ocean including cruise station and surface data mostly from 2017 in the Weddell Sea (WAPITI Cruise JR160004, DOI:10.17882/54012), as well as in the southern Ocean south of 20°S - SI: OISO cruise station and surface data in the southern Indian Ocean (since 1998) (DOI:10.18142/228) - EA: 20°N-20°S cruise station and surface data (since 2005), in particular in the equatorial Atlantic from French PIRATA (DOI:10.18142/14) and EGEE cruises (DOI:10.18142/95) - NA: 20°N-72°N station and surface data, mostly in the North Atlantic from Oceanographic cruises as well as from ships of opportunity (this includes in particular OVIDE cruise data since 2002 (DOI:10.17882/46448), CATARINA, BOCATS1 and BOCATS2 (PID2019-104279GB-C21/AEI/10.13039/501100011033) cruises funded by the Spanish Research Agency, RREX2017 2017 cruise data (DOI:10.17600/17001400), SURATLANT data set since 2011 (DOI:10.17882/54517), Nuka Arctica and Tukuma Arctica data since 2012, STRASSE (DOI:10.17600/12040060) and MIDAS cruise data in 2012-2013, as well as surface data from various ships of opportunity since 2012) - NS: Nordic Sea data from cruises in 2002-2018 - AS: Arctic Ocean north of 72°N, in particular from two Tara cruises (in 2006-2008 and 2013) and expeditions since 2020 - PM: miscellaneous data in tropical Pacific, Indian Ocean, Mediterranean Sea and Black Sea In some regions, such as in the Indian Ocean, it is valuable to combine different subsets to have the full data distribution. The files are in csv format reported, and starting with version V1, it is reported as: - Cruise name, station id, bottle number, day, month, year, hour, minute, latitude, longitude, pressure (db), temperature (°C), it, salinity (pss-78), is, dissolved oxygen (micromol/kg), io2, δ18O, iO, d D, iD, d-excess, id, method type - Temperature is an in situ temperature - Salinity is a practical salinity it, is, io2, iO, iD, id are quality indices equal to: - 0 no quality check (but presumably good data) - 1 probably good data - 2 good data - 3 probably bad data - 4 certainly bad data - 9 missing data (and the missing data are reported with an unlikely missing value) The method type is 1 for IRMS measurements, 2 for CRDS measurement of a saline water sample, 3 for CRDS measurement of a distilled water sample.
-

'''DEFINITION''' The indicator of Volume Transport Anomaly in Selected Vertical Sections in the Iberia–Biscay–Ireland (IBI) region (OMI_CIRCULATION_VOLTRANS_IBI_section_integrated_anomalies) is defined as the time series of annual mean volume transport calculated across a set of vertical ocean sections. These sections have been selected to represent the temporal variability of key ocean currents within the IBI domain. The monitored ocean currents include the transport towards the North Sea through the Rockall Trough (RTE) (Holliday et al., 2008; Lozier and Stewart, 2008), the Canary Current (CC) (Knoll et al., 2002; Mason et al., 2011), the Azores Current (AC) (Mason et al., 2011), the Algerian Current (ALG) (Tintoré et al., 1988; Benzohra and Millot, 1995; Font et al., 1998), and the net transport along the 48° N latitude parallel (N48) (see OMI figure). To produce ensemble-based results, six datasets provided by the Copernicus Marine Service have been used: * '''IBI-REA''' & '''IBI-INT''': IBI_MULTIYEAR_PHY_005_002 (reanalysis and interim datasets) * '''GLO-REA''': GLOBAL_MULTIYEAR_PHY_001_030 (reanalysis) * '''ARMOR''': MULTIOBS_GLO_PHY_TSUV_3D_MYNRT_015_012 (reprocessed observations) * '''MED-REA''': MEDSEA_MULTIYEAR_PHY_006_004 (reanalysis) * '''NWS-REA''': NWSHELF_MULTIYEAR_PHY_004_009 (reanalysis) The time series displays the ensemble mean (blue line), the ensemble spread (grey shaded area), and the mean transport with reversed sign (red dashed line), which indicates the threshold of anomaly values corresponding to a reversal in the direction of the current transport. In addition, the trend analysis at the 95% confidence level is shown in the bottom-right corner of each diagram. Further details on the product are provided in the corresponding Product User Manual (de Pascual-Collar et al., 2026a) and Quality Information Document (de Pascual-Collar et al., 2026b), as well as in de Pascual-Collar et al., 2024. '''CONTEXT''' The IBI area is a highly complex region characterized by a remarkable variety of ocean currents. Among them, we can highlight those that originate as a result of the closure of the North Atlantic Drift (Mason et al., 2011; Holliday et al., 2008; Peliz et al., 2007; Bower et al., 2002; Knoll et al., 2002; Pérez et al., 2001; Jia, 2000); the subsurface currents flowing northward along the continental slope (de Pascual-Collar et al., 2019; Pascual et al., 2018; Machín et al., 2010; Fricourt et al., 2007; Knoll et al., 2002; Mazé et al., 1997; White & Bowyer, 1997); and the exchange currents occurring in the Strait of Gibraltar and the Alboran Sea (Sotillo et al., 2016; Font et al., 1998; Benzohra & Millot, 1995; Tintoré et al., 1988). The variability of ocean currents in the IBI domain is relevant to the global thermohaline circulation and other climatic and environmental processes. For example, as discussed by Fasullo and Trenberth (2008), subtropical gyres play a crucial role in the meridional energy balance. The poleward salt transport of Mediterranean water, driven by subsurface slope currents, has significant implications for salinity anomalies in the Rockall Trough and the Nordic Seas, as studied by Holliday (2003), Holliday et al. (2008), and Bozec et al. (2011). The Algerian Current serves as the only pathway for Atlantic Water to reach the Western Mediterranean. '''CMEMS KEY FINDINGS''' The volume transport time series reveal periods during which the monitored currents exhibited notably high or low variability. Specifically, the RTE current shows pronounced variability in 2010 and during 2014–2015; the N48 section between 2012 and 2014; the ALG current in 2006 and 2017; the AC current between 2005–2007 and in 2021; and the CC current between 2005–2007. Furthermore, certain periods display anomalies of sufficient magnitude (in absolute value) to indicate a reversal in the net transport direction of the current. This is the case for the ALG current in 2017 and 2024 (with net transport towards the west), and for the CC current in 2010 (with net transport towards the north). Trend analysis over the period 1993–2023 does not reveal any statistically significant trends for the monitored currents. However, the confidence interval for the trend in the ALG section is close to rejecting the null hypothesis of no trend. '''DOI (product):''' https://doi.org/10.48670/mds-00351
-
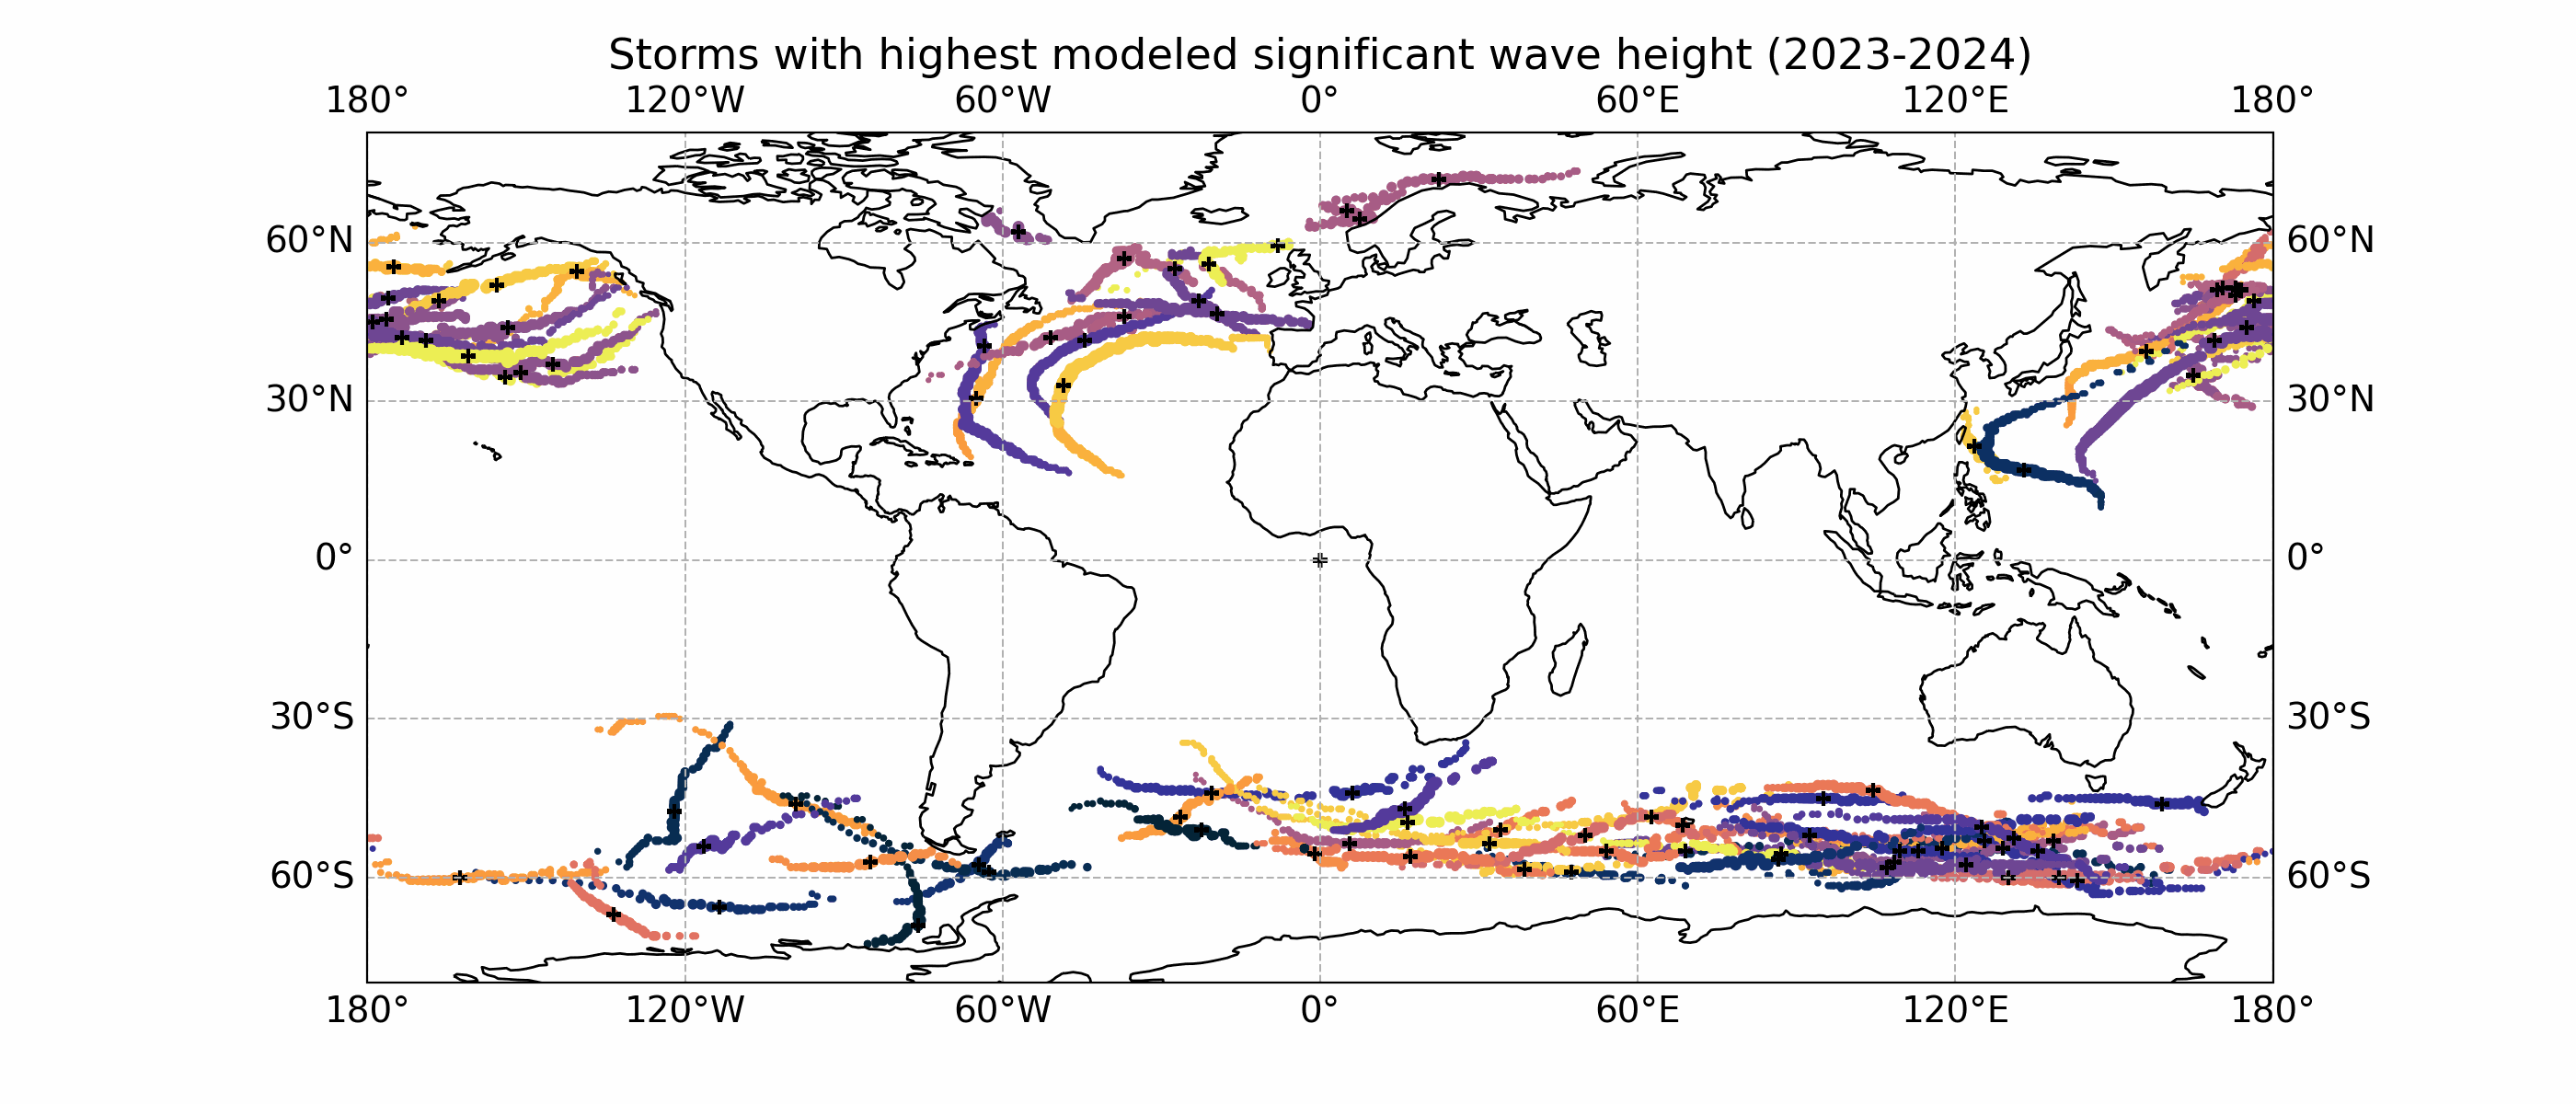
These storm tracks were obtained from tracking the maxima of significant wave heights. The method was adapted from storm tracking methods that typically use sea level pressure.
-

EMODnet Chemistry aims to provide access to marine chemistry datasets and derived data products concerning eutrophication, acidity and contaminants. The importance of the selected substances and other parameters relates to the Marine Strategy Framework Directive (MSFD). This aggregated dataset contains all unrestricted EMODnet Chemistry data on eutrophication and acidity, and covers the Northeast Atlantic Ocean (40W). Data were aggregated and quality controlled by 'IFREMER / IDM / SISMER - Scientific Information Systems for the SEA' in France. ITS-90 water temperature and water body salinity variables have also been included ('as are') to complete the eutrophication and acidity data. If you use these variables for calculations, please refer to SeaDataNet for the quality flags: https://www.seadatanet.org/Products/Aggregated-datasets . Regional datasets concerning eutrophication and acidity are automatically harvested, and the resulting collections are aggregated and quality controlled using ODV Software and following a common methodology for all sea regions ( https://doi.org/10.13120/8xm0-5m67 ). Parameter names are based on P35 vocabulary, which relates to EMODnet Chemistry aggregated parameter names and is available at: https://vocab.nerc.ac.uk/search_nvs/P35/ . When not present in original data, water body nitrate plus nitrite was calculated by summing all nitrate and nitrite parameters. The same procedure was applied for water body dissolved inorganic nitrogen (DIN), which was calculated by summing all nitrate, nitrite, and ammonium parameters. Concentrations per unit mass were converted to a unit volume using a constant density of 1.025 kg/L. The aggregated dataset can also be downloaded as an ODV collection and spreadsheet, which is composed of a metadata header followed by tab separated values. This spreadsheet can be imported to ODV Software for visualisation (more information can be found at: https://www.seadatanet.org/Software/ODV ).
-
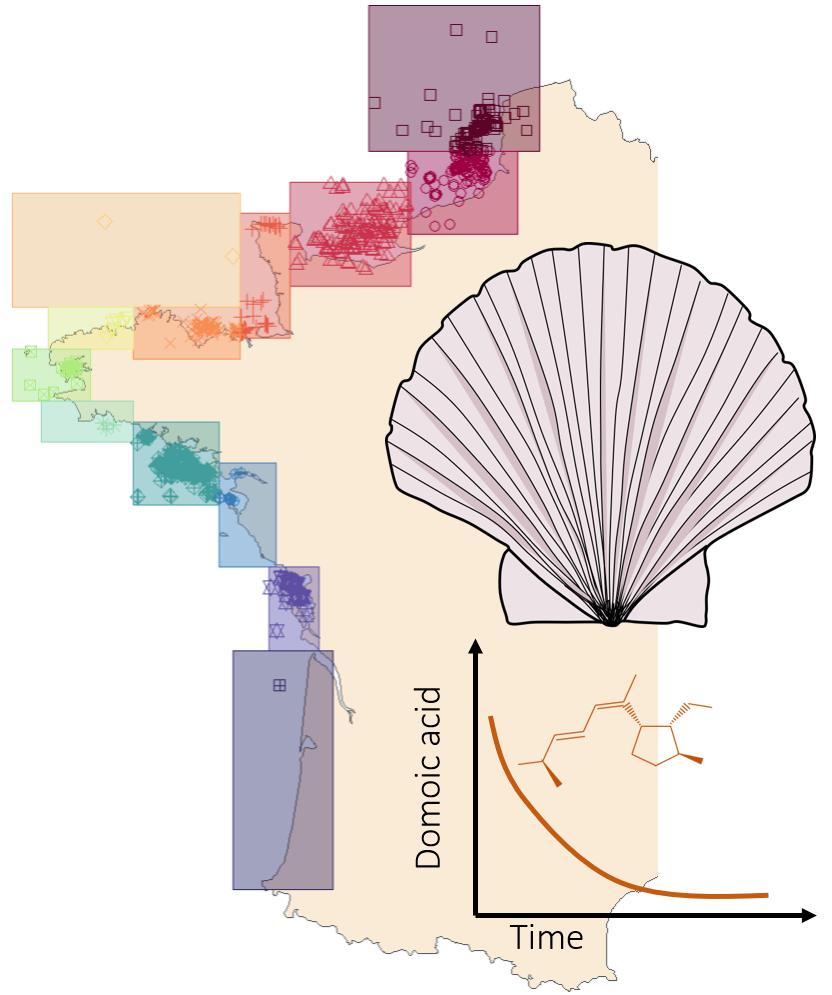
In the context of contamination of shellfish species by domoic acid produced by microalgal species of the genus Pseudo-nitzschia, we studied the particular case of depuration kinetics of king scallops, Pecten maximus. The study was based on the REPHYTOX dataset (https://doi.org/10.17882/47251) which includes, among others, long-term time series of domoic acid in shellfish species. We selected only the locations along the English Channel and the Atlantic coastline. Contamination events were defined for each locations, depuration rates were estimated fitting an exponential decay model using a non-linear least squares regression. Spatio-temporal variability was assessed as well as correlations to environmental conditions, using REPHY dataset (https://doi.org/10.17882/47248). Finally, scenarios for predictions of either the dynamics of depuration or the domoic acid contamination at a precise date were performed. Four files are available as data used for the study and results : (i) subset of REPHYTOX dataset, (ii) subset of REPHY dataset, used in this study and (iii) contamination event information (i.e., initial and end date of the event, initial domoic acid concentration) and depuration rate estimations, and (iv) predictions of depuration dynamics with different scenarios. Information on each file is detailed in the end user manual and methodology and results are linked to an article in preparation.
-
4-Dimensional Daily Temperature and Marine Heatwaves Categories from ESA/CAREHeat project, version 2

The 4D Marine Heatwaves (MHW) atlas contains 4D (x, y, z, t) **daily temperature and marine heatwaves categories** for global region [82.875°S-89.875°N, 0.125°E-359.875°E], from 0 to 300m depth and a spatial resolution of 1/8°. It covers the period 1993-2022. The MHW atlas has been computed from the temperature 4D fields of the ARMOR3D global product delivered in the Copernicus Marine Service (MULTIOBS_GLO_PHY_TSUV_3D_MYNRT_015_012 - https://doi.org/10.48670/moi-00052 ). The MHW categories are derived from the Hobday’s method [Hobday et al.,2018]. Each MHW event is classified among four categories (moderate to extreme), identified in terms of multiples of the local difference between the 90th percentile and climatological values, and defined as moderate (1-2×, Category I), strong (2-3×, Category II), severe (3-4×, Category III), and extreme (>4×, Category IV). When the category is zero, this means that there is no MHW. The period 1993-2021 is used as a baseline for defining the climatology to be as close as possible to the 30-year period suggested by Hobday. This choice is motivated by the need of altimetry data to constrain the vertical temperature reconstruction, which is required for most ocean reanalyses as well. Additionally, ancillary data are provided together with the data. It consists of 4D daily **temperature climatology** and **90 percentiles of the temperature**. These fields have been used to compute the MHW categories. They are delivered over the same domain as the MHW atlas. ARMOR3D **temperature uncertainties** are also supplied as they can help users to select only the most reliable events in the database. This dataset was generated by CLS (Collecte Localisation satellite) and is distributed by Ifremer /CERSAT in the frame of the CAREHeat project (CAREHeat Website) funded by the European Space Agency (ESA).
-

The PHYTOBS-Network dataset includes long-term time series on marine microphytoplankton, since 1987, along the whole French metropolitan coast. Microphytoplankton data cover microscopic taxonomic identifications and counts. The whole dataset is available, it includes 25 sampling locations. PHYTOBS-Network studies microphytoplankton diversity in the hydrological context along French coasts under gradients of anthropogenic pressures. PHYTOBS-Network allows to analyse the responses of phytoplankton communities to environmental changes, to assess the quality of the coastal environment through indicators, to define ecological niches, to detect variations in bloom phenology, and to support any scientific question by providing data. The PHYTOBS-Network provides the scientific community and stakeholders with validated and qualified data, in order to improve knowledge regarding biomass, abundance and composition of marine microphytoplankton in coastal and lagoon waters in their hydrological context. PHYTOBS-Network originates of two networks. The historical REPHY (French Observation and Monitoring program for Phytoplankton and Hydrology in coastal waters) supported by Ifremer since 1984 and the SOMLIT (Service d'observation en milieu littoral) supported by INSU-CNRS since 1995. The monitoring has started in 1987 on some sites and later in others. Hydrological data are provided by REPHY or SOMLIT network as a function of site locations.