 Catalogue PIGMA
Approved
Type of resources
Available actions
Topics
Keywords
Contact for the resource
Provided by
Years
Formats
Representation types
Update frequencies
status
Resolution
-
It's a study of MPA connectivity with assessment of : -size -shape -spacing between each MPA
-
Assessment of the confidence limits of the data base by means of evaluation of the two involved numerical models: The wave model WAM (Parameter: Significant wave height Hs) and the Atmospheric model SKIRON (Parameter: Wind Speed 10m)
-
Assess whether the MPA network constitutes a representative and coherent network as described in article 13 of the Marine Strategy Framework Directive 3 products were specified to achieve the second objectif of the challenge: ATLANTIC_CH02_Product_2 / Quantitative analyse of MPA coherency The product comprises 4 components: Distribution of vulnerable marine habitats : Shape represent the distribution of different vulnérable habitats Distribution biologically or ecologically significant areas (EBSAs) Critical areas of vulnerable species Distribution of indicator species The method used computes the percentage coverage between : Vulnerable habitats like carbon sinks, reef, kelp... Ecologically or biologically significant area Life critical area (feeding , breeding, migratory routes, spawning, dispersal larvea, nursery…) for indicator species Distribution of indicator species in the study area and MPA network location.
-
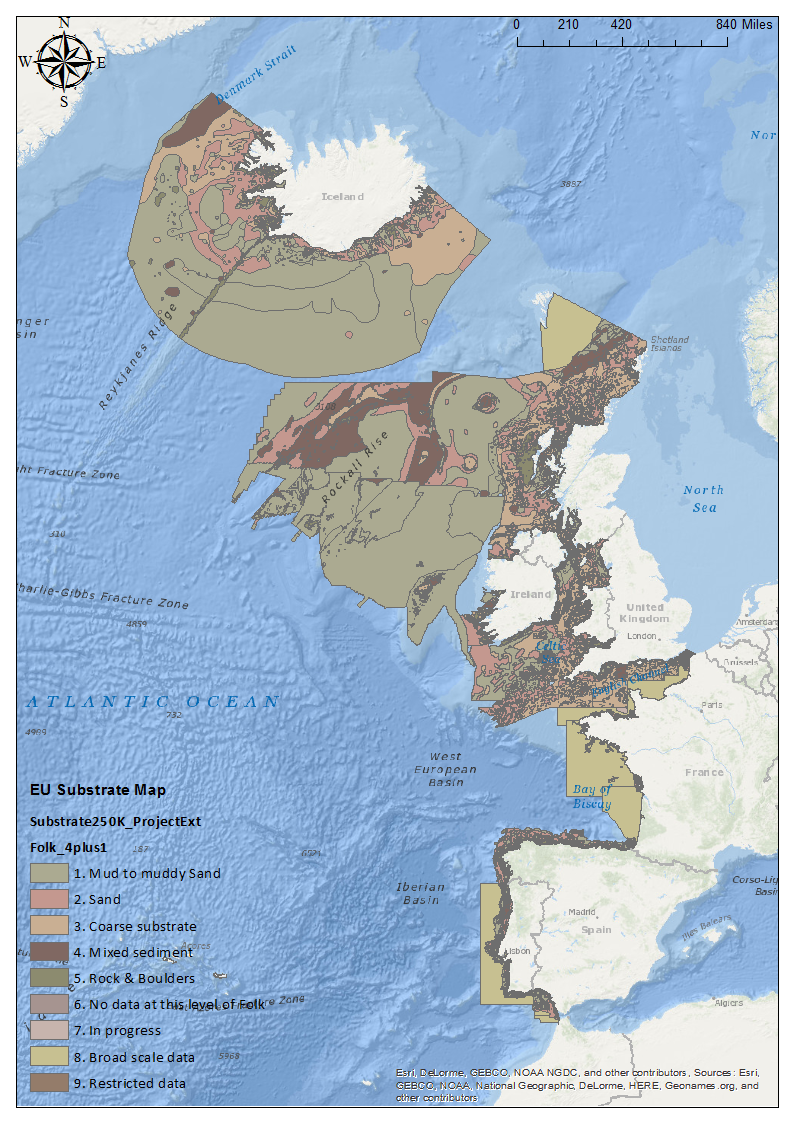
The impact of fishing on benthic habitats has previously been investigated however; a conclusive classification of potentially sensitive habitats per gear type does not exist. Currently only qualitative estimates of fishery impact using Broad-scale habitat maps are possible. Here a sensitivity matrix using both fishing pressure (fishing Intensity) and habitat sensitivity is employed to define habitat disturbance categories. The predominant fishing activities associated with physical abrasion of the seafloor area are from bottom contacting towed fishing gear. The swept area of the aforementioned gear in contact with the seabed is generally considered a function of gear width, vessel speed and fishing effort (ICES. 2015). The varying characteristics of fishing gear, their interaction with the sea floor and species being targeted; provide scope for differing interactions with subsurface (infaunal) and surface (epifaunal) dwelling communities. An evaluation of the abrasion pressure and habitat sensitivity split into surface and subsurface pressure allows greater insight to the ecological effects. Fishing intensity was calculated annually and based on the area of sea floor being swept (or swept area ratio SAR) by gear type. Calculations are based on SAR’s of gear types per area, per year. Fishing pressure ranks and habitat sensitivity ranks obtained from WGSFD working group (01 WGSFD - Report of the Working Group on Spatial Fisheries Data 2015) can be incorporated within a GIS environment to existing ICES fisheries data to provide habitat disturbance maps (fishing pressure maps+ habitat sensitivity maps) ICES. 2015. Report of the Working Group on Spatial Fisheries Data (WGSFD), 8–12 June 2015, ICES Headquarters, Copenhagen, Denmark. ICES CM 2015/SSGEPI:18. 150 pp.
-
This product attempt to follow up on the sea level rise per stretch of coast of the North Atlantic, over past 100 years as follows: • Characterization of absolute sea level trend at annual resolution, along the coasts of EU Member States (including Outermost Regions), Canada, Faroes, Greenland, Iceland, Mexico, Morocco, Norway and USA; The stretchs or coast are defined by the administrative regions of the Atlantic Coast: • from NUTS3** administrative division for EU countries (see Eurostat), and • from GADM*** administrative divisions for non-EU countries. ** Third level of Nomenclature of Territorial Units for Statistics *** Global Administrative Areas For relative sea level trend for 100 years we extract the information from available tide gauge sea level data for each stretch of Coast. The product is Provided in tabular form and as a map layer.
-
One product and 3 components were developed in order to fulfill the third objectif ATLANTIC_CH02_Product_5 / Distribution of ocean monitoring systems to assess climate change existing into the MPA network • Physical parameter monitoring • Chemical parameter monitoring • Biological parameter monitoring The aim of the product is the identification of ocean monitoring systems to assess climate change in MPAs.
-
Data from a number of different sources have been integrated to provide new perspectives on fishing activities. Vessel Monitoring Systems (VMS) record and transmit the position and speed of fishing vessels at intervals of two hours or less. Fishing time can be calculated from the VMS data and combining this parameter with vessel logbook data, maps of fishing effort and intensity at different spatial and temporal scales can be calculated. The statistical software package “R” is used to extract the required information then re-interrogated to produce maps of fishing effort or intensity per month and year. The use of Automatic Identification System (AIS) data was not considered as combining AIS data with fisheries logbook data would pose issues namely; the ability of the AIS system to be switched off, only mandatory on vessels > 15 meters in length, cost involved to purchase data, and confidentiality.
-
We took inspiration from a “Matrix of marine activities” (appropriate for each IUCN management category) extracted from IUCN paper, to achieve the first objective by computing 1 product comprising the following 12 components: Product ATLANTIC_CH02_Product_1 / MPA Atlantic network classified in IUCN classification • Traditional fishing area • Sustainable fishing area (industrial) • Leisure fishing area • Leisure activity area (diving, surfing, tourist beaches) • Shipping area (shipping trajectory, aids navigation) • Scientific activity area • Renewable energy generation facility area (ocean energy facilities, wind farms) • Aquaculture area (finfish production, shellfish production) • Shipping infrastructure area (harbours, dredging area...) • Waste discharge area • Mining area (aggregate extraction, hydrocarbon extraction) • Habitation area (urban area) Each geographic information required for the components was compiled into a layer in grid format. These grids were intersected with the MPAs layer to assign each MPA a IUCN category according to the conditional matrix illustrated below : If the MPA area contains : Habitation area (urban area) The IUCN category is :V If the MPA area contains : Mining area (aggregate extraction, hydrocarbon extraction) The IUCN category is V If the MPA area contains : Waste discharge area The IUCN category is : V If the MPA area contains : Shipping infrastructure area (harbours, dredging area...) The IUCN category is IV If the MPA area contains : Aquaculture area (finfish production, shellfish production) The IUCN category is IV If the MPA area contains : Renewable energy generation facility area (ocean energy facilities, wind farms) The IUCN category is IV If the MPA area contains : Leisure fishing area The IUCN category is IV If the MPA area contains : Sustainable fishing area (industrial) The IUCN category is IV If the MPA area contains : Shipping area (shipping trajectory, aids navigation) The IUCN category is II If the MPA area contains : Leisure activity area (diving, surfing, tourist beaches) The IUCN category is Ib If the MPA area contains : Traditional fishing area The IUCN category is Ib If the MPA area contains : Scientific activity area The IUCN category is Ia
-
The three digital maps provided in this product aim to assess the degree of Offshore windfarm siting suitability existing over a geographical area with a focal point where waters of France and Spain meet in Biscay Bay on 500 m depth. The maps display respectively the spatial distribution of the average and lowest windfarm siting suitability scores along with the average wind speed distribution over a time period of 10 years. They are part of a process set up to assess the fit for use quality of the currently available datasets to support a preliminary selection of potential offshore sites for wind energy development. To build these maps, GIS tools were applied to several key spatial datasets from the 5 data type domains considered in the project: Air, Marine Water, Riverbed/Seabed, Biota/Biology and Human Activities, collated during the initial stages of the project. Initially, each selected dataset was formatted and clipped to the study area extent and spatially classified according to suitability scores, to define raster layers with the variables depicting levels of current anthropogenic and environmental spatial occupation of activities, seabed depth and slope, distances to shoreline, shipping intensity, mean significant wave height, and substrate type. These pre-processed layers were employed as inputs for applying a spatial multi-criteria model using a wind farming suitability classification based on a discrete 5 grades index, ranging from Very Low up to Very High suitability. In adition to suitability maps, an average wind speed spatial distribution map for a 10 years period, at 10 m height, was obtained over the study area from the raster processing of a wind speed time series of monthly means available from daily wind analysis data. The characteristics of the datasets used in this exercise underwent an appropriateness evaluation procedure based on a comparison between their measured quality and those specified for the product. The study area, located in the Biscay Golf includes a coastal zone of Spain and France. Consequently, some zones are subject to constraints to offshore windfarm implementation due to environmental protection, visual impacts and seafoor attributes. Data gaps exist with an emphasis on fishing activity and distribution of essential habitats and species. All the spatial information made available in these maps and from the subsequent appropriateness analysis of the datasets, contributes to a clearer overview of the amount of public-access baseline knowledge currently existing for the North Atlantic basin area.
-
This product attempt to follow up on the sea level rise per stretch of coast of the North Atlantic, over past 10 years as follows: • Characterization of absolute sea level trend at annual resolution, along the coasts of EU Member States (including Outermost Regions), Canada, Faroes, Greenland, Iceland, Mexico, Morocco, Norway and USA; The stretchs or coast are defined by the administrative regions of the Atlantic Coast: • from NUTS3** administrative division for EU countries (see Eurostat), and • from GADM*** administrative divisions for non-EU countries. ** Third level of Nomenclature of Territorial Units for Statistics *** Global Administrative Areas For absolute sea level trend for 10 years we extract the information from grided satellite altimetry data and extrapolate it to the nearest strecth of coast. The product is Provided in tabular form and as a map layer.