 Catalogue PIGMA
GeoTIFF
Type of resources
Available actions
Topics
Keywords
Contact for the resource
Provided by
Years
Formats
Representation types
Update frequencies
status
Scale
Resolution
-
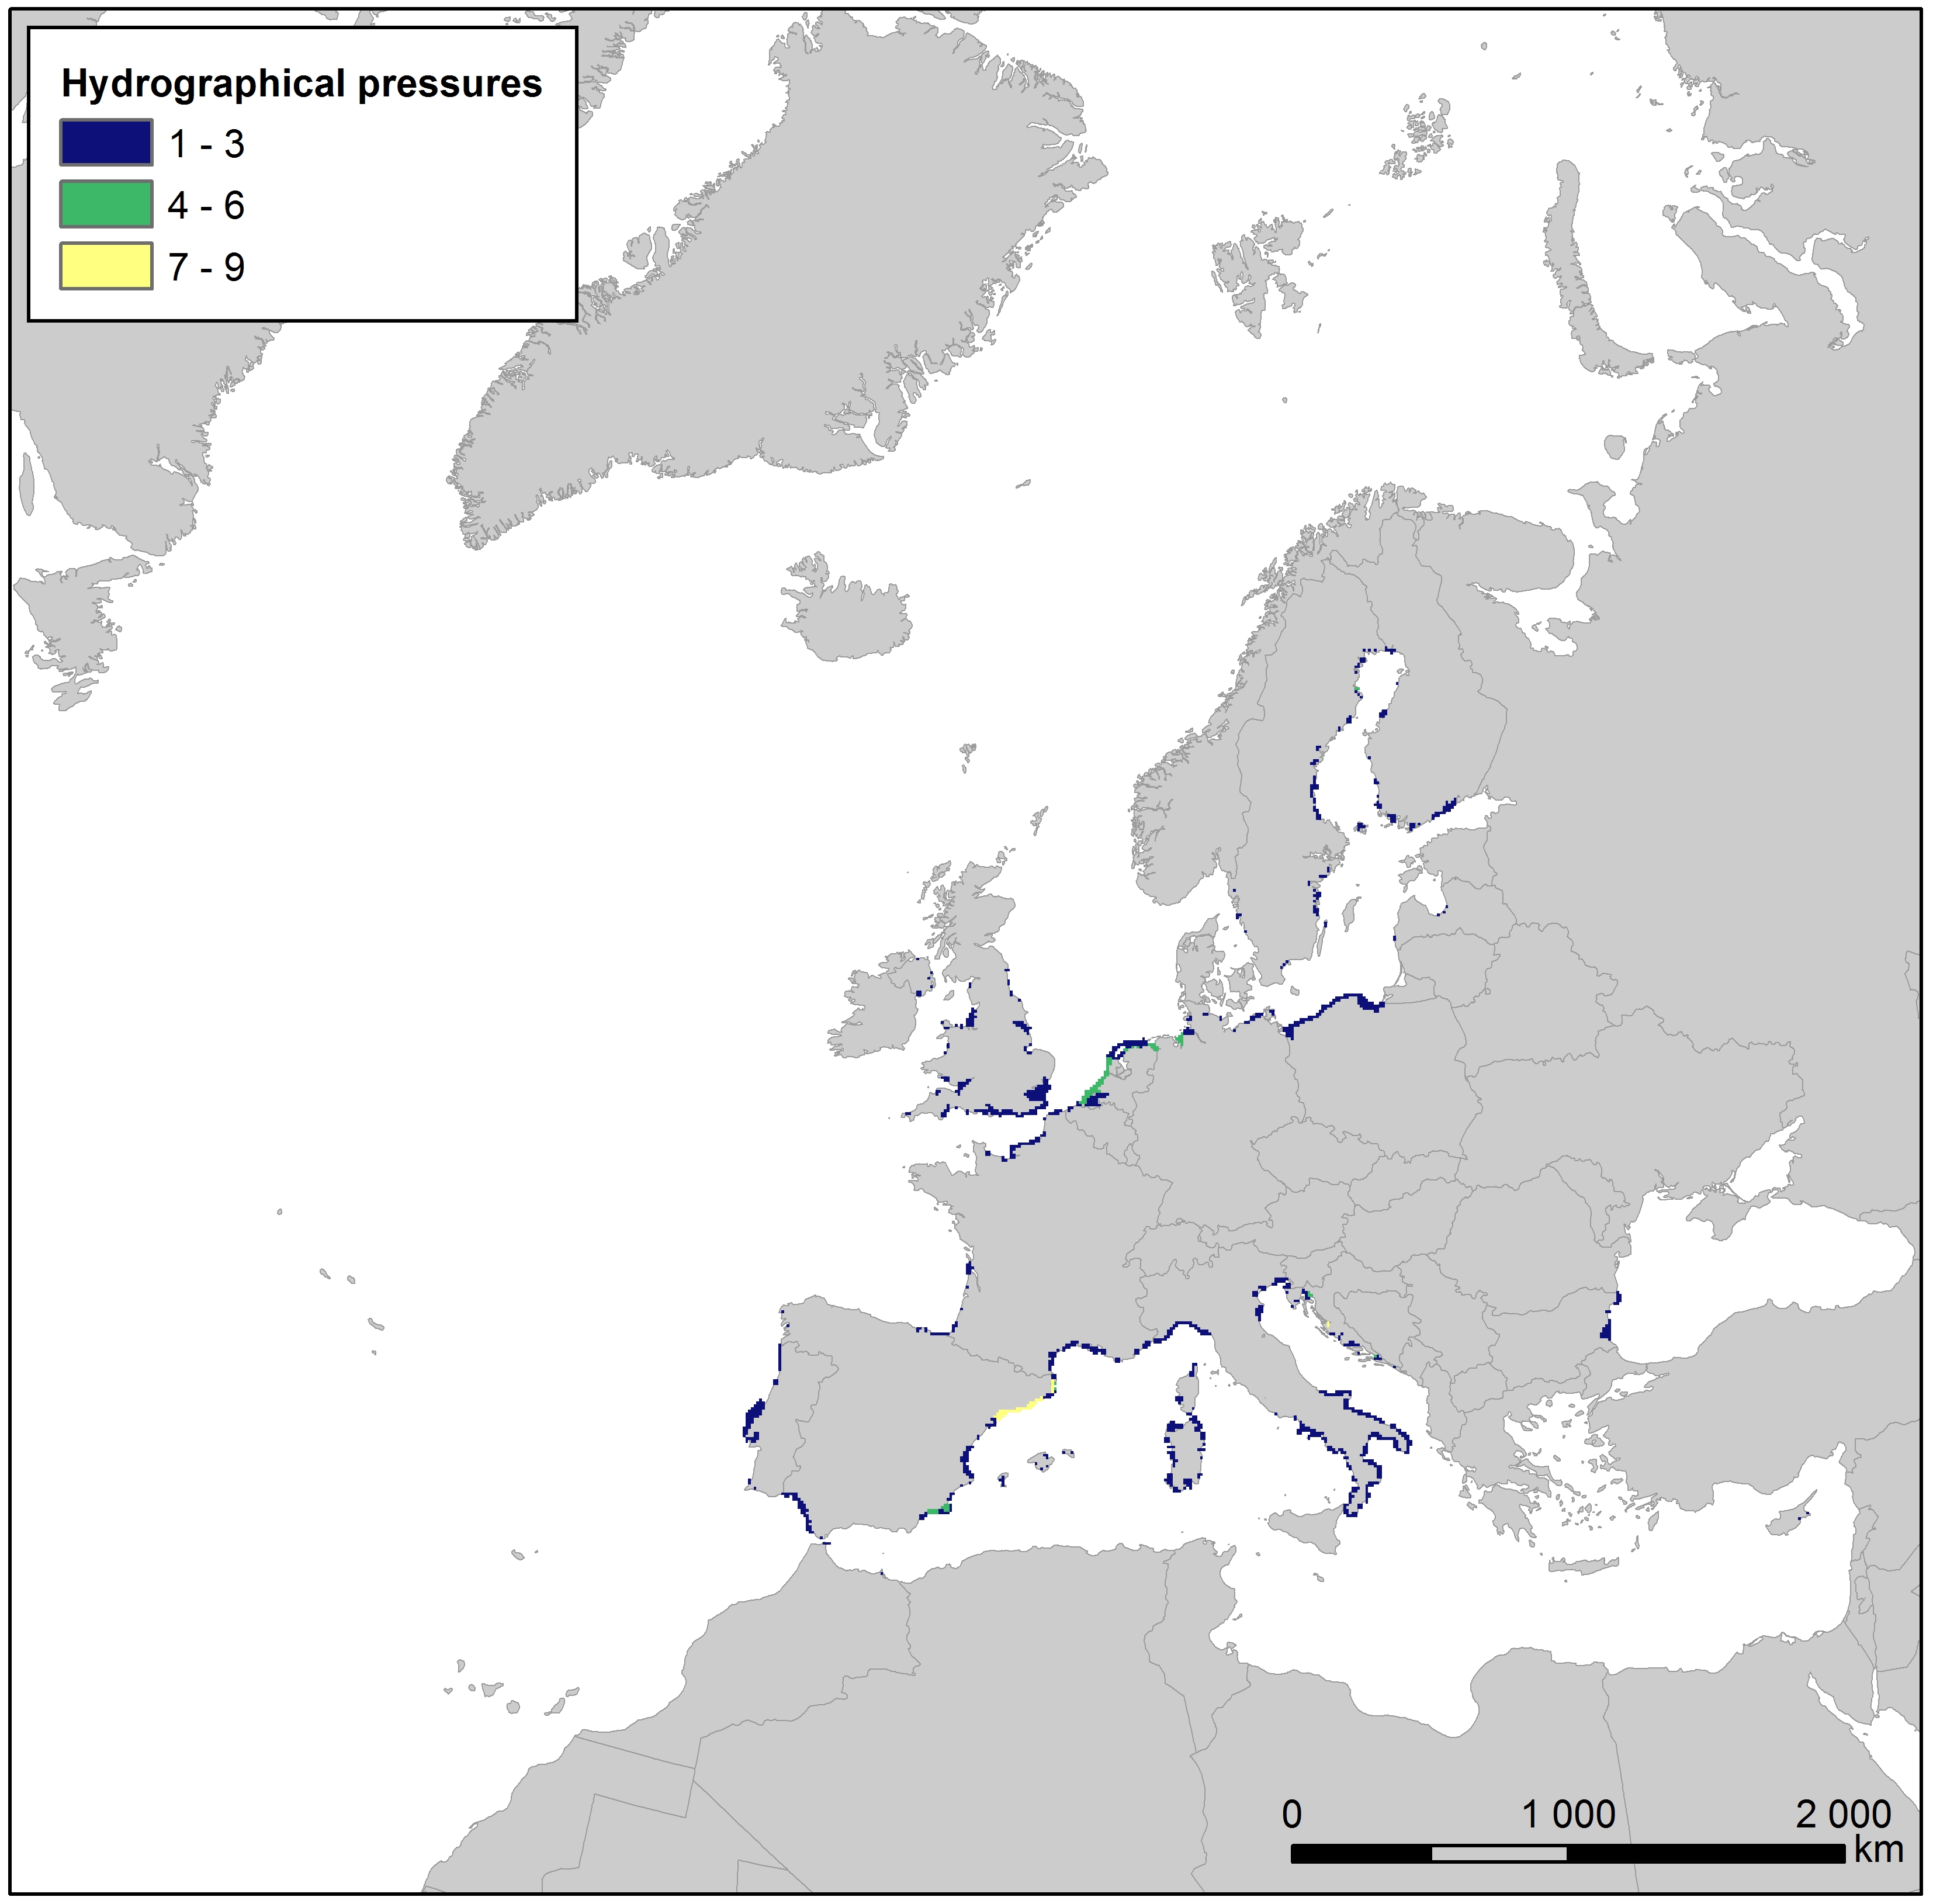
This raster dataset presents the number of different hydrographical pressures per grid cell along the European coastlines. Hydrographical pressures are human activities that cause changes in hydrological conditions, i.e. changes to freshwater input, salinity, seawater flows, waves, currents, and temperature. Examples of such activities include riverine or coastal dams, offshore infrastructure, and outflows from power plants. The layer has been created using the Water Framework Directive (WFD) reported data on hydrographical pressures joined with the water body polygon features for the reference year 2016. The dataset was then rasterized into the EEA 10 km grid, and the cell values assigned with the number of different hydrographical pressures in the area covered by the cell. This dataset has been prepared for the calculation of the combined effect index, produced for the ETC/ICM Report 4/2019 "Multiple pressures and their combined effects in Europe's seas" available on: https://www.eionet.europa.eu/etcs/etc-icm/etc-icm-report-4-2019-multiple-pressures-and-their-combined-effects-in-europes-seas-1.
-
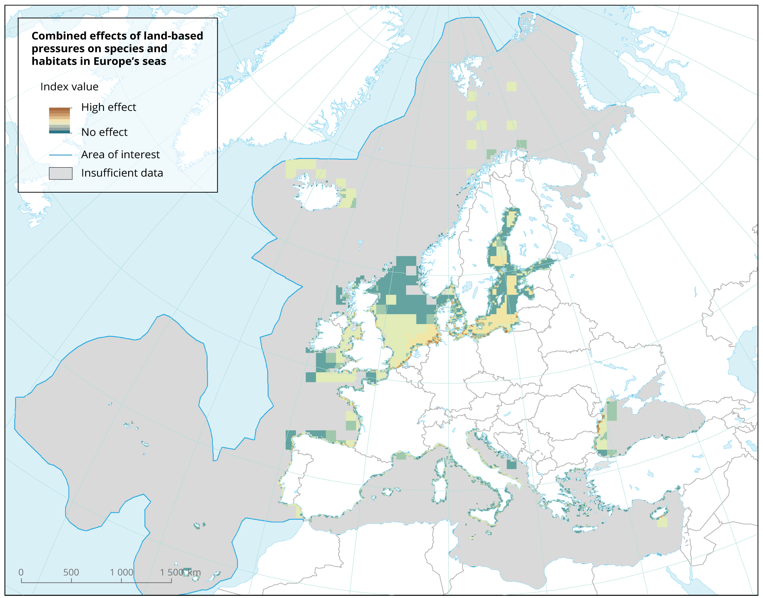
The dataset presents the potential combined effects of land-based pressures on marine species and habitats estimated using the method for assessment of cumulative effects, for the entire suite of pressures and a selected set of marine species groups and habitats by an index (Halpern et al. 2008). The spatial assessment of combined effects of multiple pressures informs of the risks of human activities on the marine ecosystem health. The methodology builds on the spatial layers of pressures and ecosystem components and on an estimate of ecosystem sensitivity through an expert questionnaire. The raster dataset consists of a division of the Europe's seas in 10km and 100 km grid cells, which values represents the combined effects index values for pressures caused by land-based human activities. The relative values indicate areas where the pressures potentially affect the marine ecosystem. This dataset underpins the findings and cartographic representations published in the report "Marine Messages" (EEA, 2020).
-
Maps of seasonal p90 (percentile 90) of Chla on the North Atlantic basin for the past ten years (2005-2014) using the Global Copernicus chla level 4 (L4) products (resolution of 4 km). Method as Gohin Francis, Saulquin Bertrand, Bryere Philippe (2010) Atlas de la Température, de la concentration en Chlorophylle et de la Turbidité de surface du plateau continental français et de ses abords de l’Ouest européen. Ifremer. http://archimer.ifremer.fr/doc/00057/16840/
-
Coastal zones are presented as a series of 10 consecutive buffers of 1km width each (towards inland). For this dataset, were treated as sea data all areas with a class value of 523 (sea and ocean) in Corine Land Cover (details in lineage).
-

Species distribution models (GAM, Maxent and Random Forest ensemble) predicting the distribution of Solitary Scleractinian fields assemblage in the Celtic Sea. This community is considered ecologically coherent according to the cluster analysis conducted by Parry et al. (2015) on image sample. Modelling its distribution complements existing work on their definition and offers a representation of the extent of the areas of the north-east Atlantic where they can occur based on the best available knowledge. This work was performed at the University of Plymouth in 2021.
-
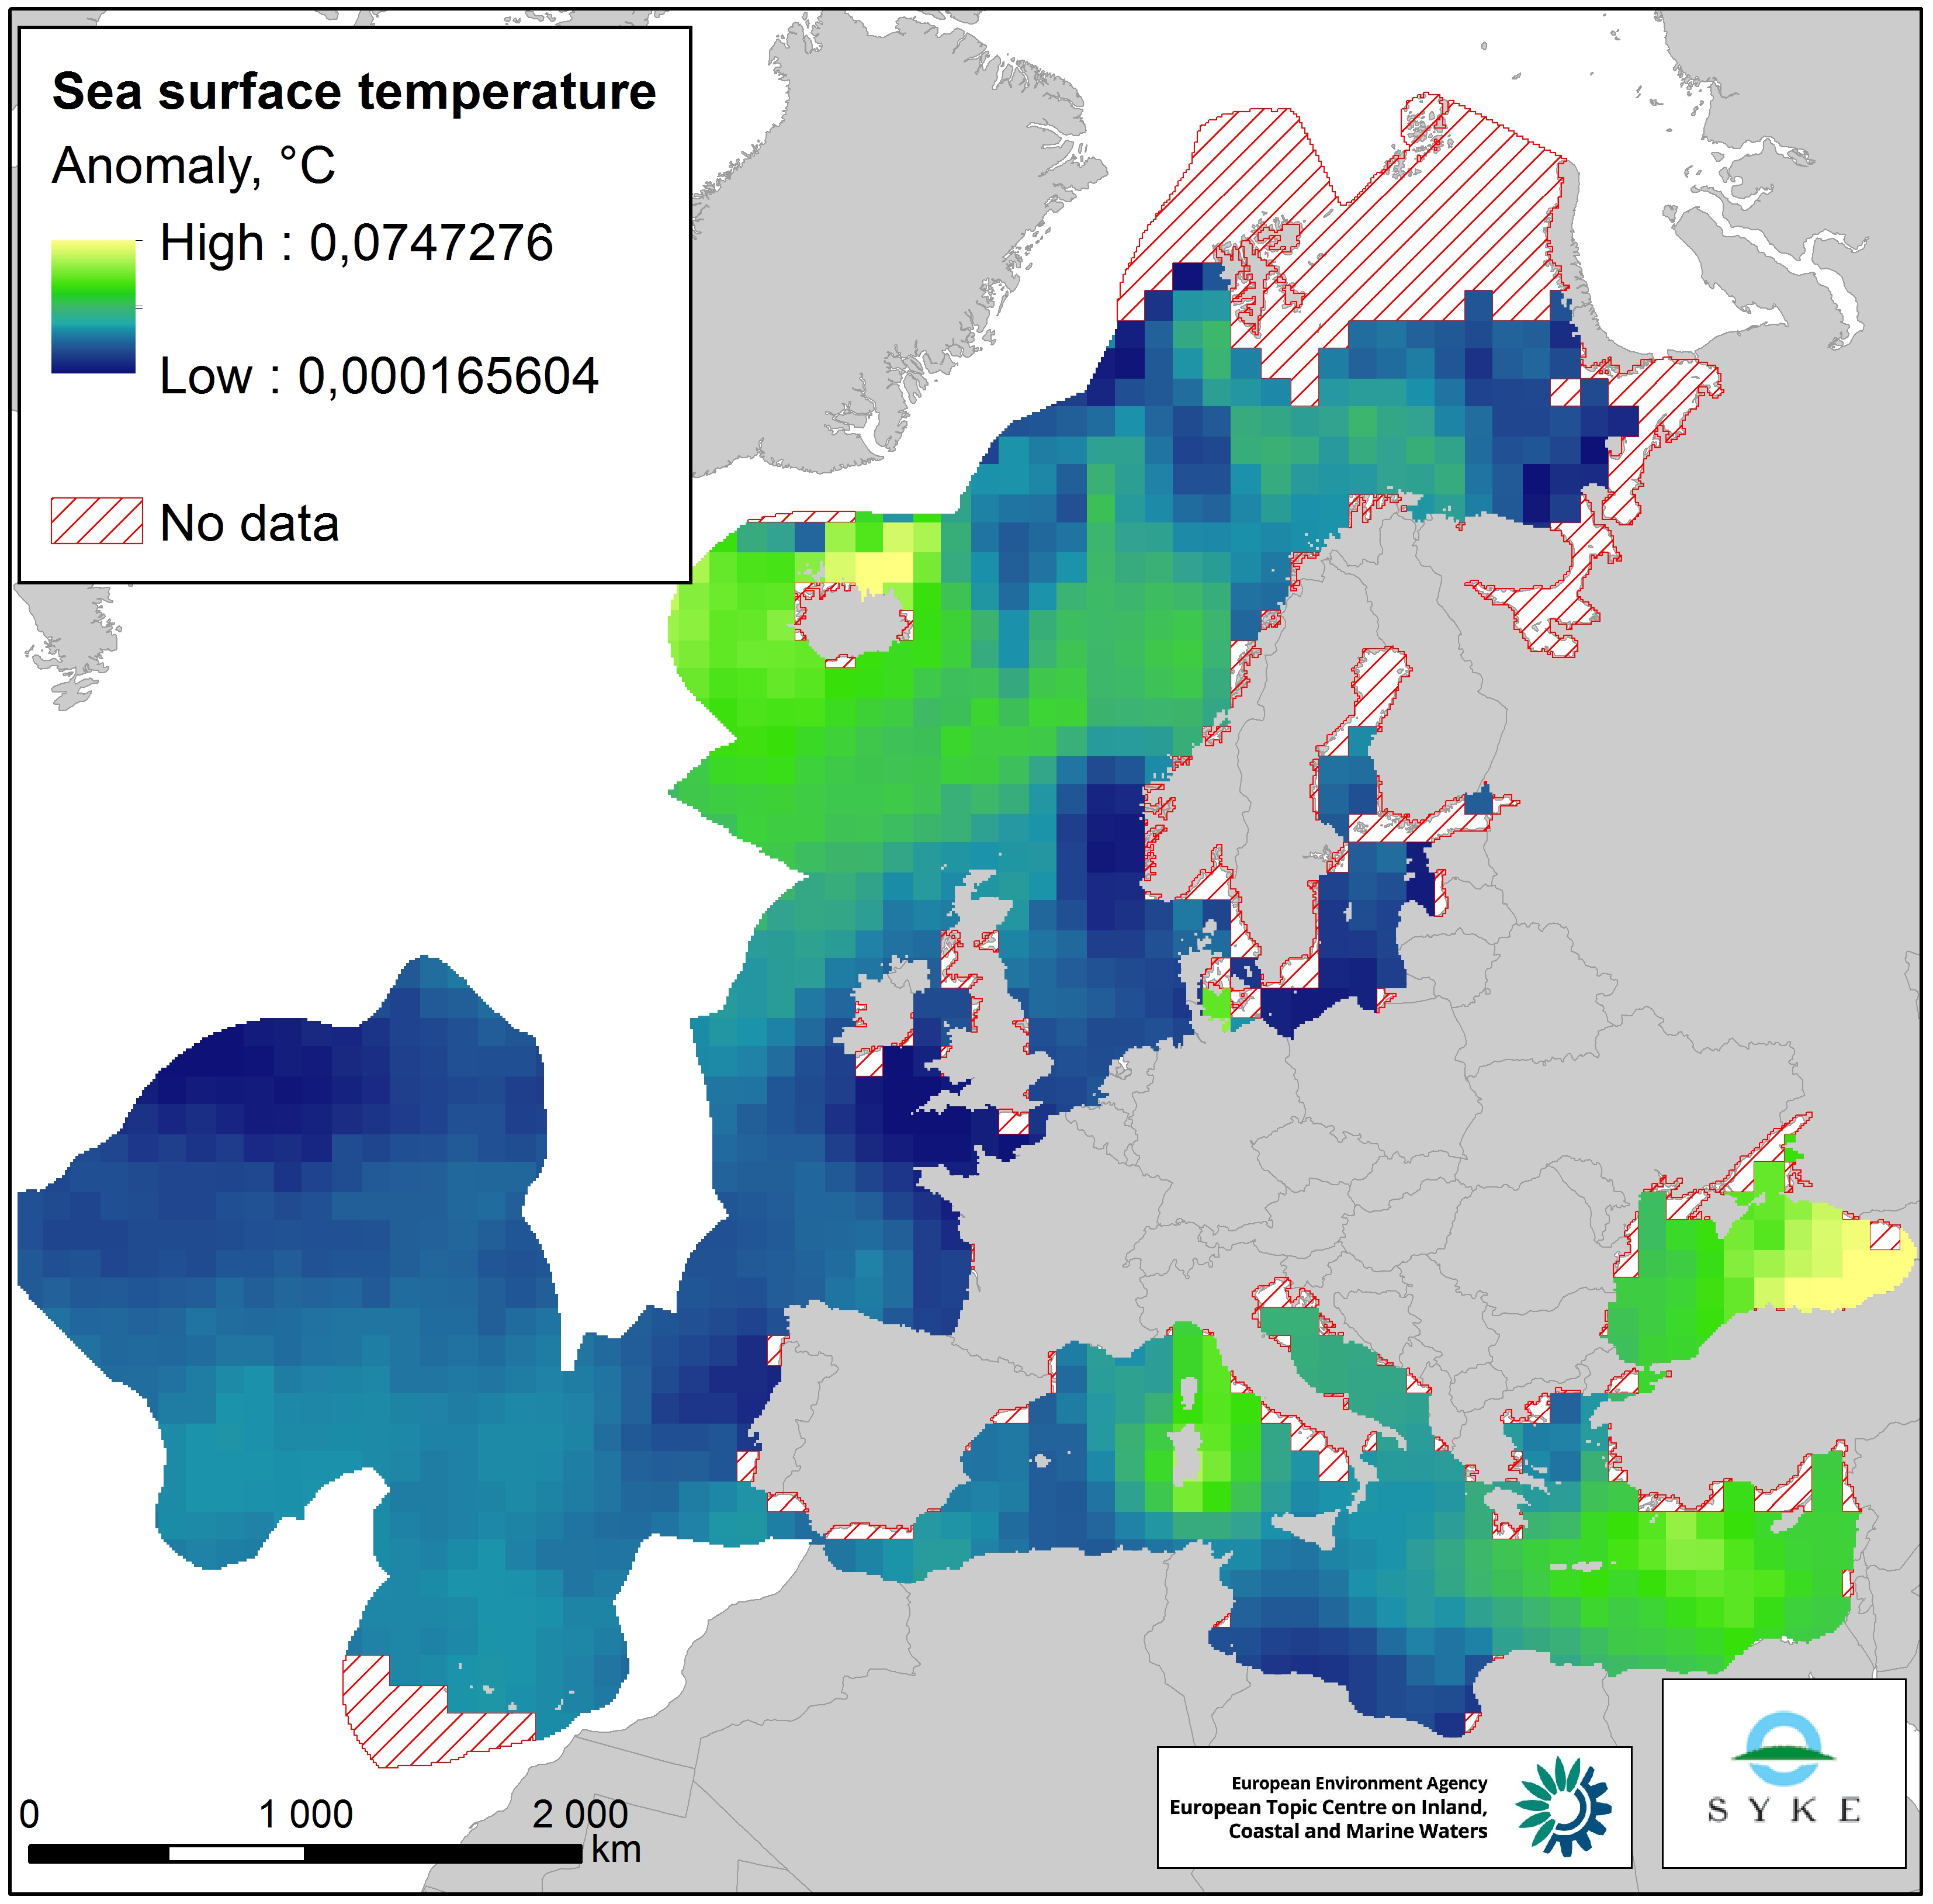
This raster dataset represents the Sea Surface Temperature (SST) anomalies, i.e. changes of sea temperatures, in the European Seas. The dataset is based on the map "Mean annual sea surface temperature trend in European seas" by Istituto Nazionale di Geofisica e Vulcanologia (INGV), which depicts the linear trend in sea surface temperature (in °C/yr) for the European seas over the past 25 years (1989-2013). Since all changes of sea temperatures can be considered to have an impact on the marine environment, the pressure layer includes absolute values of SST anomalies, i.e. negative/decreasing temperature trends were changed to positive values so that they represent a pressure. The original data was in a 1° grid format but was converted to a 100 km resolution, adapted to the EEA 10 km grid and clipped with the area of interest. This dataset has been prepared for the calculation of the combined effect index, produced for the ETC/ICM Report 4/2019 "Multiple pressures and their combined effects in Europe's seas" available on: https://www.eionet.europa.eu/etcs/etc-icm/etc-icm-report-4-2019-multiple-pressures-and-their-combined-effects-in-europes-seas-1.
-
Coastal zones are presented as a series of 10 consecutive buffers of 1km width each (towards inland). For this dataset, were treated as sea data all areas with class values of 52x (521: coastal lagoons, 522: estuaries, 523: sea and ocean) in Corine Land Cover (details in lineage).
-
This data product selects sample areas of digital bathymetry, chosen for their relevance to marine activities and data sources alternative to GEBCO. The approach for building the digital map of water depth is to use GEBCO as a baseline and look at a set of sample areas where GEBCO could be improved upon. Sample areas have also been selected to be representative of each continent bordering the Atlantic and expected future requirements. Data sources include GEBCO, EMODNET, USGS and CHS.
-
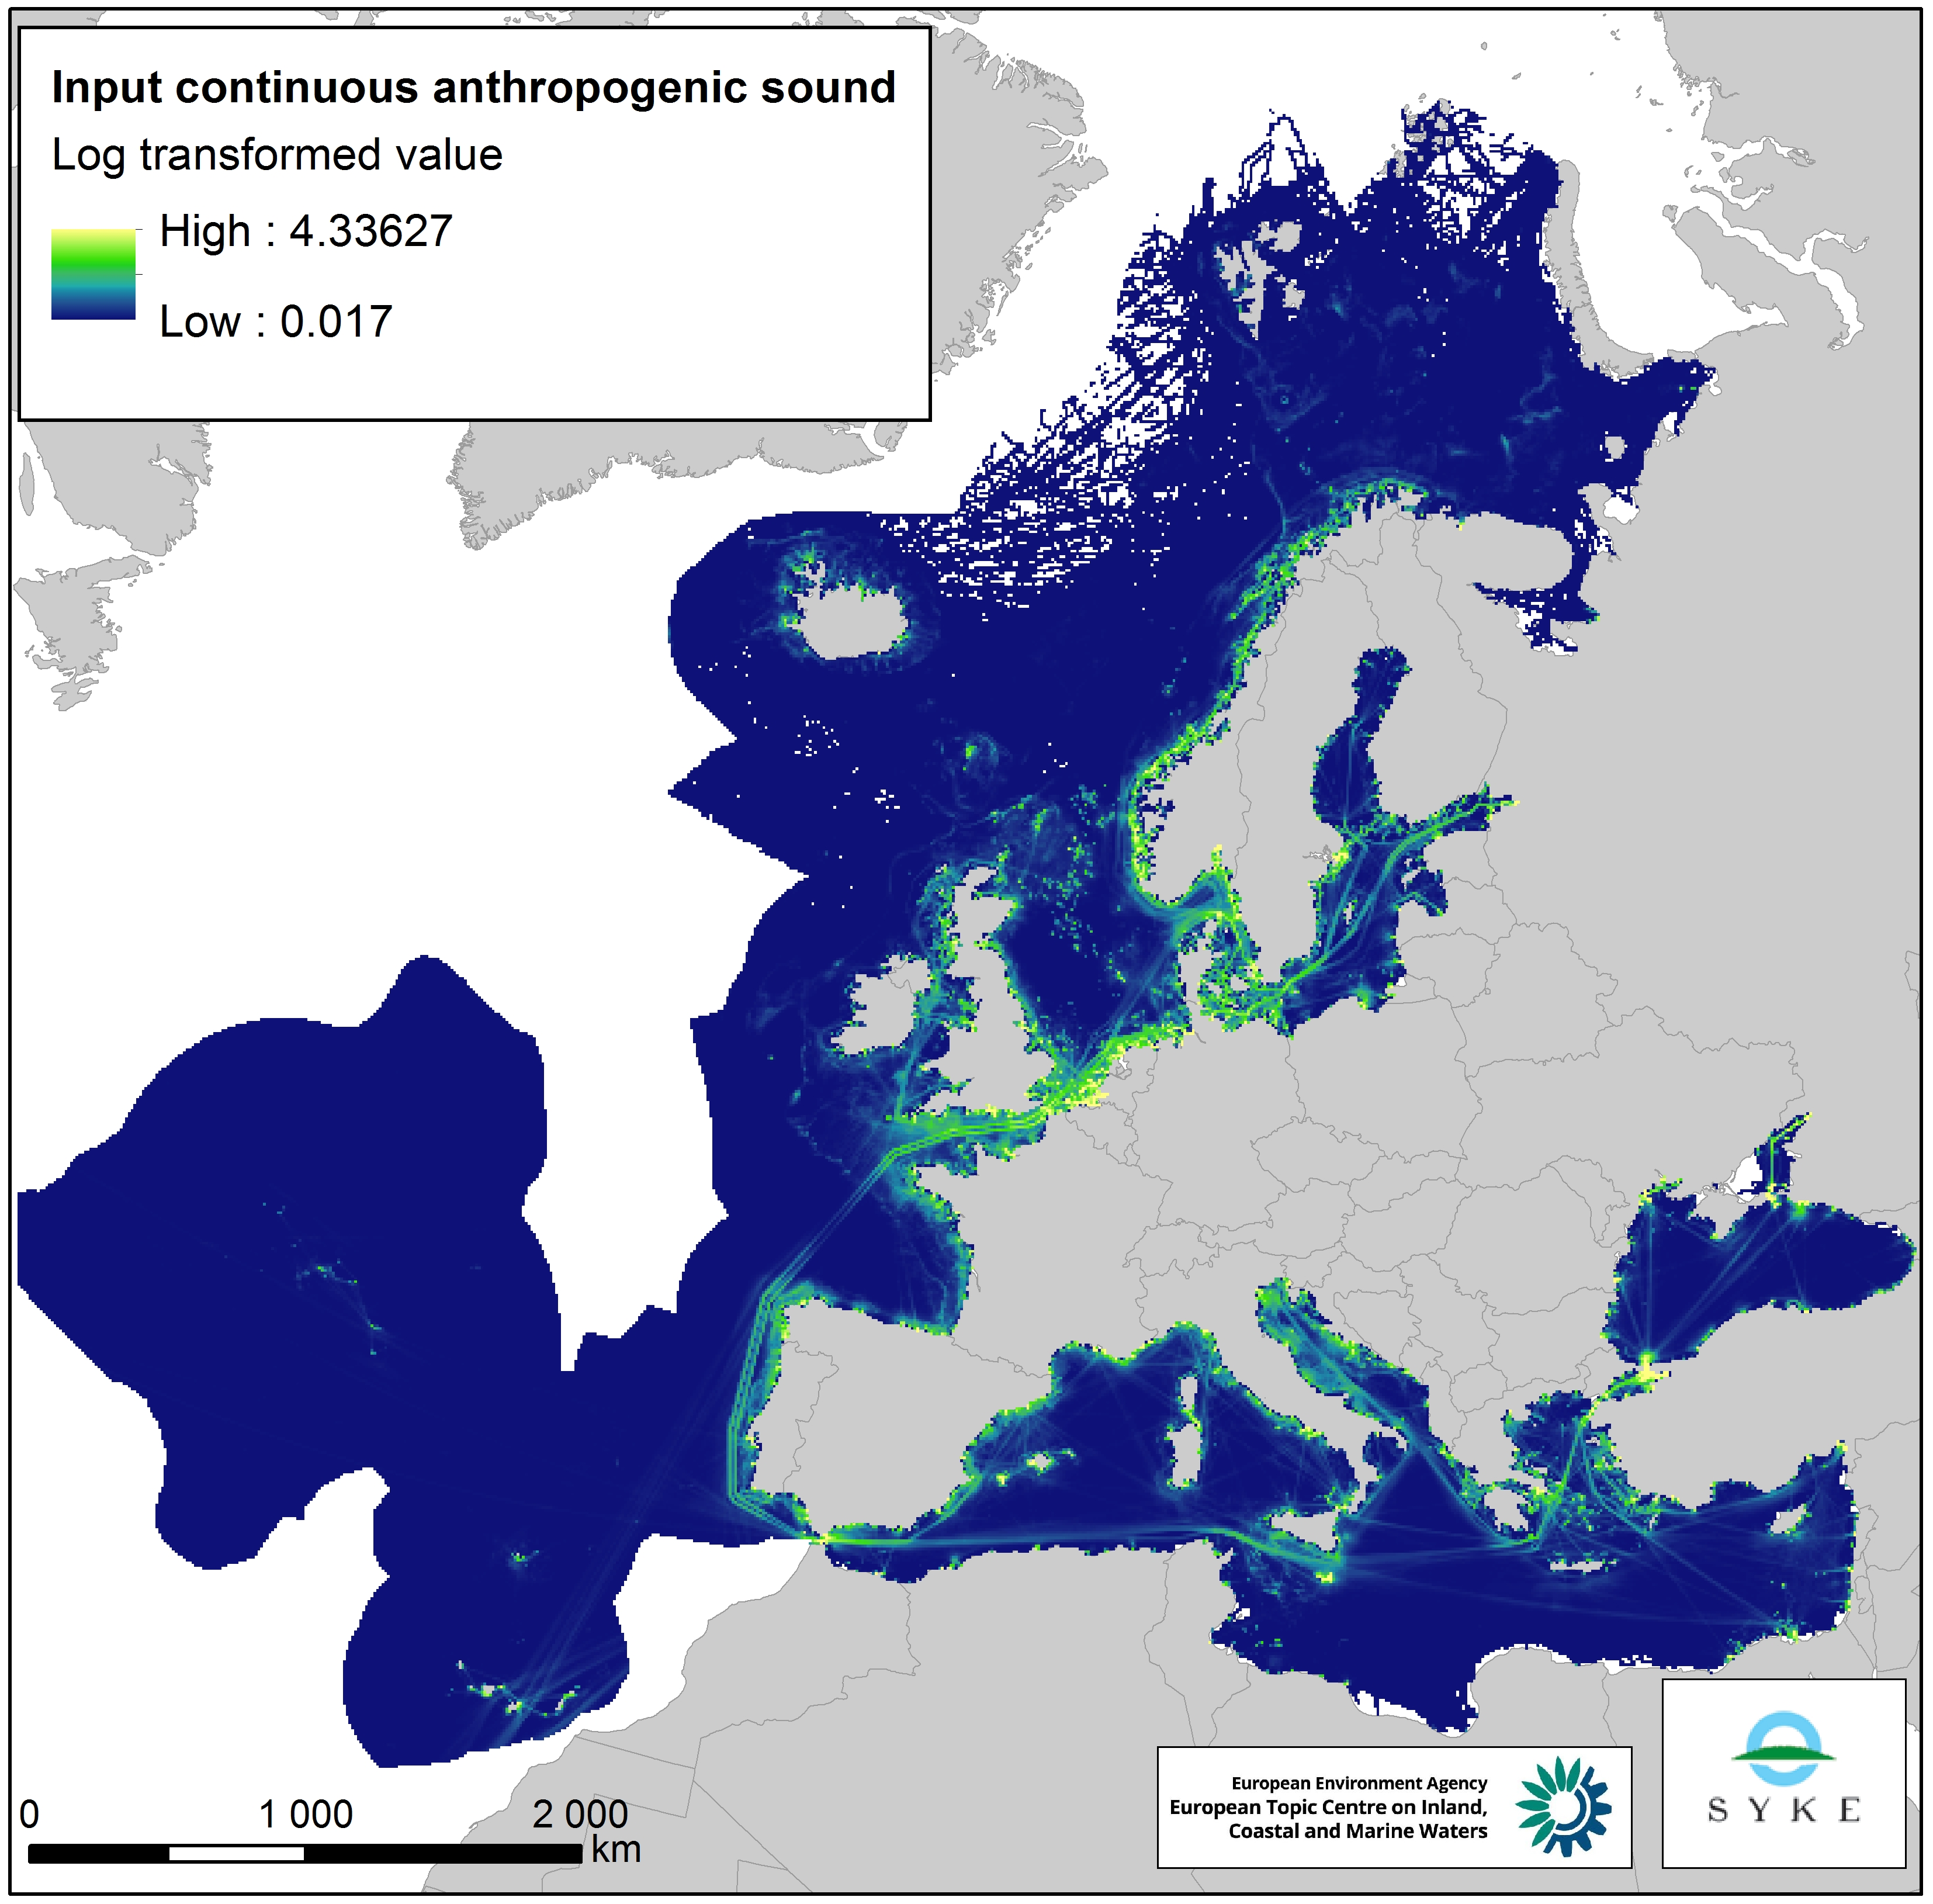
This raster dataset represents the input of continuous anthropogenic sound in the European Seas. Continuous anthropogenic underwater noise is found in the entire European marine area and is mainly produced by maritime traffic. As no thresholds for pressure have been agreed yet, even areas of low or infrequent maritime traffic are included as pressures. This dataset uses shipping density as a representation of distribution of continuous underwater noise. This dataset is based on a truncated version of the EMODnet (Automatic Identification System) AIS based vessel density dataset for 2017 (all ships, year average). The vessel density was rescaled from a 1 km to 10 km resolution (mean values) using the EEA 10 km grid. The dataset has been transformed to a logarithmic scale (ln1). This dataset has been prepared for the calculation of the combined effect index, produced for the ETC/ICM Report 4/2019 "Multiple pressures and their combined effects in Europe's seas" available on: https://www.eionet.europa.eu/etcs/etc-icm/etc-icm-report-4-2019-multiple-pressures-and-their-combined-effects-in-europes-seas-1.
-

Modelled density of the seapen Kophobelemnon stelliferum in the North East Atlantic. The Random Forest density model trained on data collected by an ROV was constrained by an ensemble of Maxent and Random Forest presence-absence model trained on a larger dataset also collected by an ROV. This species provides structural complexity in an environment where it is lacking and, thus, promotes higher biodiversity where they settle. They are vulnerable to mechanical disturbance of the sediment by fishing gear and a better understanding of their distribution will lead to better management of their population. This work was performed at the University of Plymouth in 2021.