 Catalogue PIGMA
Economy
Type of resources
Available actions
Topics
Keywords
Contact for the resource
Provided by
Years
Formats
Representation types
Update frequencies
Scale
Resolution
-
Tableau de suivi sur la perception de la taxe de séjour en 2009, 2010 et 2011 par les collectivités qui ont compétences en la matière.
-

Cette couche recense les Zones d’Activités Economiques (ZAE) présentes sur le département de la Charente. Initialement crée par Charente Développement, il s'agit d'un surfacique qui permet d'identifier précisément le contour de ces zones en se calant sur les données du Cadastre.
-

Ensemble de 2 cartes représentant d'une part l'immobilier d'entreprise existant en Bergeracois ainsi que la répartition des zones d'activités et des projets inscrits au contrat de Pays.
-
Total par commune des superficies plantées en vigne et destinées à produire du vin
-
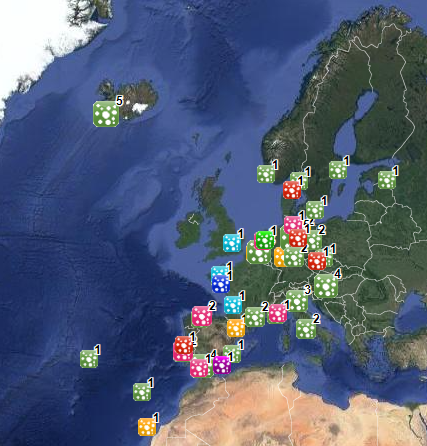
This dataset stems from the Joint Research Centre (JRC) Biomass Mandate (https://knowledge4policy.ec.europa.eu/projects-activities/jrc-biomass-mandate_en) and it is available for viewing and download on EMODnet - Human Activities web portal (www.emodnet-humanactivities.eu) and on the platform from the European Commission’s Knowledge Centre for Bioeconomy (https://knowledge4policy.ec.europa.eu/visualisation/bioeconomy-different-countries_en#algae_prod_plants). Its aim is to build a reliable database to characterize the algae sector and to support informed European policies on Blue Growth and Bioeconomy. More detailed information on the Status of the Algae Production Industry in Europe can be found in a JRC-led study published in Frontiers in Marine Science (https://publications.jrc.ec.europa.eu/repository/handle/JRC122250). Information on the location (geographic coordinates) of the production facilities, group of produced organism (macroalgae, microalgae and spirulina), production method (Fermenters, Harvesting , Photobioreactors, Open ponds, Semi Open ponds, land-based or at sea Aquaculture, Integrated multi-trophic or not) and species (see dataset) have been collected in the following countries: Austria, Belgium, Bulgaria, Croatia, Czech Republic, Denmark, Estonia, Faroe Islands, France, Germany, Greece, Greenland, Hungary, Iceland, Ireland, Italy, Latvia, the Netherlands, Norway, Portugal, Spain, Sweden, Switzerland and the UK. In November 2021, the JRC has updated the database with the latest information on the production units operational at the time.
-

Localisation et description des sentiers de randonnées (GR, PDIPR, itinérance à pied, chemin local,sans classement). Localisation et description des tronçons (accessibilité/nature du sol/état...). Bornes/mats (description/état/historique des interventions...) Mobiliers (description/état/historique des interventions...)
-
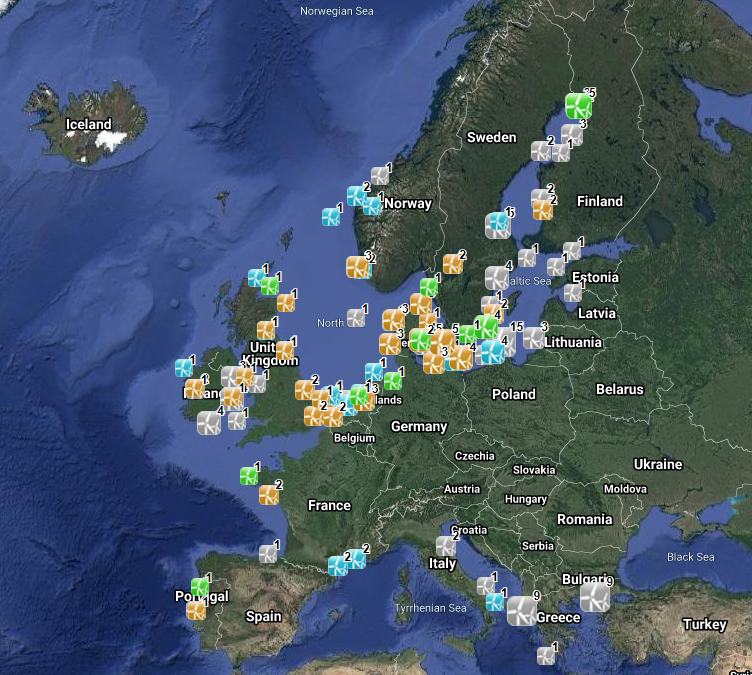
The database on offshore wind farms in the EU was created in 2014 by CETMAR for the European Marine Observation and Data Network (EMODnet). It is the result of the aggregation and harmonization of datasets provided by several sources. It is updated every year and is available for viewing and download on EMODnet Human Activities web portal (www.emodnet-humanactivities.eu). The database contains points and/or (where available) polygons representing offshore wind farms in the following countries: Belgium, Denmark, Estonia, Finland, France, Germany, Greece, Ireland, Italy, Latvia, Lithuania, Netherlands, Norway, Poland, Portugal, Spain, Sweden and United Kingdom. Each point has the following attributes (where available): Name, Nº of turbines, Status (Approved, Planned, Dismantled, Construction, Production, Test site), Country, Year, Power (MW), Distance to coast (metres) and Area (square kilometres). The distance to coast (EEA coastline shapefile) has been calculated using the UTM WGS84 Zone projected coordinate system where data fall in.
-
This data set corresponds to the global offshore wind farm boundaries with the following attributes for each project: + WindfarmId (ID of the windfarm) + Name (Name of the windfarm) + Country (Country code) + Status (Status code) + WindfarmStatus (Windfarm Status or Project Status) + StatusComments (Comments on the Windfarm Status or Project Status) + CapacityMWMin (Capacity of the windfarm - Min) + CapacityMWMax (Capacity of the windfarm - Max) + NoTurbinesMin (Number of turbines - Min) + NoTurbinesMax (Number of turbines - Max) + Comments (Comments) + TurbineMWMin (Capacity of the turbine (set-up in the windfarm) - Min) + TurbineMWMax (Capacity of the turbine (set-up in the windfarm) - Max) + OtherNames (Other name of the windfarm) + CountryName (Country where the windfarm is set) + Lat (Geographic coordinate - centre latitude) + Lon (Geographic coordinate - centre longitude) + IsEstimatedLocation (This is where we know that a project exists but we don't know its exact location.) + IsOnHold + Developers (Developer(s) of the windfarm) + Owners (Owner of the windfarm) + Operators (Operator of the windfarm) + OffshoreConstructionStarts The frequency of the database release is monthly. This data set corresponds to the release of January 2020. This data set is strictly for internal EEA use as is subjected to a commercial license. Given the limited user subscriptions available, interested users should contact the SDI Team (sdi@eea.europa.eu) to be granted access to the data set.