 Catalogue PIGMA
2020
Type of resources
Available actions
Topics
Keywords
Contact for the resource
Provided by
Years
Formats
Representation types
Update frequencies
status
Service types
Scale
Resolution
-

NAUTILOS, a Horizon 2020 Innovation Action project funded under EU’s the Future of Seas and Oceans Flagship Initiative, aims to fill in marine observation and modelling gaps for biogeochemical, biological and deep ocean physics essential ocean variables and micro-/nano-plastics, by developing a new generation of cost-effective sensors and samplers, their integration within observing platforms and deployment in large-scale demonstrations in European seas. The principles underlying NAUTILOS are those of the development, integration, validation and demonstration of new cutting-edge technologies with regards to sensors, interoperability and embedding skills. The development is always guided by the objectives of scalability, modularity, cost-effectiveness, and open-source availability of software products produced. Bringing together 21 entities from 11 European countries with multidisciplinary expertise, NAUTILOS has the fundamental aim to complement and expand current European observation tools and services, to obtain a collection of data at a much higher spatial resolution, temporal regularity and length than currently available at the European scale, and to further enable and democratize the monitoring of the marine environment to both traditional and non-traditional data users.
-
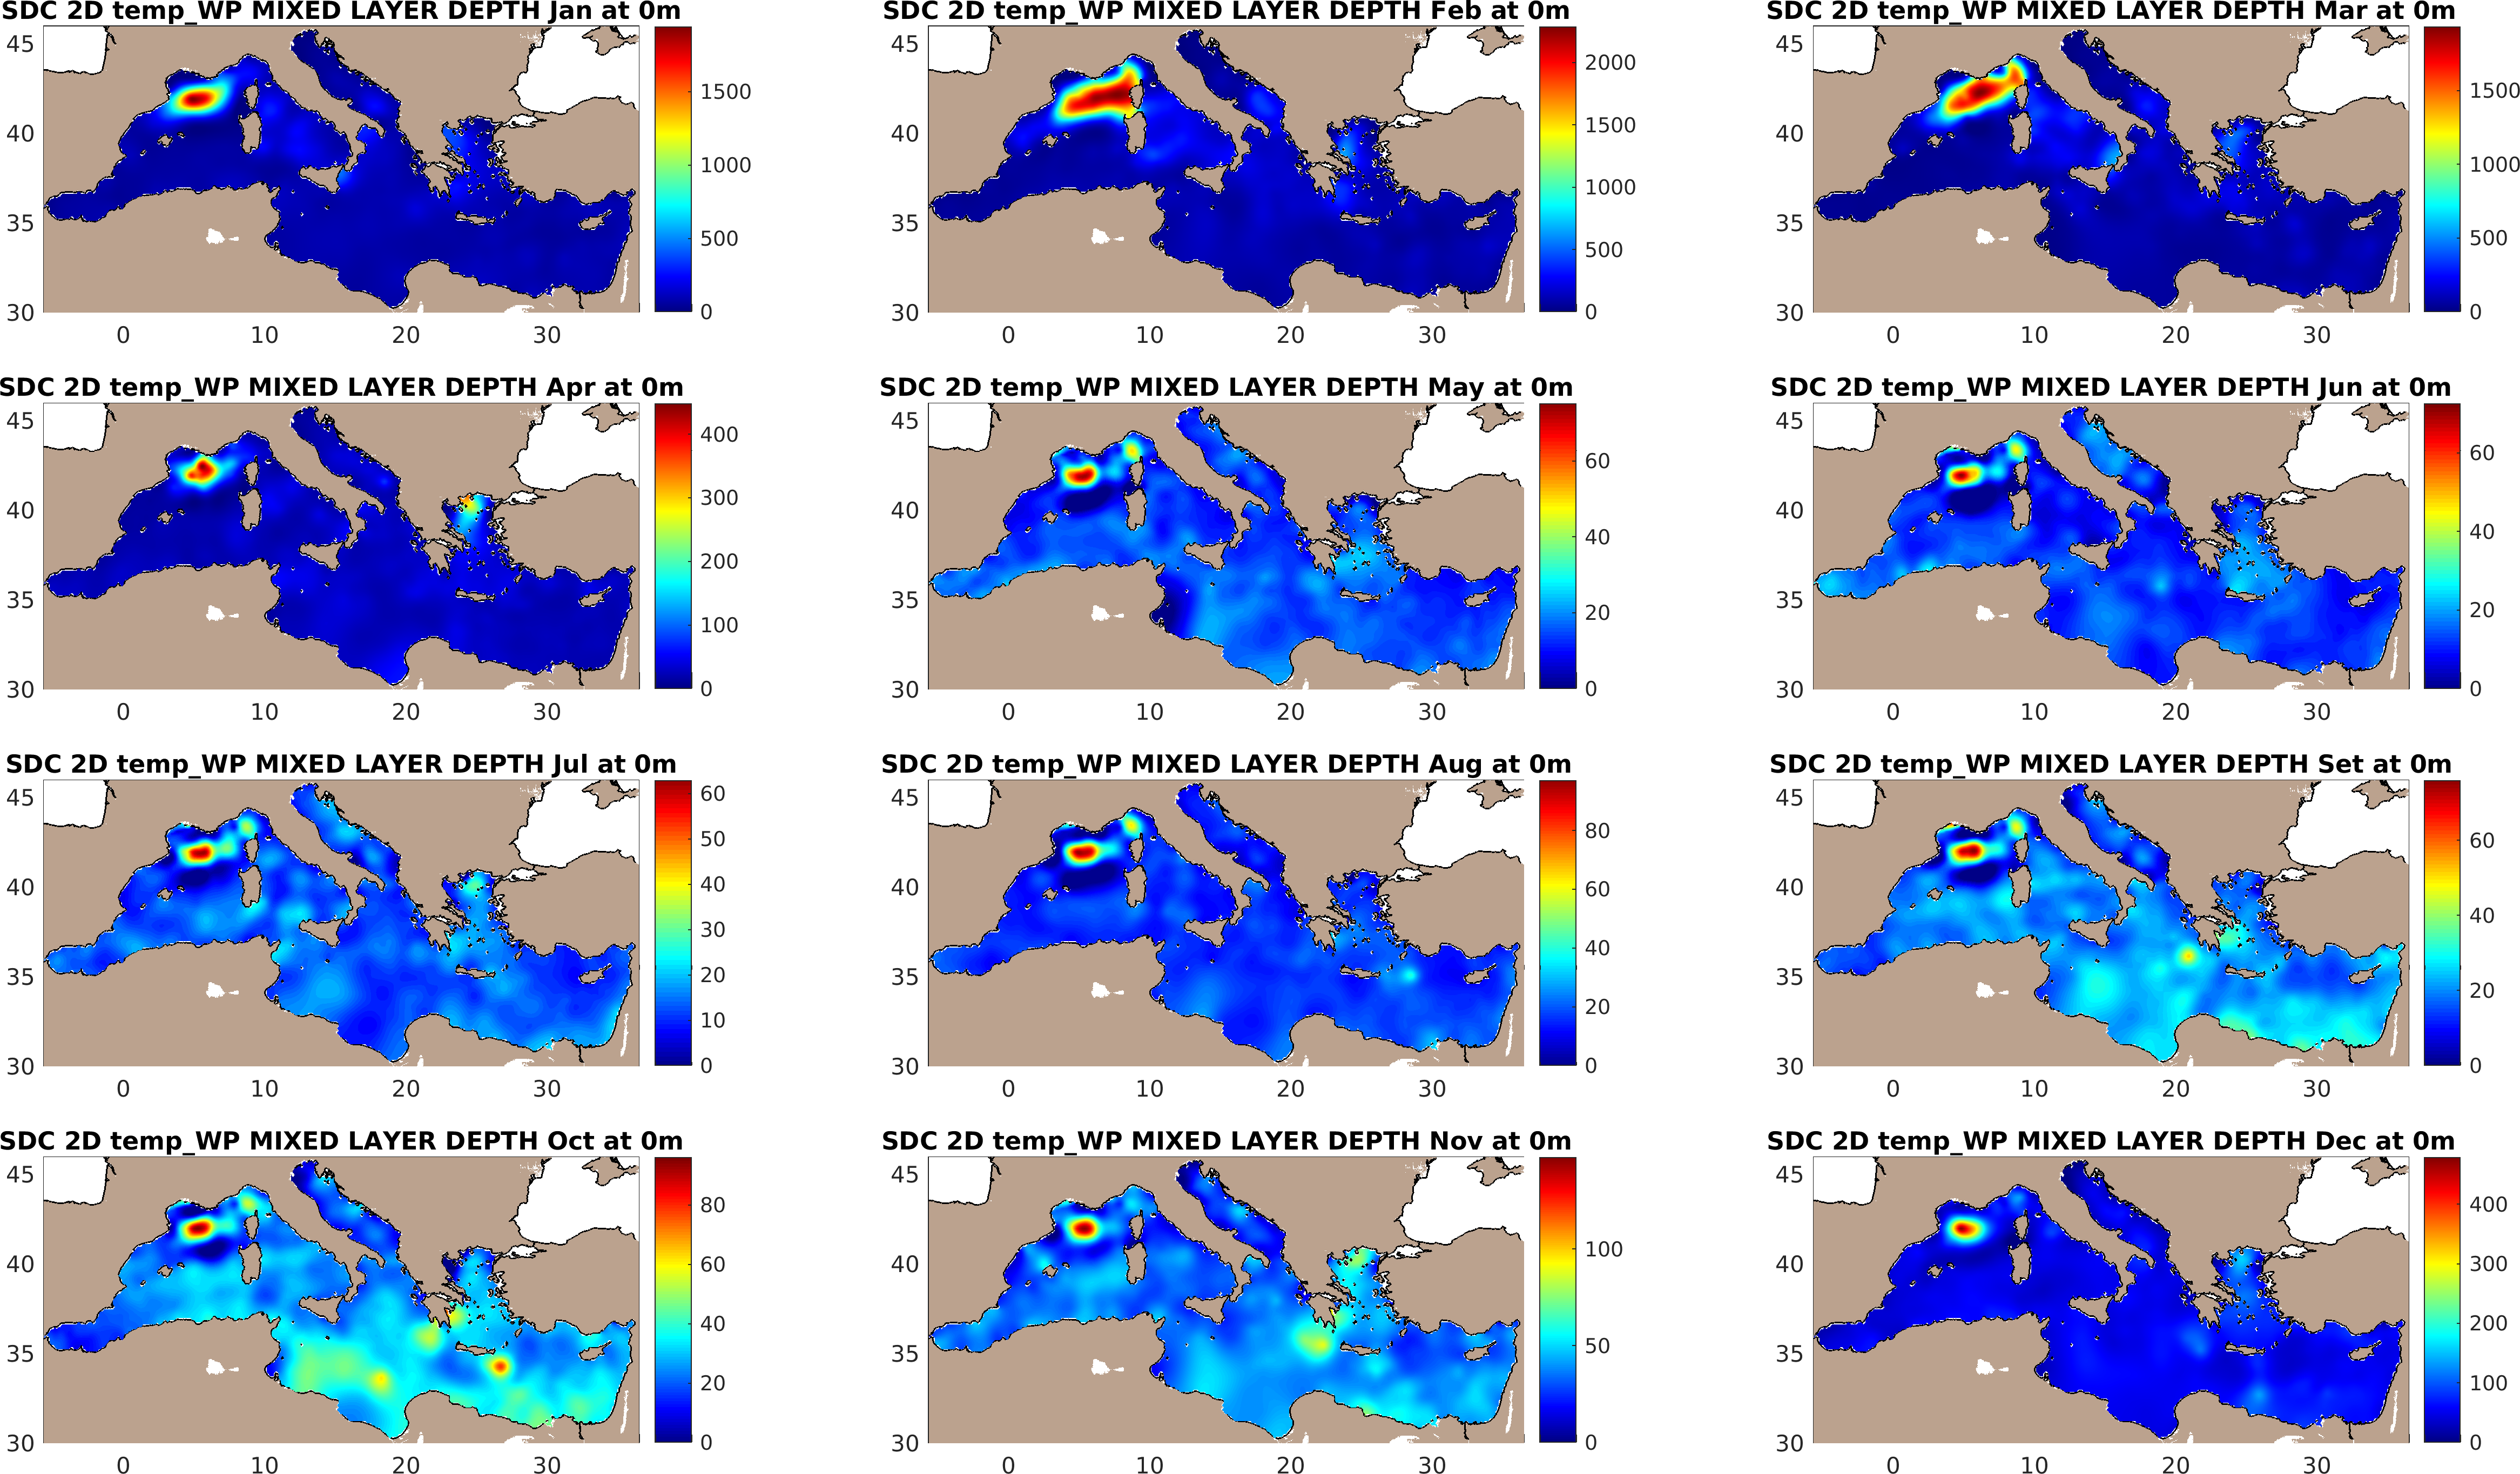
The SDC_MED_DP1 consists of Mixed Layer Depth (MLD) monthly climatology at 1/8 of degree for the Mediterranean Sea computed from an integrated dataset of collocated temperature and salinity profiles which combines data extracted from SeaDataNet infrastructure (SDC_MED_DATA_TS_V1, https://doi.org/10.12770/2698a37e-c78b-4f78-be0b-ec536c4cb4b3) and the Coriolis Ocean Dataset for Reanalysis (CORA), version 5.2 (https://archimer.ifremer.fr/doc/00595/70726/). The products comprehends three versions of MLD climatology over the 1955-2017 time period obtained computing the MLD from three different methods. A MLD climatology for the time span 1987-2017 computed with the fixed density criteria is also available. The analysis was done with the DIVAnd (Data-Interpolating Variational Analysis in n dimensions), version 2.6.1.
-

'''DEFINITION''' The Mediterranean water mass formation rates are evaluated in 4 areas as defined in the Ocean State Report issue 2 (OSR2, von Schuckmann et al., 2018) section 3.4 (Simoncelli and Pinardi, 2018): (1) the Gulf of Lions for the Western Mediterranean Deep Waters (WMDW); (2) the Southern Adriatic Sea Pit for the Eastern Mediterranean Deep Waters (EMDW); (3) the Cretan Sea for Cretan Intermediate Waters (CIW) and Cretan Deep Waters (CDW); (4) the Rhodes Gyre, the area of formation of the so-called Levantine Intermediate Waters (LIW) and Levantine Deep Waters (LDW). Annual water mass formation rates have been computed using daily mixed layer depth estimates (density criteria Δσ = 0.01 kg/m3, 10 m reference level) considering the annual maximum volume of water above mixed layer depth with potential density within or higher the specific thresholds specified in Table 1 then divided by seconds per year. Annual mean values are provided using the Mediterranean 1/24o eddy resolving reanalysis (Escudier et al. 2020, 2021). Time spans from 1987 to the year preceding the current one [-1Y], operationally extended yearly. '''CONTEXT''' The formation of intermediate and deep water masses is one of the most important processes occurring in the Mediterranean Sea, being a component of its general overturning circulation. This circulation varies at interannual and multidecadal time scales and it is composed of an upper zonal cell (Zonal Overturning Circulation) and two main meridional cells in the western and eastern Mediterranean (Pinardi and Masetti 2000). The objective is to monitor the main water mass formation events using the eddy resolving Mediterranean Sea Reanalysis (MEDSEA_MULTIYEAR_PHY_006_004, Escudier et al. 2020, 2021) and considering Pinardi et al. (2015) and Simoncelli and Pinardi (2018) as references for the methodology. The Mediterranean Sea Reanalysis can reproduce both Eastern Mediterranean Transient and Western Mediterranean Transition phenomena and catches the principal water mass formation events reported in the literature. This will permit constant monitoring of the open ocean deep convection process in the Mediterranean Sea and a better understanding of the multiple drivers of the general overturning circulation at interannual and multidecadal time scales. Deep and intermediate water formation events reveal themselves by a deep mixed layer depth distribution in four Mediterranean areas: Gulf of Lions, Southern Adriatic Sea Pit, Cretan Sea and Rhodes Gyre. '''KEY FINDINGS''' The Western Mediterranean Deep Water (WMDW) formation events in the Gulf of Lion appear to be larger after 1999 consistently with Schroeder et al. (2006, 2008) related to the Eastern Mediterranean Transient event. This modification of WMDW after 2005 has been called Western Mediterranean Transition. WMDW formation events are consistent with Somot et al. (2016) and the event in 2009 is also reported in Houpert et al. (2016). The Eastern Mediterranean Deep Water (EMDW) formation in the Southern Adriatic Pit region displays a period of water mass formation between 1988 and 1993, in agreement with Pinardi et al. (2015), in 1996, 1999 and 2000 as documented by Manca et al. (2002). Weak deep water formation in winter 2006 is confirmed by observations in Vilibić and Šantić (2008). An intense deep water formation event is detected in 2012-2013 (Gačić et al., 2014). Last years are characterized by large events starting from 2017 (Mihanovic et al., 2021). Cretan Intermediate Water formation rates present larger peaks between 1989 and 1993 with the ones in 1992 and 1993 composing the Eastern Mediterranean Transient phenomena. The Cretan Deep Water formed in 1992 and 1993 is characterized by the highest densities of the entire period in accordance with Velaoras et al. (2014). The Levantine Deep Water formation rate in the Rhode Gyre region presents the largest values between 1992 and 1993 in agreement with Kontoyiannis et al. (1999). '''DOI (product):''' https://doi.org/10.48670/mds-00318
-

'''DEFINITION''' The CMEMS NORTHWESTSHELF_OMI_tempsal_extreme_var_temp_mean_and_anomaly OMI indicator is based on the computation of the annual 99th percentile of Sea Surface Temperature (SST) from model data. Two different CMEMS products are used to compute the indicator: The North-West Shelf Multi Year Product (NWSHELF_MULTIYEAR_PHY_004_009) and the Analysis product (NORTHWESTSHELF_ANALYSIS_FORECAST_PHY_004_013). Two parameters are included on this OMI: * Map of the 99th mean percentile: It is obtained from the Multi Year Product, the annual 99th percentile is computed for each year of the product. The percentiles are temporally averaged over the whole period (1993-2019). * Anomaly of the 99th percentile in 2020: The 99th percentile of the year 2020 is computed from the Analysis product. The anomaly is obtained by subtracting the mean percentile from the 2020 percentile. This indicator is aimed at monitoring the extremes of sea surface temperature every year and at checking their variations in space. The use of percentiles instead of annual maxima, makes this extremes study less affected by individual data. This study of extreme variability was first applied to the sea level variable (Pérez Gómez et al 2016) and then extended to other essential variables, such as sea surface temperature and significant wave height (Pérez Gómez et al 2018 and Alvarez Fanjul et al., 2019). More details and a full scientific evaluation can be found in the CMEMS Ocean State report (Alvarez Fanjul et al., 2019). '''CONTEXT''' This domain comprises the North West European continental shelf where depths do not exceed 200m and deeper Atlantic waters to the North and West. For these deeper waters, the North-South temperature gradient dominates (Liu and Tanhua, 2021). Temperature over the continental shelf is affected also by the various local currents in this region and by the shallow depth of the water (Elliott et al., 1990). Atmospheric heat waves can warm the whole water column, especially in the southern North Sea, much of which is no more than 30m deep (Holt et al., 2012). Warm summertime water observed in the Norwegian trench is outflow heading North from the Baltic Sea and from the North Sea itself. '''CMEMS KEY FINDINGS''' The 99th percentile SST product can be considered to represent approximately the warmest 4 days for the sea surface in Summer. Maximum anomalies for 2020 are up to 4oC warmer than the 1993-2019 average in the western approaches, Celtic and Irish Seas, English Channel and the southern North Sea. For the atmosphere, Summer 2020 was exceptionally warm and sunny in southern UK (Kendon et al., 2021), with heatwaves in June and August. Further north in the UK, the atmosphere was closer to long-term average temperatures. Overall, the 99th percentile SST anomalies show a similar pattern, with the exceptional warm anomalies in the south of the domain. Note: The key findings will be updated annually in November, in line with OMI evolutions. '''DOI (product)''' https://doi.org/10.48670/moi-00273
-
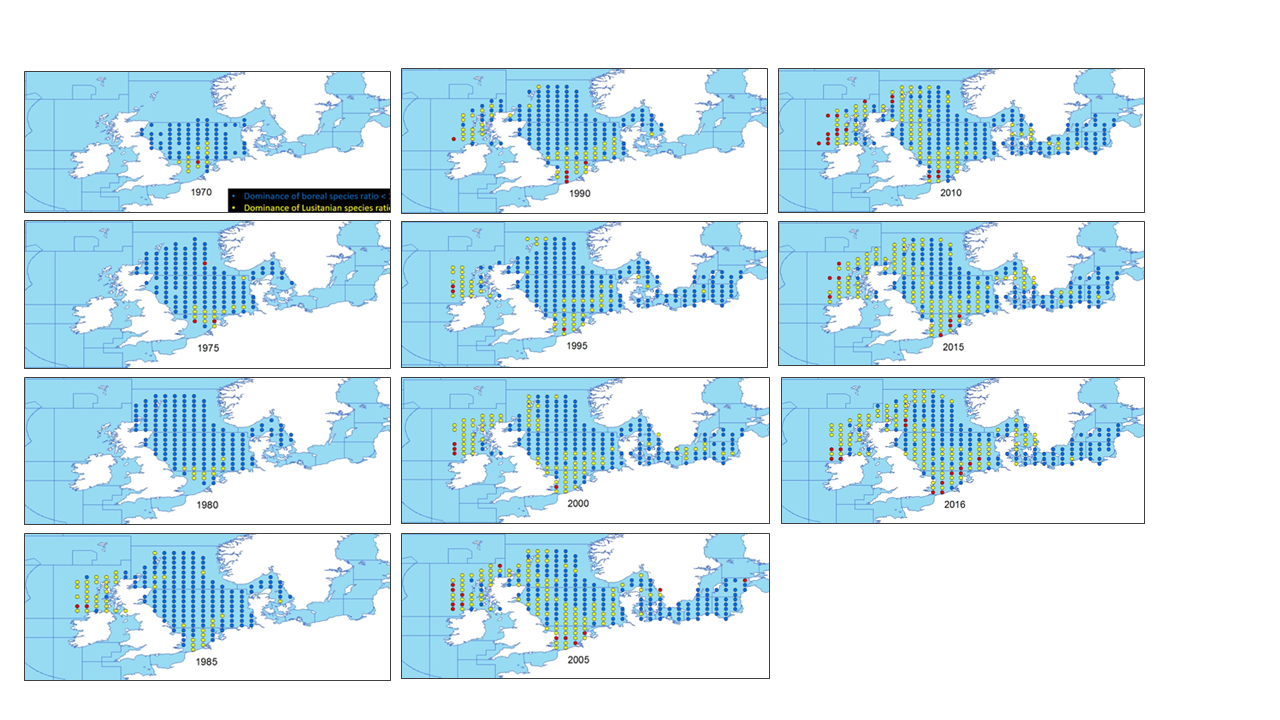
This metadata describes the ICES data on the temporal development of the Lusitanian/Boreal species ratio in the period from 19657 to 2016. Key message: The ratio between the number of Lusitanian (warm-favouring) and Boreal (cool-favouring) species are significantly increasing in several North-East Atlantic marine areas whereas there is no significant changes in all the southern areas. Changes in ratios are most apparent in the North Sea, Irish Sea and West of Scotland. Furthermore, it seems that Lusitanian species have not spread in all northward directions, but have followed two particular routes, through the English Channel and north around Scotland Blue dots indicates L/B ratios below 1 (dominance of Boreal species) Yellow dots indicates L/B ratios >=1 and <2 (dominance of Lusitanian species) Red dots indicates L/B ratios >=2 (high dominance of Lusitanian species) The dataset is derived from the ICES data portal 'DATRAS' (the Database of Trawl Surveys). DATRAS is an online database of trawl surveys with access to standard data products. DATRAS stores data collected primarily from bottom trawl fish surveys coordinated by ICES expert groups. The survey data are covering the Baltic Sea, Skagerrak, Kattegat, North Sea, English Channel, Celtic Sea, Irish Sea, Bay of Biscay and the eastern Atlantic from the Shetlands to Gibraltar. At present, there are more than 56 years of continuous time series data in DATRAS, and survey data are continuously updated by national institutions. The dataset has been used in the EEA Indicator "Changes in fish distribution in European seas" https://www.eea.europa.eu/data-and-maps/indicators/fish-distribution-shifts/assessment-1. The dataset has been used for this static map: https://www.eea.europa.eu/en/analysis/indicators/changes-in-fish-distribution-in/temporal-development-of-the-ratio
-
Level 3, four times a day, sub-skin Sea Surface Temperature derived from AVHRR on Metop satellites and VIIRS or AVHRR on NOAA and NPP satellites, over North Atlantic and European Seas and re-projected on a polar stereographic at 2 km resolution, in GHRSST compliant netCDF format. This catalogue entry presents NOAA-20 North Atlantic Regional Sea Surface Temperature. SST is retrieved from infrared channels using a multispectral algorithm and a cloud mask. Atmospheric profiles of water vapor and temperature from a numerical weather prediction model, Sea Surface Temperature from an analysis, together with a radiative transfer model, are used to correct the multispectral algorithm for regional and seasonal biases due to changing atmospheric conditions. The quality of the products is monitored regularly by daily comparison of the satellite estimates against buoy measurements. The product format is compliant with the GHRSST Data Specification (GDS) version 2.Users are advised to use data only with quality levels 3,4 and 5.
-

'''DEFINITION''' The CMEMS MEDSEA_OMI_tempsal_extreme_var_temp_mean_and_anomaly OMI indicator is based on the computation of the annual 99th percentile of Sea Surface Temperature (SST) from model data. Two different CMEMS products are used to compute the indicator: The Iberia-Biscay-Ireland Multi Year Product (MEDSEA_MULTIYEAR_PHY_006_004) and the Analysis product (MEDSEA_ANALYSISFORECAST_PHY_006_013). Two parameters have been considered for this OMI: * Map of the 99th mean percentile: It is obtained from the Multi Year Product, the annual 99th percentile is computed for each year of the product. The percentiles are temporally averaged over the whole period (1987-2019). * Anomaly of the 99th percentile in 2020: The 99th percentile of the year 2020 is computed from the Near Real Time product. The anomaly is obtained by subtracting the mean percentile from the 2020 percentile. This indicator is aimed at monitoring the extremes of sea surface temperature every year and at checking their variations in space. The use of percentiles instead of annual maxima, makes this extremes study less affected by individual data. This study of extreme variability was first applied to the sea level variable (Pérez Gómez et al 2016) and then extended to other essential variables, such as sea surface temperature and significant wave height (Pérez Gómez et al 2018 and Alvarez Fanjul et al., 2019). More details and a full scientific evaluation can be found in the CMEMS Ocean State report (Alvarez Fanjul et al., 2019). '''CONTEXT''' The Sea Surface Temperature is one of the Essential Ocean Variables, hence the monitoring of this variable is of key importance, since its variations can affect the ocean circulation, marine ecosystems, and ocean-atmosphere exchange processes. As the oceans continuously interact with the atmosphere, trends of sea surface temperature can also have an effect on the global climate. In recent decades (from mid ‘80s) the Mediterranean Sea showed a trend of increasing temperatures (Ducrocq et al., 2016), which has been observed also by means of the CMEMS SST_MED_SST_L4_REP_OBSERVATIONS_010_021 satellite product and reported in the following CMEMS OMI: MEDSEA_OMI_TEMPSAL_sst_area_averaged_anomalies and MEDSEA_OMI_TEMPSAL_sst_trend. The Mediterranean Sea is a semi-enclosed sea characterized by an annual average surface temperature which varies horizontally from ~14°C in the Northwestern part of the basin to ~23°C in the Southeastern areas. Large-scale temperature variations in the upper layers are mainly related to the heat exchange with the atmosphere and surrounding oceanic regions. The Mediterranean Sea annual 99th percentile presents a significant interannual and multidecadal variability with a significant increase starting from the 80’s as shown in Marbà et al. (2015) which is also in good agreement with the multidecadal change of the mean SST reported in Mariotti et al. (2012). Moreover the spatial variability of the SST 99th percentile shows large differences at regional scale (Darmariaki et al., 2019; Pastor et al. 2018). '''CMEMS KEY FINDINGS''' The Mediterranean mean Sea Surface Temperature 99th percentile evaluated in the period 1987-2019 (upper panel) presents highest values (~ 28-30 °C) in the eastern Mediterranean-Levantine basin and along the Tunisian coasts especially in the area of the Gulf of Gabes, while the lowest (~ 23–25 °C) are found in the Gulf of Lyon (a deep water formation area), in the Alboran Sea (affected by incoming Atlantic waters) and the eastern part of the Aegean Sea (an upwelling region). These results are in agreement with previous findings in Darmariaki et al. (2019) and Pastor et al. (2018) and are consistent with the ones presented in CMEMS OSR3 (Alvarez Fanjul et al., 2019) for the period 1993-2016. The 2020 Sea Surface Temperature 99th percentile anomaly map (bottom panel) shows a general positive pattern up to +3°C in the North-West Mediterranean area while colder anomalies are visible in the Gulf of Lion and North Aegean Sea . This Ocean Monitoring Indicator confirms the continuous warming of the SST and in particular it shows that the year 2020 is characterized by an overall increase of the extreme Sea Surface Temperature values in almost the whole domain with respect to the reference period. This finding can be probably affected by the different dataset used to evaluate this anomaly map: the 2020 Sea Surface Temperature 99th percentile derived from the Near Real Time Analysis product compared to the mean (1987-2019) Sea Surface Temperature 99th percentile evaluated from the Reanalysis product which, among the others, is characterized by different atmospheric forcing). Note: The key findings will be updated annually in November, in line with OMI evolutions. '''DOI (product):''' https://doi.org/10.48670/moi-00266
-

The technologies developed will expand our knowledge of the ocean’s interconnected systems and provide tangible benefits to the industries that rely on them, such as fisheries and aquaculture. The data generated will also support conservation initiatives and provide vital information to policy makers. The future impact of these valuable technologies relies on their accessibility. Therefore, TechOceanS technology pilots will be low-cost and place minimal demands on existing infrastructure, allowing them to be made available for use by all countries regardless of resources. TechOceanS will also work with the IOC-UNESCO to develop “ocean best practices” standards for training and monitoring of metrology and ocean systems.
-

Metagenomic analysis of clams from Sanaga river in Cameroon to describe the virome
-
This dataset is the coastal zone land surface region from Europe, derived from the coastline towards inland, as a series of 10 consecutive buffers of 1km width each. The coastline is defined by the extent of the Corine Land Cover 2018 (raster 100m) version 20 accounting layer. In this version all Corine Land Cover pixels with a value of 523, corresponding to sea and oceans, were considered as non-land surface and thus were excluded from the buffer zone.