 Catalogue PIGMA
2017
Type of resources
Available actions
Topics
Keywords
Contact for the resource
Provided by
Years
Formats
Representation types
Update frequencies
status
Service types
Scale
Resolution
-
Temporal series (annual mean values) and Long term Average (LTA) of water discharge for each river mouth where in situ data is available. Different sources can be mixed if any.
-
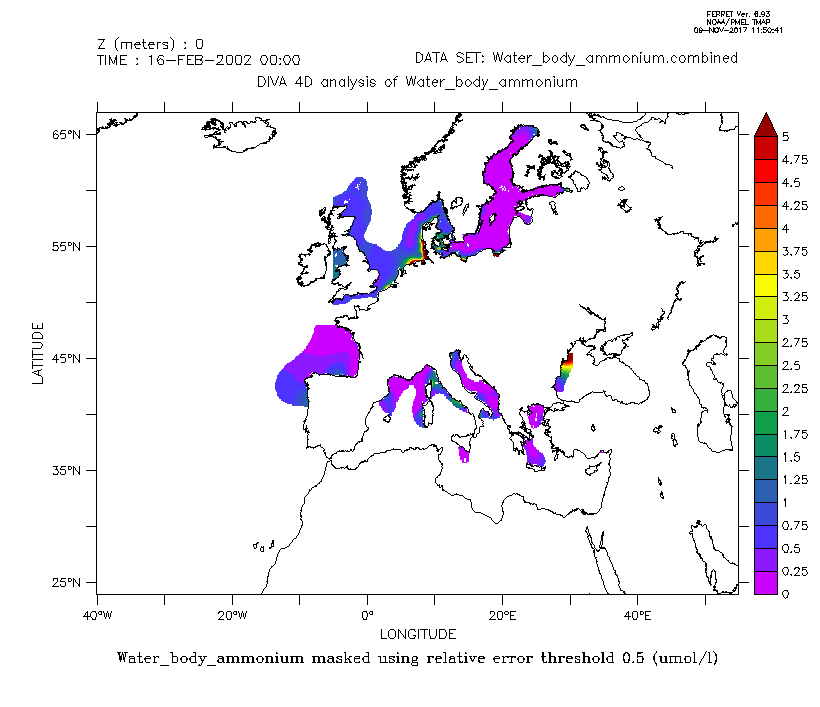
Combined product of Water body ammonium based on DIVA 4D 10-year analysis on five regions : Northeast Atlantic Ocean, North Sea, Baltic Sea, Black Sea, Mediterranean Sea. The boundaries and overlapping zones between these five regions were filtered to avoid any unrealistic spatial discontinuities. This combined Water body ammonium product is masked using the relative error threshold 0.5. Units: umol/l.
-
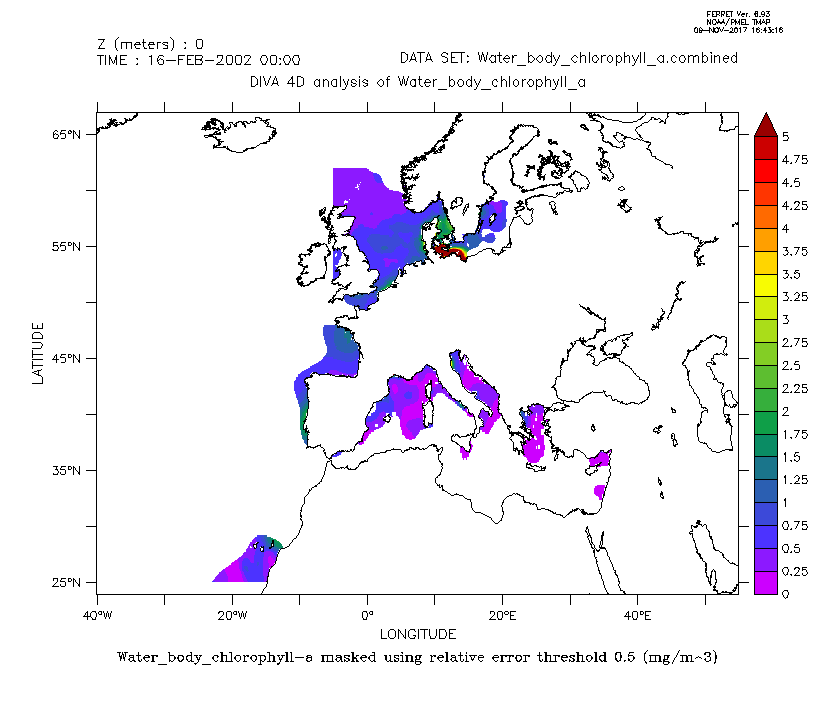
Combined product of Water body chlorophyll a based on DIVA 4D 10-year analysis on five regions : Northeast Atlantic Ocean, North Sea, Baltic Sea, Black Sea, Mediterranean Sea. The boundaries and overlapping zones between these five regions were filtered to avoid any unrealistic spatial discontinuities. This combined Water body chlorophyll a product is masked using the relative error threshold 0.5. Units: mg/m^3. Created by 'University of Liege, GeoHydrodynamics and Environment Research (ULg-GHER)'.
-
The EuroMapApp task of the AtlantOS project aims to integrate Europe’s existing and future bathymetric data sets from the Atlantic Ocean into a seamless whole and put these results into a widely accessible format allowing immediate visualization of the seafloor for the specialist and non-specialist user alike. The partner institutions are GEOMAR, Ifremer, NIOZ, and NERC-BODC.
-
L'État a confié à l'IGN le développement du référentiel à grande échelle (RGE). Pour ce faire, il fait appel à ses moyens propres ainsi qu’à des partenariats avec des producteurs principalement de la sphère publique. Le RGE est constitué de 5 composantes: - orthophotographique (BD ORTHO), - topographique (BD TOPO), - adresse (BD adresse), - parcellaire (BD parcellaire) - et altimétrique (RGE ALTI). Remarque : seules les BD TOPO thème hydrographique, BD ORTHO 5m, BD ORTHO 50 cm sont sous Licence Ouverte. Les autres données du RGE sont soumises aux licences IGN. ----- Etat de la disponibilité de la donnée (sous Licence Ouverte): - Data.gouv : les BD TOPO thème hydrographique, BD ORTHO 5m, BD ORTHO 50 cm (pour certains départements) sont accessibles sous format shape, xml et htlm. Mise à jour irrégulière. - PIGMA : données BD ORTHO 50 cm (2015) et BD TOPO v2.2 (2016) accessibles au format shape sous licence IGN. Aucune mise à jour. - Géocatalogue : données BD ORTHO v2 (2013) au format Tif et BD TOPO v2.1 (2015) au format shape, MIF/MID accessibles sous licence IGN. Aucune mise à jour. - IGN : renvoi direct au site IGN où les données sont téléchargeables au format JPEG et shape sous licence IGN. Mise à jour irrégulière.
-
Temporal series (annual mean values) and long term average (LTA) of temperature for each river mouth.
-
Ce jeu de données recense les communes du département de la Gironde suivies pour le Moustique Tigre.
-
Le Répertoire National des Associations (RNA) contient l’ensemble des associations relevant de la loi 1901, à savoir toutes les associations de France, dont le siège est déclaré en métropole ou dans les départements d’outre-mer, sauf dans les départements de la Moselle, du Bas-Rhin et du Haut-Rhin, qui relèvent du régime du Concordat. Le RNA contient également les associations reconnues d’utilité publique (dites "ARUP"). Les associations relevant de la loi 1901 sont déclarées en préfecture ou en sous-préfecture (au greffe des associations) : la création et les changements de statuts, tels que la modification du nom, du siège, des dirigeants, etc. doivent être déclarés et sont mis à jour dans la base du RNA. La mise à jour est effective une fois les données validées par le greffe ou suite à la publication au Journal officiel des associations et des fondations d’entreprise (JOAFE) d’une création, d’une dissolution (obligatoire) ou d’un changement de situation (publication au JOAFE non obligatoires). --- Etat de disponibilité de la donnée : - Data.gouv : donnée téléchargeable au format csv et mise à jour mensuelle.
-
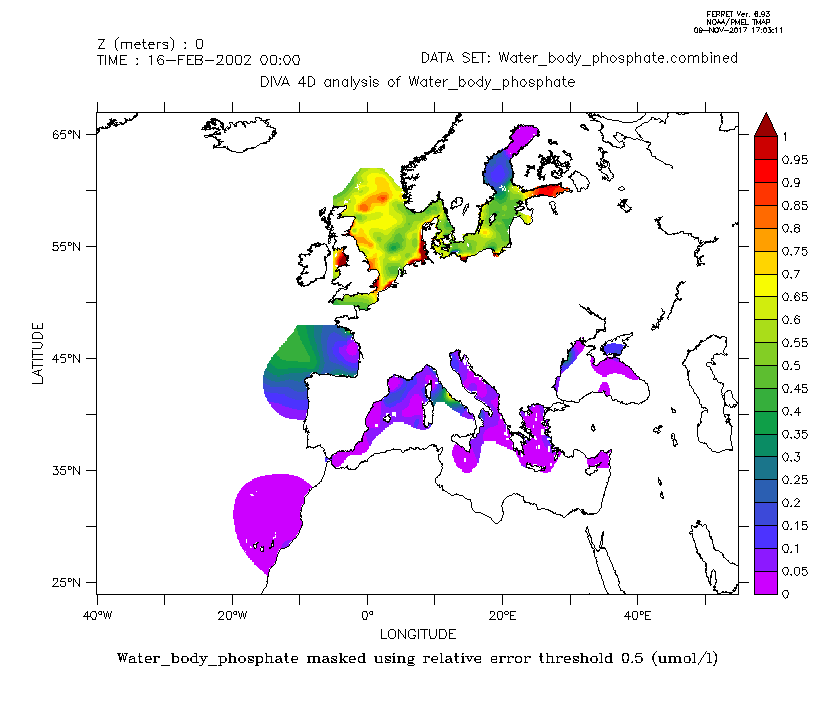
Combined product of Water body phosphate based on DIVA 4D 10-year analysis on five regions : Northeast Atlantic Ocean, North Sea, Baltic Sea, Black Sea, Mediterranean Sea. The boundaries and overlapping zones between these five regions were filtered to avoid any unrealistic spatial discontinuities. This combined water body phosphate product is masked using the relative error threshold 0.5. Units: umol/l
-

Gestion de la taxe de séjour des Établissements Touristiques aux réels (montant/suivi déclaration/suivi facturation) à l'échelle des communautés de communes.