 Catalogue PIGMA
CDS-AVISO
Type of resources
Available actions
Topics
Keywords
Contact for the resource
Provided by
Years
Formats
Representation types
status
Resolution
-
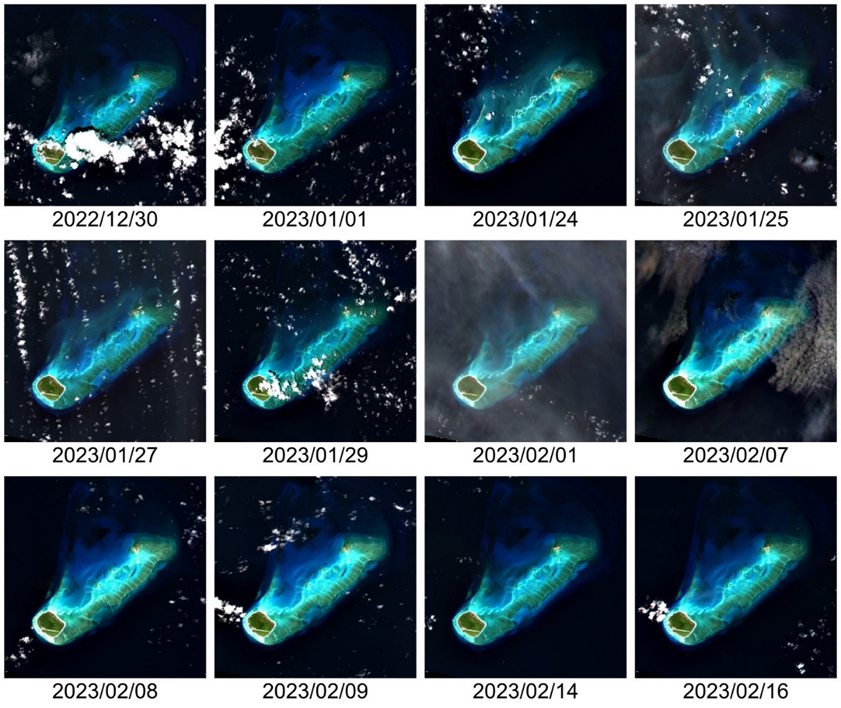
This Level 2 product provides marine reflectances from the VENµS mission, processed with the Polymer algorithm, on a subset of sites with coastal or inland areas. VENµS (Vegetation and Environment monitoring on a New Micro-Satellite) is a Franco-Israeli satellite launched in 2017, dedicated to the fine and regular monitoring of terrestrial vegetation, in particular cultivated areas, forests, protected natural areas, etc. The images acquired in 12 spectral bands by a camera provided by CNES, on a selection of about one hundred scientific sites spread over the planet, are of high spatial (5 m) and temporal resolution. The lifetime of the VENµS satellite has been divided into two phases: a first phase VM1 at an altitude of 720 km with a 2-day revisit, a native spatial resolution of 5.3 m and a swath of 27.6 km from August 2017 to November 2020, and a second phase VM5 at an altitude of 560 km with a daily revisit, a native spatial resolution of 4.1 m and a swath of 21.3 km from March 2022 to July 2024. VENµS is the first sensor on board an orbiting satellite to combine such revisit frequency and spatial finesse for vegetation monitoring. A subset of sites with coastal areas or inland waters have been identified to generate Level 2 data dedicated to marine reflectance. The geographical areas covered are given through a kmz file, see below to download it. This Level 2 data product has been processed using the Polymer algorithm developed by Hygeos (https://hygeos.com/en/polymer/) and provides marine reflectances for the VENµS bands from 420 to 865 nm. These reflectances, without units, include a bidirectional normalization for the Sun at nadir and the observer at nadir. VENµS data products (Level-1, Level-2 and Level-3) are primarily generated with the MAJA algorithm, further information can be found on THEIA website: https://www.theia-land.fr/en/product/venus/
-

The CDR-derived Wet Tropospheric Correction (WTC) Product V2 is generated from the Level-2+ along-track altimetry products version 2024 (L2P 2024) distributed by AVISO+ (www.aviso.altimetry.fr). It provides a long-term, homogenized estimation of the wet tropospheric correction based on Climate Data Records (CDRs) of atmospheric water vapour combined with high frequencies MWR data. Two independent CDRs datasets are used: - REMSS V7R2 (coverage until 2022) https://www.remss.com/measurements/atmospheric-water-vapor/tpw-1-deg-product/ - HOAPS V5 precursor CDR from EUMETSAT CM SAF (coverage until 2020) HOAPS V4/V5 data available via https://wui.cmsaf.eu Note: the HOAPS V5 precursor is not yet an official CM SAF product; full validation and public release are pending. The MWR/CDR WTC V2 estimates is derived using spatially varying but temporally constant polynomial coefficients (ai). 1. WTC V2 – Along-track L2P Product Data format: The WTC V2 product is delivered in Level-2+ (L2P) format, along the satellite ground track. Each mission is distributed as a compressed archive (.tar.gz) containing one NetCDF4 CF-1.8 file per mission cycle. Archive naming convention: <mission>_WTC_from_WV_CDR_<version>.tar.gz mission: TP (TOPEX/Poseidon), J1, J2, J3 version: product version (currently V2) File naming convention inside archives: <mission>_C<cycle>.nc cycle: 4-digit cycle index (e.g., C0001) Each NetCDF file contains: 1/ Along-track WTC estimate; 2/ Ancillary information; 3/ Space–time coordinates 2. WTC CDR Uncertainties – Gridded Product: A complementary product is provided, delivering regional trend estimates and associated uncertainties from the WTC Climate Data Record. The uncertainty product is distributed as a single NetCDF4 file: wtc_trend_uncertainties.nc . This file contains global gridded fields of WTC CDR trend and uncertainty parameters. Product content: This is the first dedicated version providing both: WTC CDR (HOAPS) linear trends, and Uncertainty estimates on these trends. Uncertainties are expressed as 1-sigma confidence intervals, and propagated using the methodology described in Section 2.3 of the Product User Manual. The product includes: - Total uncertainty on the WTC trend, propagated from all identified uncertainty sources in the WTC–TCWV regression. - Individual contributions of uncertainty sources (Uncertainties on regression coefficients: a0, a1 and their standard deviations; Uncertainties inherited from the HOAPS TCWV CDR) These fields enable users to assess the relative importance of each uncertainty component and recompute uncertainty propagation with alternative methods. Included regression input variables: To ensure transparency and reproducibility, the product provides: 1/ regression coefficients a0, a1; 2/ their associated uncertainties (std of a0, std of a1); 3/additional diagnostic fields required to recompute uncertainties if needed.
-

These gridded products are produced from the following upstream data: - for satellites SARAL/AltiKa, Cryosat-2, HaiYang-2B, Jason-3, Copernicus Sentinel-3A/B, Sentinel-6 MF, SWOT Nadir => NRT (Near-Real-Time) Nadir along-track (or Level-3) SEA LEVEL products (DOI: https://doi.org/10.48670/moi-00147) delivered by the Copernicus Marine Service (http://marine.copernicus.eu/ ). The gridded product is based on near-real-time (NRT) Level-3 Nadir datasets for the period from July 7, 2025, to December 31, 2025. => MY (Multi-Year) Nadir along-track (or Level-3) SEA LEVEL products (DOI: https://doi.org/10.48670/moi-00146 ) delivered by the Copernicus Marine Service (CMEMS, http://marine.copernicus.eu/ ). The gridded product is based on MY Level-3 Nadir datasets for the period from March 28, 2023, to July 6, 2025. - for SWOT KaRIn : the L3_LR_SSH Expert v3.0 product distributed by AVISO (DOI: https://doi.org/10.24400/527896/A01-2023.018) from March 28, 2023 to December 31, 2025. One mapping algorithm is proposed: the MIOST approach which provides which provides global Sea Surface Height (SSH) solutions. The MIOST method is capable of accounting for various modes of ocean surface topography variability (e.g., geostrophic, barotropic, equatorial wave dynamics) by constructing multiple independent components within a predefined covariance model.
-

The Sentinel-6 Level-2P skewness products was developed to estimate the skewness from Sentinel-6 LR (Low Resolution Mode) and HR (High Resolution Mode) acquisitions. That demonstration product is generated by different retracking processes, provides an initial estimation of such a phenomenon and allows a finer description of the sea state.
-

The SWOT KaRIn Level-3 Wind Wave product (L3_LR_WIND_WAVE) is an innovative product derived from the Unsmoothed L3_LR_SSH product (DOI: 10.24400/527896/A01-2024.003), which is based on the algorithm presented by Ardhuin et al. (2024). L3_LR_WIND_WAVE takes advantage of the KaRIn Low Rate (LR) chain's ability to resolve waves with wavelengths greater than 500 meters (approximately 18 seconds) and provides detailed information on the characteristics of these wave regimes. This includes significant wave height (SWH), dominant wavelength, and wave propagation direction. These regimes are associated with long-period swells and extreme events that play a critical role in ocean dynamics, coastal processes, and maritime operations. The SWOT L3_LR_WIND_WAVE product is organized into two subproducts, "Light" and "Extended". The L2_LR_SSH "Light" product is described in this metadata sheet. The "Light" L3_LR_WIND_WAVE (also known as the "lightweight" product) includes the SWOT L3_LR_SSH 250-m SSHA spectrum, corrected for instrumental effects and expressed in both Cartesian and polar coordinates. It also includes the swell partition of the spectrum and the wave parameters integrated over this partition, for both the WW3 model and the KaRIn model (significant wave height, wavelength, and direction). The "Extended" L3_LR_WIND_WAVE includes the aforementioned variables plus the WW3 spectrum in the same frequency grid as the KaRIn spectrum and the KaRIn transfer functions used for correction, as well as some parameters derived from KaRIn observations (e.g., coherence, mean backscatter).
-

These gridded products are produced from the along-track (or Level-3) SEA LEVEL products (DOI: doi.org/10.48670/moi-00147) delivered by the Copernicus Marine Service (CMEMS, marine.copernicus.eu) for satellites SARAL/AltiKa, Cryosat-2, HaiYang-2B, Jason-3, Copernicus Sentinel-3A/B, Sentinel-6 MF, SWOT nadir, and SWOT Level-3 KaRIn sea level products (DOI: https://doi.org/10.24400/527896/A01-2023.018). Three mapping algorithms are proposed: MIOST, 4DvarNET, 4DvarQG: - the MIOST approach which give the global SSH solutions: the MIOST method is able of accounting for various modes of variability of the ocean surface topography (e.g., geostrophic, barotrope, equatorial waves dynamic …) by constructing several independent components within an assumed covariance model. - the 4DvarNET approach for the regional SSH solutions: the 4DvarNET mapping algorithm is a data-driven approach combining a data assimilation scheme associated with a deep learning framework. - the 4DvarQG approach for the regional SSH solutions: the 4DvarQG mapping technique integrates a 4-Dimensional variational (4DVAR) scheme with a Quasi-Geostrophic (QG) model.
-
Monomission altimeter satellite along-track sea surface heights computed with respect to a twenty-year mean. Previously distributed by Aviso+, no change in the scientific content. All the missions are homogenized with respect to a reference mission which is currently OSTM/Jason-2. The sla is computed with an optimal and centered computation time window (6 weeks before and after the date). Two kinds of datasets are proposed: filtered (nominal dataset) and unfiltered.
-
Produit altimétrique combiné (multimissions) régional comprenant les hauteurs de surface (anomalies de hauteurs de mer, topographie dynamique) et variables dérivées (anomalies de courants géostrophiques et courants géostrophiques aboslus) calculées par rapport à une moyenne sur vingt ans.
-
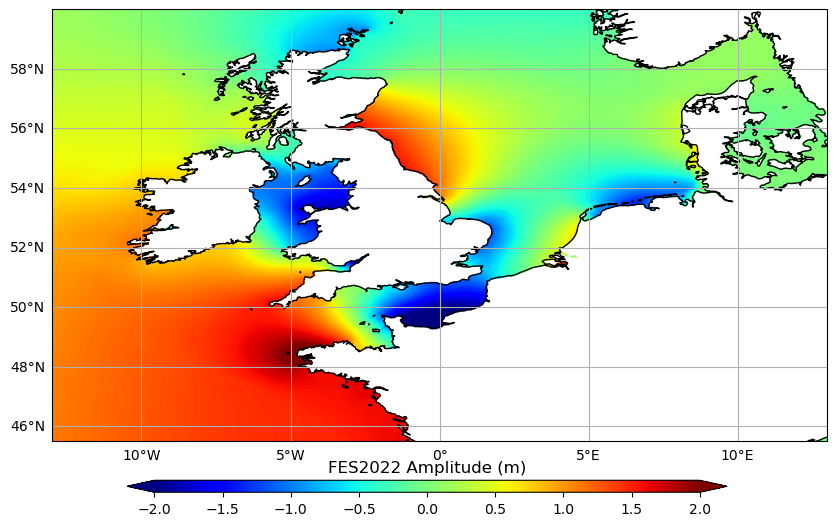
Produit auxiliaire FES2022 marée globale : La base de données des marées FES2022 comprend 2 composantes: les élévations de marée (amplitude et phase) et la marée de charge (amplitude et phase) sur une grille de 1/30°x1/30°. - Elévation de marée: Le modèle de marée océanique FES2022b est distribué; ce modèle a été calculé en utilisant la marée de charge FES2022. Deux versions sont disponibles: + Version non extrapolée: le modèle est défini sur une grille de 1/30° directement interpolée à partir de la grille native d'éléments finis du modèle. Mise à jour Mars 2026: Nous fournissons également le modèle sur sa grille d'origine. + Version extrapolée: la version ci-dessus a été extrapolée sur les côtes afin de couvrir presque entièrement les régions côtières. La procédure est expliquée dans le manuel utilisateur. - Marée de charge: le nouveau modèle de marée de charge FES2022b doit être utilisé pour calculer la marée géocentrique (élastique) comme ceci: marée géocentrique FES2022b (elastique) = marée océanique FES2022b + effet de charge FES2022b. Une description du calcul et des performances du modèle FES2022 est donnée dans le manuel utilisateur (lien ci-dessous). Les fichiers de données sont disponibles sur les services de distribution (FTP/SFTP et le Thredds dans 4 répertoires distincts fes2022b/load_tide , fes2022b/ocean_tide_non_structured, fes2022b/ocean_tide_extrapolated et fes2022b/ocean_tide). Les sous-répertoires contiennent toutes les 34 composantes: M2, S2, K1, O1, P1, Q1, Nu2, Mu2, N2, K2, Eps2, L2, Lambda2, M4, 2N2, J1, M3, M6, M8, Mf, MKS2, Mm, MN4, MS4, MSf, MSqm, Mtm, N4, R2, S1, S4, Sa, Ssa, T2. Pour vous permettre de télécharger des fichiers aussi petits que possibles, les fichiers ont été compressées à l'aide du programme xz en utilisant les algorithmes de compression LZMA2. Pour décompresser les fichiers, vous devez utiliser cette commande ou 7-zip si vous utilisez Windows. [Mise à jour Mars 2026] Le **nouvel algorithme de prédiction officiel PyFES**, est disponible ici: https://github.com/CNES/aviso-fes. La version v2025.2.0 de la librairie PyFES doit être utilisée pour calculer la marée FES2022 en utilisant soit la grille non-structurée (ou native) soit la grille cartésienne. Cette nouvelle librairie PyFES devient la version officielle du logiciel de prédiction de marée AVISO et toutes les nouvelles mises à jour se feront uniquement dans PyFES. **Nous garantissons les résultats obtenus avec ce code, mais pas ceux obtenus avec d'autres codes de prédiction.** Si vous utilisez ce code, merci de citer : "The code used to compute FES2022, was developed in collaboration between Legos, CLS and CNES and is available under GNU General Public License".
-
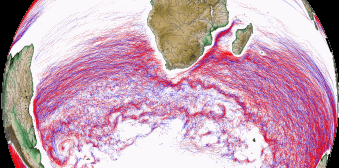
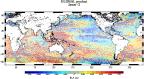
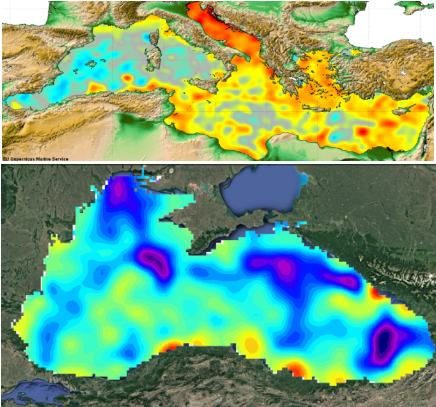
Tourbillons détectés en temps différé (Delayed-Time - DT) pour toute la période [1993 - aujourd'hui]. Les variables fournies incluent pour chaque fichier journalier, et pour un type de rotation (Cyclonique/Anticyclonique) : - Position du centre (Longitude et latitude du centre du cercle le mieux ajusté avec le contour de la vitesse géostrophique moyenne circonférentielle maximale) ; - Amplitude (|SSH(local_extremum) - SSH(outermost_contour)|) ; - Rayon de vitesse (Rayon du cercle de meilleur ajustement avec le contour de la vitesse géostrophique moyenne circonférentielle maximale) ; - Vitesse moyenne (Vitesse géostrophique moyenne du contour définissant le rayon de vitesse) ; - Profil de vitesse (profil des valeurs moyennes de vitesse du contour effectif vers l'intérieur jusqu'au plus petit contour intérieur) ; - Contour effectif (Plus grand contour du tourbillon détecté) ; - Contour de vitesse (Contour de la vitesse géostrophique moyenne circonférentielle maximale pour le tourbillon détecté). Les cartes "tous satellites" (Allsat) sont construites avec tous les satellites disponibles à un moment donné, améliorant la représentation des petites échelles dans les cartes en raison de la diversité de la localisation des traces et des différentes périodes de répétition des missions altimétriques. Les données utilisées sont les données quotidiennes en temps différé "Allsat" DUACS2021 version https://doi.org/10.48670/moi-00148, avec la variable " Gridded Global Absolute Dynamic Topographies (ADT)" du Copernicus Marine Service (CMEMS) http://marine.copernicus.eu/. Plusieurs autres versions existent : Temps différé "Twosat" et une version en temps réel, décrites sur d'autres fiches de métadonnées. Gamme de produit : produit altimétrique dérivé des produits Ssalto/Duacs, grillé multimissions Contenu : trajectoires des tourbillons détectés dans les données altimétriques Format : NetCDF-4 Classic with CF standards. Statistical analysis document (Figures following Chelton et al. 2011): https://www.aviso.altimetry.fr/fileadmin/documents/data/products/value-added/META3.2_allsat_report.pdf Reading software: examples in Python programming language. Details on Aviso+ Users Newsletter #14, page 4: Tools for the Mesoscale Eddy Trajectory Atlas, https://www.aviso.altimetry.fr/fileadmin/documents/newsstand/Newsletter/aviso_newsletter_14.pdf#page=4 Code delivery: the open source code is available at https://github.com/AntSimi/py-eddy-tracker from version META3.0 onwards. When using the code, please cite "The code used to compute the Mesoscale Eddy Trajectories Atlas from version 3.0 onwards, was developed in collaboration between IMEDEA (E. Mason) and CLS, is freely available under GNU General Public License https://github.com/AntSimi/py-eddy-tracker ". Image of the month, June 2017: Eddies everywhere, https://www.aviso.altimetry.fr/en/news/image-of-the-month/2017/jun-2017-eddies-everywhere.html