 Catalogue PIGMA
Zooplankton
Type of resources
Available actions
Topics
Keywords
Contact for the resource
Provided by
Years
Formats
Representation types
Update frequencies
status
Scale
-
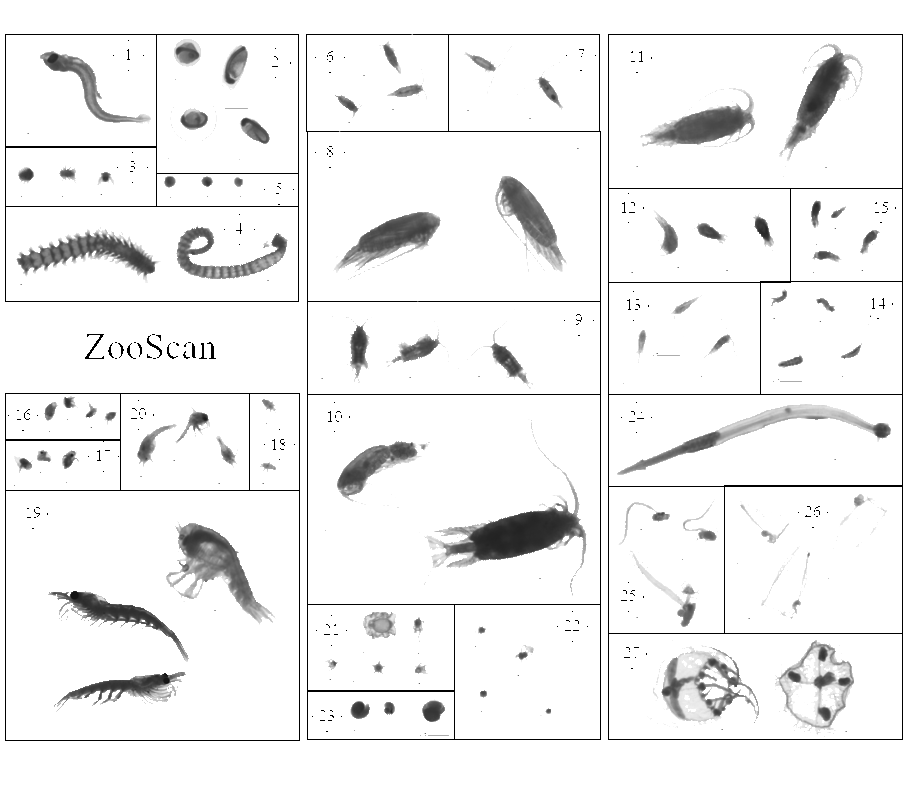
This dataset is composed of 1,153,507 zooplankton individuals, zooplankton parts, non-living particles and imaging artefacts, ranging from 300 µm to 3.39 mm Equivalent Spherical Diameter, individually imaged and measured with the ZooScan (Gorsky et al., 2010). The objects were sorted in 127 taxonomic and morphological groups. The imaged objects originate from samples collected on the Bay of Biscay continental shelf, in spring, from 2004 to 2016 during the PELGAS ecosystemic surveys (Doray et al., 2018). The samples were collected with a WP2 200 µm mesh size fitted with a Hydrobios (back-run stop) mechanical flowmeter, generally from 100 m depth to the surface, or 5 m above the sea floor (if bottom depth less than 100 m) in vertical hauls, at night. From 2004 to 2006, vertical WP2 net tows were performed in the anchovy core distribution area in the southern Bay of Biscay and North of it until the Loire estuary only. Since 2009, WP2 sampling has been carried out at all PELGAS stations, up to the southern coast of Brittany. The samples were preserved in 4% buffered formaldehyde seawater solution directly after collection, until 2019-2020 where they were imaged with the ZooScan, in the lab, on land. Each imaged object is geolocated, associated to a station, a cruise, a year and other metadata that enable the reconstruction of quantitative zooplankton communities for ecological studies (i.e. Grandrémy et al., 2023a). Each object is described by 46 morphological and grey level based features (8 bits encoding, 0 = black, 255 = white), including size, automatically extracted on each individual image by the Zooprocess. Each object was taxonomically identified using the web based application Ecotaxa with built-in, random forest and CNN based, semi-automatic sorting tools followed by expert validation or correction (Picheral et al., 2017). This dataset is intended to be used for ecological studies as well as machine learning applied to plankton studies. The archive contains: - One tab separated file (PELGAS ZooScan zooplankton dataset) containing all data and metadata associated to each imaged and identified object. Metadata and features are in columns (n =71) and objects are in rows (n = 1,153,507). - One comma separated file containing the name, type, definition and unit of each field (column) in the .tsv (dataset_descriptor_zooscan). - One comma separated file containing the taxonomic list of the dataset, with counts and nature of the content of the category, i.e. “T” for taxonomical category, and “M” for morphological category (taxonomy_descriptor_zooscan). - A individual_images directory containing images of each imaged object sorted in subdirectories named according to objects’ identifications object_taxon appended to an Ecotaxa internal taxon numerical id classif_id (i.e. taxon__123456789) across years and sampling stations. Within subdirectories, each object is named after its unique internal Ecotaxa identifier, objid. - A Map of the sampling station location over the 2004-2016 period
-
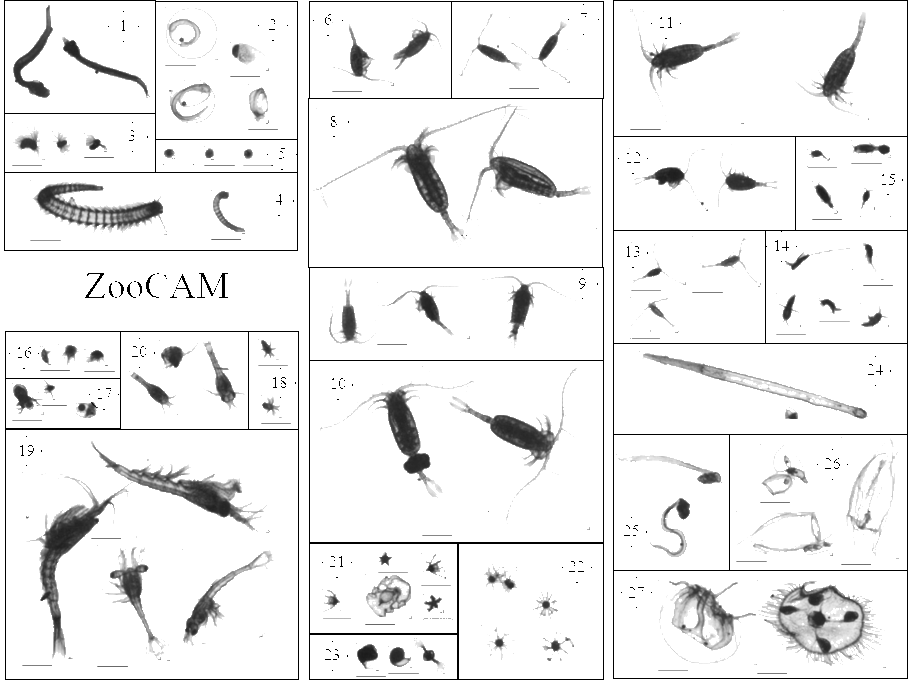
This dataset is composed of 702,111 zooplankton individuals, zooplankton pieces, non-living particles and imaging artefacts, ranging from 300 µm to 3.39 mm Equivalent Spherical Diameter, individually imaged and measured with the ZooCAM (Colas et al., 2018). The objects were sorted in 127 taxonomic and morphological groups. The imaged objects originate from samples collected on the Bay of Biscay continental shelf, in spring, from 2016 to 2019 during the PELGAS ecosystemic surveys (Doray et al., 2018). The samples were collected with a WP2 200 µm mesh size fitted with a Hydrobios (back-run stop) mechanical flowmeter, generally from 100 m depth to the surface, or 5 m above the sea floor (if bottom depth less than 100 m) in vertical hauls, at night. The samples were imaged on board, live, after collection and subsampling, and preserved in 4% buffered formaldehyde seawater. Each imaged object is geolocated, associated to a station, a cruise, a year and other metadata that enable the reconstruction of quantitative zooplankton communities for ecological studies (i.e. Grandrémy et al., 2023a). Each object is described by 52 morphological and grey level based features (8 bits encoding, 0 = black, 255 = white), including size, automatically extracted on each individual image by the ZooCAM software. Each object was taxonomically identified using the ZooCAM software and the web based application Ecotaxa with built-in, random forest and CNN based, semi-automatic sorting tools followed by expert validation or correction (Picheral et al., 2017). Images from 2016-2017 contain ROI bounding box limits, metadata at the bottom of each image, and non-homogenised background within and around the ROI bounding box; Images from 2018 contain non-homogenised background within the ROI bounding box only; images from 2019 have a completely homogeneous and thresholded background around the object. The differences arose from successive ZooCAM software updates that do not modify the calculation of object’s features. This dataset is intended to be used for ecological studies as well as machine learning applied to plankton studies. The archive contains : - One tab separated file (PELGAS ZooCAM zooplankton dataset) containing all data and metadata associated to each imaged and identified object. Metadata and features are in columns (n =72) and objects are in rows (n = 702,111). - One comma separated file containing the name, type, definition and unit of each field (column) in the .tsv (dataset descriptor zoocam). - One comma separated file containing the taxonomic list of the dataset, with counts and nature of the content of the category, i.e. “T” for taxonomical category, and “M” for morphological category (taxonomy descriptor zoocam). - A individual_images directory containing images of each object, named according to the object id objid and sorted in subdirectories according to their taxonomic identification, across years and sampling stations. - A Map of the sampling station location over the 2016-2019 period.
-

This dataset contains the biological outputs of a global ocean simulation coupling dynamics and biogeochemistry at ¼° over the year 2019. The simulation has been performed using the coupled circulation/ecosystem model NEMO/PISCES (https://www.nemo-ocean.eu/), which is here enhanced to perform an ensemble simulation with explicit simulation of modeling uncertainties in the physics and in the biogeochemistry. This dataset is one of the 40 members of the ensemble simulation. This study was part of the Horizon Europe project SEAMLESS (https://seamlessproject.org/Home.html), with the general objective of improving the analysis and forecast of ecosystem indicators. See Popov et al. (https://os.copernicus.org/articles/20/155/2024/) for more details on the study.
-

'''Short description:''' Le modèle biogéochimique ECO-MARS3D sur la façade Manche Atlantique (PREVIMER_B1-ECOMARS3D-MANGA4000) est un modèle 3D de résolution spatiale 4km qui fournit les concentrations de nutriments et de plancton toutes les heures sur 30 niveaux (fenêtre de prévision à 4 jours). '''Paramètres calculés :''' Les paramètres calculés sont les suivants : * SAL : sea_water_salinity * TEMP : sea_water_temperature * suspended_inorganic_particulate_matter : mass_concentration_of_suspended_matter_in_sea_water * nanopicoplankton_nitrogen : mole_concentration_of_nanoplankton_expressed_as_nitrogen_in_sea_water * diatom_nitrogen : mole_concentration_of_diatoms_expressed_as_nitrogen_in_sea_water * dinoflagellate_nitrogen : mole_concentration_of_dinoflagellates_expressed_as_nitrogen_in_sea_water * microzooplankton_nitrogen : mole_concentration_of_microzooplankton_expressed_as_nitrogen_in_sea_water * mesozooplankton_nitrogen : mole_concentration_of_mesozooplankton_expressed_as_nitrogen_in_sea_water * colonial_phaeocystis_nitrogen : mole_concentration_of_colonial_phaeocystis_expressed_as_nitrogen_in_sea_water * phaeocystis_mucus : concentration_of_phaeocystis_mucus_expressed_as_mass_in_sea_water * ammonium : mole_concentration_of_ammonium_in_sea_water * nitrate : mole_concentration_of_nitrate_in_sea_water * dissolved_silicate : mole_concentration_of_silicate_in_sea_water * dissolved_phosphate : mole_concentration_of_phosphate_in_sea_water * dissolved_oxygen : dissolved_oxygen_in_water_column * cumulative_nanoflagellate_carbon_production : cumulative_nanoflagellate_production_expressed_as_carbon_in_sea_water * cumulative_diatom_carbon_production : cumulative_diatom_production_expressed_as_carbon_in_sea_water * cumulative_dinoflagellate_carbon_production : cumulative_dinoflagellate_production_expressed_as_carbon_in_sea_water * cumulative_phaeocystis_carbon_production : cumulative_phaeocystis_production_expressed_as_carbon_in_sea_water * organic_nitrogen_benth : mole_concentration_of_organic_detritus_expressed_as_nitrogen_in_benthos Les paramètres diagnostiques calculés sont les suivants : * XE : sea_surface_height_above_geoid * maximum_de_diat : maximum_diatom_mass_concentration_in_sea_water * maximum_de_dino : maximum_dinoflagellate_mass_concentration_in_sea_water * maximum_de_nano : maximum_nanoflagellate_mass_concentration_in_sea_water * grad_vert_salinite : maximum_vertical_gradient_of_sea_water_salinity * grad_vert_temp : maximum_vertical_gradient_of_sea_water_temperature * extinction_lumineuse : light_extinction_in_sea_water * prod_diat : cumulated_production_of_diatoms_in_sea_water_column_expressed_in_carbon * prod_dino : cumulated_production_of_dinoflagellates_in_sea_water_column_expressed_in_carbon * prod_nano : cumulated_production_of_nanoflagellates_in_sea_water_column_expressed_in_carbon * chlorophylle_a : chlorophyll_mass_concentration_in_sea_water * prod_cumul_chloro : cumulated_total_production_in_sea_water_column_expressed_in_carbon * maximum_de_phaeocystis : maximum_phaeocystis_mass_concentration_in_sea_water * prod_phaeocystis : cumulated_production_of_phaeocystis_in_sea_water_column_expressed_in_carbon * oxygen_saturation : oxygen_saturation * ammoniumGIRON_tracer_sign: mole_concentration_of_ammonium_in_sea_waterGIRON_tracer_sign * ammoniumGIRON_tracer_age: mole_concentration_of_ammonium_in_sea_waterGIRON_tracer_age * nitrateGIRON_tracer_sign: mole_concentration_of_nitrate_in_sea_waterGIRON_tracer_sign * nitrateGIRON_tracer_age: mole_concentration_of_nitrate_in_sea_waterGIRON_tracer_age * nanopicoplankton_nitrogenGIRON_tracer_sign: mole_concentration_of_nanoplankton_expressed_as_nitrogen_in_sea_waterGIRON_tracer_sign * nanopicoplankton_nitrogenGIRON_tracer_age: mole_concentration_of_nanoplankton_expressed_as_nitrogen_in_sea_waterGIRON_tracer_age * diatom_nitrogenGIRON_tracer_sign: mole_concentration_of_diatoms_expressed_as_nitrogen_in_sea_waterGIRON_tracer_sign * diatom_nitrogenGIRON_tracer_age: mole_concentration_of_diatoms_expressed_as_nitrogen_in_sea_waterGIRON_tracer_age * dinoflagellate_nitrogenGIRON_tracer_sign: mole_concentration_of_dinoflagellates_expressed_as_nitrogen_in_sea_waterGIRON_tracer_sign * dinoflagellate_nitrogenGIRON_tracer_age: mole_concentration_of_dinoflagellates_expressed_as_nitrogen_in_sea_waterGIRON_tracer_age * microzooplankton_nitrogenGIRON_tracer_sign: mole_concentration_of_microzooplankton_expressed_as_nitrogen_in_sea_waterGIRON_tracer_sign * microzooplankton_nitrogenGIRON_tracer_age: mole_concentration_of_microzooplankton_expressed_as_nitrogen_in_sea_waterGIRON_tracer_age * mesozooplankton_nitrogenGIRON_tracer_sign: mole_concentration_of_mesozooplankton_expressed_as_nitrogen_in_sea_waterGIRON_tracer_sign * mesozooplankton_nitrogenGIRON_tracer_age: mole_concentration_of_mesozooplankton_expressed_as_nitrogen_in_sea_waterGIRON_tracer_age * detrital_nitrogenGIRON_tracer_sign: mole_concentration_of_organic_detritus_expressed_as_nitrogen_in_sea_waterGIRON_tracer_sign * detrital_nitrogenGIRON_tracer_age: mole_concentration_of_organic_detritus_expressed_as_nitrogen_in_sea_waterGIRON_tracer_age * colonial_phaeocystis_nitrogenGIRON_tracer_sign: mole_concentration_of_colonial_phaeocystis_expressed_as_nitrogen_in_sea_waterGIRON_tracer_sign * colonial_phaeocystis_nitrogenGIRON_tracer_age: mole_concentration_of_colonial_phaeocystis_expressed_as_nitrogen_in_sea_waterGIRON_tracer_age * phaeocystis_cells_nitrogenGIRON_tracer_sign: mole_concentration_of_phaeocystis_cells_expressed_as_nitrogen_in_sea_waterGIRON_tracer_sign * phaeocystis_cells_nitrogenGIRON_tracer_age: mole_concentration_of_phaeocystis_cells_expressed_as_nitrogen_in_sea_waterGIRON_tracer_age * organic_nitrogen_benthGIRON_tracer_sign: mole_concentration_of_organic_detritus_expressed_as_nitrogen_in_benthosGIRON_tracer_sign * organic_nitrogen_benthGIRON_tracer_age: mole_concentration_of_organic_detritus_expressed_as_nitrogen_in_benthosGIRON_tracer_age * phytoplankton_sign_N_GIRON: nitrogen_fraction_in_phytoplankton_from_source_GIRON * phytoplankton_age_N_GIRON: age_of_nitrogen_fraction_in_phytoplankton_from_source_GIRON * ammoniumLOIRE_tracer_sign: mole_concentration_of_ammonium_in_sea_waterLOIRE_tracer_sign * ammoniumLOIRE_tracer_age: mole_concentration_of_ammonium_in_sea_waterLOIRE_tracer_age * nitrateLOIRE_tracer_sign: mole_concentration_of_nitrate_in_sea_waterLOIRE_tracer_sign * nitrateLOIRE_tracer_age: mole_concentration_of_nitrate_in_sea_waterLOIRE_tracer_age * nanopicoplankton_nitrogenLOIRE_tracer_sign: mole_concentration_of_nanoplankton_expressed_as_nitrogen_in_sea_waterLOIRE_tracer_sign * nanopicoplankton_nitrogenLOIRE_tracer_age: mole_concentration_of_nanoplankton_expressed_as_nitrogen_in_sea_waterLOIRE_tracer_age * diatom_nitrogenLOIRE_tracer_sign: mole_concentration_of_diatoms_expressed_as_nitrogen_in_sea_waterLOIRE_tracer_sign * diatom_nitrogenLOIRE_tracer_age: mole_concentration_of_diatoms_expressed_as_nitrogen_in_sea_waterLOIRE_tracer_age * dinoflagellate_nitrogenLOIRE_tracer_sign: mole_concentration_of_dinoflagellates_expressed_as_nitrogen_in_sea_waterLOIRE_tracer_sign * dinoflagellate_nitrogenLOIRE_tracer_age: mole_concentration_of_dinoflagellates_expressed_as_nitrogen_in_sea_waterLOIRE_tracer_age * microzooplankton_nitrogenLOIRE_tracer_sign: mole_concentration_of_microzooplankton_expressed_as_nitrogen_in_sea_waterLOIRE_tracer_sign * microzooplankton_nitrogenLOIRE_tracer_age: mole_concentration_of_microzooplankton_expressed_as_nitrogen_in_sea_waterLOIRE_tracer_age * mesozooplankton_nitrogenLOIRE_tracer_sign: mole_concentration_of_mesozooplankton_expressed_as_nitrogen_in_sea_waterLOIRE_tracer_sign * mesozooplankton_nitrogenLOIRE_tracer_age: mole_concentration_of_mesozooplankton_expressed_as_nitrogen_in_sea_waterLOIRE_tracer_age * detrital_nitrogenLOIRE_tracer_sign: mole_concentration_of_organic_detritus_expressed_as_nitrogen_in_sea_waterLOIRE_tracer_sign * detrital_nitrogenLOIRE_tracer_age: mole_concentration_of_organic_detritus_expressed_as_nitrogen_in_sea_waterLOIRE_tracer_age * colonial_phaeocystis_nitrogenLOIRE_tracer_sign: mole_concentration_of_colonial_phaeocystis_expressed_as_nitrogen_in_sea_waterLOIRE_tracer_sign * colonial_phaeocystis_nitrogenLOIRE_tracer_age: mole_concentration_of_colonial_phaeocystis_expressed_as_nitrogen_in_sea_waterLOIRE_tracer_age * phaeocystis_cells_nitrogenLOIRE_tracer_sign: mole_concentration_of_phaeocystis_cells_expressed_as_nitrogen_in_sea_waterLOIRE_tracer_sign * phaeocystis_cells_nitrogenLOIRE_tracer_age: mole_concentration_of_phaeocystis_cells_expressed_as_nitrogen_in_sea_waterLOIRE_tracer_age * organic_nitrogen_benthLOIRE_tracer_sign: mole_concentration_of_organic_detritus_expressed_as_nitrogen_in_benthosLOIRE_tracer_sign * organic_nitrogen_benthLOIRE_tracer_age: mole_concentration_of_organic_detritus_expressed_as_nitrogen_in_benthosLOIRE_tracer_age * phytoplankton_sign_N_LOIRE: nitrogen_fraction_in_phytoplankton_from_source_LOIRE * phytoplankton_age_N_LOIRE: age_of_nitrogen_fraction_in_phytoplankton_from_source_LOIRE * ammoniumSEINE_tracer_sign: mole_concentration_of_ammonium_in_sea_waterSEINE_tracer_sign * ammoniumSEINE_tracer_age: mole_concentration_of_ammonium_in_sea_waterSEINE_tracer_age * nitrateSEINE_tracer_sign: mole_concentration_of_nitrate_in_sea_waterSEINE_tracer_sign * nitrateSEINE_tracer_age: mole_concentration_of_nitrate_in_sea_waterSEINE_tracer_age * nanopicoplankton_nitrogenSEINE_tracer_sign: mole_concentration_of_nanoplankton_expressed_as_nitrogen_in_sea_waterSEINE_tracer_sign * nanopicoplankton_nitrogenSEINE_tracer_age: mole_concentration_of_nanoplankton_expressed_as_nitrogen_in_sea_waterSEINE_tracer_age * diatom_nitrogenSEINE_tracer_sign: mole_concentration_of_diatoms_expressed_as_nitrogen_in_sea_waterSEINE_tracer_sign * diatom_nitrogenSEINE_tracer_age: mole_concentration_of_diatoms_expressed_as_nitrogen_in_sea_waterSEINE_tracer_age * dinoflagellate_nitrogenSEINE_tracer_sign: mole_concentration_of_dinoflagellates_expressed_as_nitrogen_in_sea_waterSEINE_tracer_sign * dinoflagellate_nitrogenSEINE_tracer_age: mole_concentration_of_dinoflagellates_expressed_as_nitrogen_in_sea_waterSEINE_tracer_age * microzooplankton_nitrogenSEINE_tracer_sign: mole_concentration_of_microzooplankton_expressed_as_nitrogen_in_sea_waterSEINE_tracer_sign * microzooplankton_nitrogenSEINE_tracer_age: mole_concentration_of_microzooplankton_expressed_as_nitrogen_in_sea_waterSEINE_tracer_age * mesozooplankton_nitrogenSEINE_tracer_sign: mole_concentration_of_mesozooplankton_expressed_as_nitrogen_in_sea_waterSEINE_tracer_sign * mesozooplankton_nitrogenSEINE_tracer_age: mole_concentration_of_mesozooplankton_expressed_as_nitrogen_in_sea_waterSEINE_tracer_age * detrital_nitrogenSEINE_tracer_sign: mole_concentration_of_organic_detritus_expressed_as_nitrogen_in_sea_waterSEINE_tracer_sign * detrital_nitrogenSEINE_tracer_age: mole_concentration_of_organic_detritus_expressed_as_nitrogen_in_sea_waterSEINE_tracer_age * colonial_phaeocystis_nitrogenSEINE_tracer_sign: mole_concentration_of_colonial_phaeocystis_expressed_as_nitrogen_in_sea_waterSEINE_tracer_sign * colonial_phaeocystis_nitrogenSEINE_tracer_age: mole_concentration_of_colonial_phaeocystis_expressed_as_nitrogen_in_sea_waterSEINE_tracer_age * phaeocystis_cells_nitrogenSEINE_tracer_sign: mole_concentration_of_phaeocystis_cells_expressed_as_nitrogen_in_sea_waterSEINE_tracer_sign * phaeocystis_cells_nitrogenSEINE_tracer_age: mole_concentration_of_phaeocystis_cells_expressed_as_nitrogen_in_sea_waterSEINE_tracer_age * organic_nitrogen_benthSEINE_tracer_sign: mole_concentration_of_organic_detritus_expressed_as_nitrogen_in_benthosSEINE_tracer_sign * organic_nitrogen_benthSEINE_tracer_age: mole_concentration_of_organic_detritus_expressed_as_nitrogen_in_benthosSEINE_tracer_age * phytoplankton_sign_N_SEINE: nitrogen_fraction_in_phytoplankton_from_source_SEINE * phytoplankton_age_N_SEINE: age_of_nitrogen_fraction_in_phytoplankton_from_source_SEINE
-

Dataset summaryPlankton and detritus are essential components of the Earth’s oceans influencing biogeochemical cycles and carbon sequestration. Climate change impacts their composition and marine ecosystems as a whole. To improve our understanding of these changes, standardized observation methods and integrated global datasets are needed to enhance the accuracy of ecological and climate models. Here, we present a global dataset for plankton and detritus obtained by two versions of the Underwater Vision Profiler 5 (UVP5). This release contains the images classified in 33 homogenized categories, as well as the metadata associated with them, reaching 3,114 profiles and ca. 8 million objects acquired between 2008-2018 at global scale. The geographical distribution of the dataset is unbalanced, with the Equatorial region (30° S - 30° N) being the most represented, followed by the high latitudes in the northern hemisphere and lastly the high latitudes in the Southern Hemisphere. Detritus is the most abundant category in terms of concentration (90%) and biovolume (95%), although its classification in different morphotypes is still not well established. Copepoda was the most abundant taxa within the plankton, with Trichodesmium colonies being the second most abundant. The two versions of UVP5 (SD and HD) have different imagers, resulting in a different effective size range to analyse plankton and detritus from the images (HD objects >600 µm, SD objects >1 mm) and morphological properties (grey levels, etc.) presenting similar patterns, although the ranges may differ. A large number of images of plankton and detritus will be collected in the future by the UVP5, and the public availability of this dataset will help it being utilized as a training set for machine learning and being improved by the scientific community. This will reduce uncertainty by classifying previously unclassified objects and expand the classification categories, ultimately enhancing biodiversity quantification.Data tablesThe data set is organised according to:- samples : Underwater Vision Profiler 5 profiles, taken at a given point in space and time. - objects : individual UVP images, taken at a given depth along the each profile, on which various morphological features were measured and that where then classified taxonomically in EcoTaxa.samples and objects have unique identifiers. The sample_id is used to link the different tables of the data set together. All files are Tab separated values, UTF8 encoded, gzip compressed.samples.tsv.gz - sample_id unique sample identifier - sample_name original sample identifier - project EcoPart project title - lat, lon location [decimal degrees] - datetime date and time of start of profile [ISO 8601: YYYY-MM-DDTHH:MM:SSZ] - pixel_size size of one pixel [mm] - uvp_model version of the UVP: SD: standard definition, ZD: zoomed, HD: high definitionsamples_volume.tsv.gzAlong a profile, the UVP takes many images, each of a fixed volume. The profiles are cut into 5 m depth bins in which the number of images taken is recorded and hence the imaged volume is known. This is necessary to compute concentrations. - sample_id unique sample identifier - mid_depth_bin middle of the depth bin (2.5 = from 0 to 5 m depth) [m] - water_volume_imaged volume imaged = number of full images × unit volume [L]objects.tsv.gz - object_id unique object identifier - object_name original object identifier - sample_id unique sample identifier - depth depth at which the image was taken [m] - mid_depth_bin corresponding depth bin [m]; to match with samples_volumes - taxon original taxonomic name as in EcoTaxa; is not consistent across projects - lineage taxonomic lineage corresponding to that name - classif_author unique, anonymised identifier of the user who performed this classification - classif_datetime date and time at which the classification was - group broader taxonomic name, for which the identification is consistent over the whole dataset - group_lineage taxonomic lineage corresponding to this broader group - area_mm2 measurements on the object, in real worl units (i.e. comparable across the whole dataset) … - major_mm - area measurements on the objet, in [pixels] and therefore not directly comparable among the different UVP models and units - mean … - skeleton_area properties_per_bin.tsv.gzThe information above allows to compute concentrations, biovolumes, and average grey level within a given depth bin. The code to do so is in `summarise_objects_properties.R`. - sample_id unique sample identifier - depth_range range of depth over which the concentration/biovolume are computed: (start,end], in [m] where `(` means not including, `]` means including - group broad taxonomic group - concentration concentration [ind/L] - biovolume biovolume [mm3/L] - avg_grey average grey level of particles [no unit; 0 is black, 255 is white]ODV_biovolumes.txt, ODV_concentrations.txt, ODV_grey_levels.txtThis is the same information as above, formatted in a way that Ocean Data View https://odv.awi.de can read. In ODV, go to Import > ODV Spreadsheet and accept all default choices.ImagesThe images are provided in a separate, much larger, zip file. They are stored with the format `sample_id/object_id.jpg`, where `sample_id` and `object_id` are the integer identifiers used in the data tables above.
-
.jpg)
The Sir Alister Hardy Foundation for Ocean Science (SAHFOS) is an international charity that operates the Continuous Plankton Recorder (CPR) Survey. The dataset covers the North Atlantic and the North Sea on since 1958.
-
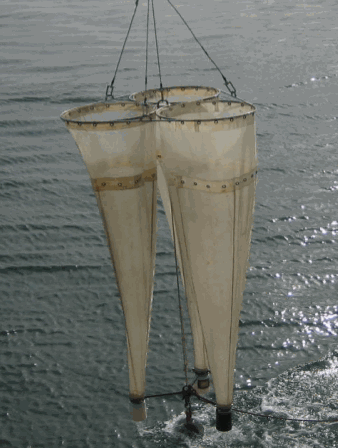
This dataset gathers results of monthly sampling with a WP2 plankton net within the Gironde plume (Bay of Biscay) in 2008 from March to August, as part of the ECLAIR suite of surveys. The sampling in May was part of the ECLAIR time-series but was performed onboard the THALASSA vessel during the PELGAS 2008 survey. Results are made of anchovy and sardine egg abundances, as well as size-fractionnated zooplankton biomass.
-
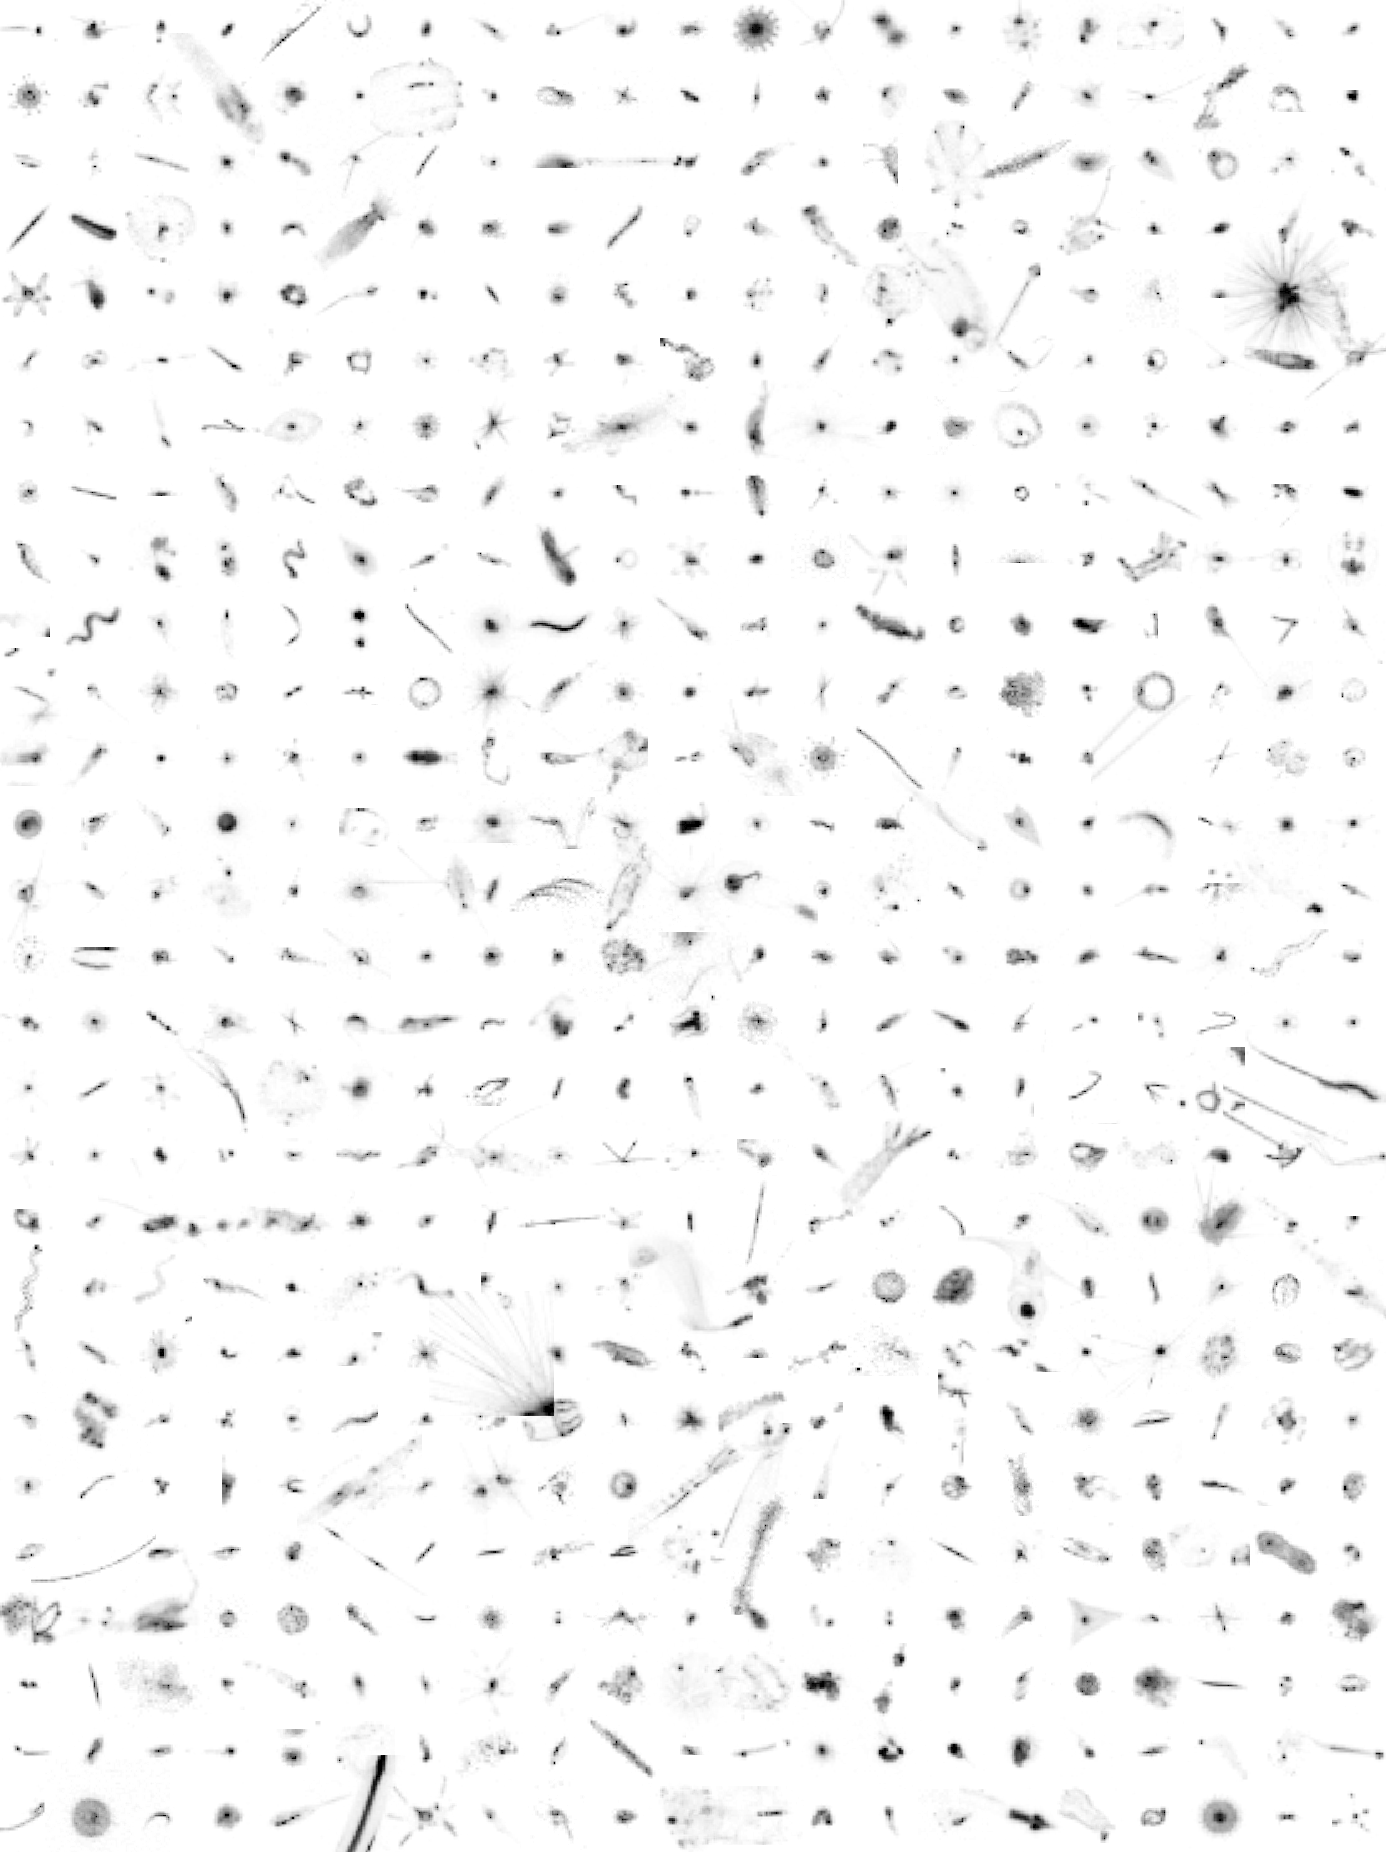
Here, we provide plankton image data that was sorted with the web applications EcoTaxa and MorphoCluster. The data set was used for image classification tasks as described in Schröder et. al (in preparation) and does not include any geospatial or temporal meta-data. Plankton was imaged using the Underwater Vision Profiler 5 (Picheral et al. 2010) in various regions of the world's oceans between 2012-10-24 and 2017-08-08. This data publication consists of an archive containing "training.csv" (list of 392k training images for classification, validated using EcoTaxa), "validation.csv" (list of 196k validation images for classification, validated using EcoTaxa), "unlabeld.csv" (list of 1M unlabeled images), "morphocluster.csv" (1.2M objects validated using MorphoCluster, a subset of "unlabeled.csv" and "validation.csv") and the image files themselves. The CSV files each contain the columns "object_id" (a unique ID), "image_fn" (the relative filename), and "label" (the assigned name). The training and validation sets were sorted into 65 classes using the web application EcoTaxa (http://ecotaxa.obs-vlfr.fr). This data shows a severe class imbalance; the 10% most populated classes contain more than 80% of the objects and the class sizes span four orders of magnitude. The validation set and a set of additional 1M unlabeled images were sorted during the first trial of MorphoCluster (https://github.com/morphocluster). The images in this data set were sampled during RV Meteor cruises M92, M93, M96, M97, M98, M105, M106, M107, M108, M116, M119, M121, M130, M131, M135, M136, M137 and M138, during RV Maria S Merian cruises MSM22, MSM23, MSM40 and MSM49, during the RV Polarstern cruise PS88b and during the FLUXES1 experiment with RV Sarmiento de Gamboa. The following people have contributed to the sorting of the image data on EcoTaxa: Rainer Kiko, Tristan Biard, Benjamin Blanc, Svenja Christiansen, Justine Courboules, Charlotte Eich, Jannik Faustmann, Christine Gawinski, Augustin Lafond, Aakash Panchal, Marc Picheral, Akanksha Singh and Helena Hauss In Schröder et al. (in preparation), the training set serves as a source for knowledge transfer in the training of the feature extractor. The classification using MorphoCluster was conducted by Rainer Kiko. Used labels are operational and not yet matched to respective EcoTaxa classes.
-

ICES hosts data collected from both net trawl surveys (primarily bottom trawling), and from echo sounding (acoustic sampling in the pelagic zone). The net trawls are primarily hosted in the DATRAS data portal, and the acoustics in the acoustic trawl surveys portal. DATRAS (the Database of Trawl Surveys) stores data collected primarily from bottom trawl fish surveys coordinated by ICES expert groups. The survey data are covering the Baltic Sea, Skagerrak, Kattegat, North Sea, English Channel, Celtic Sea, Irish Sea, Bay of Biscay and the eastern Atlantic from the Shetlands to Gibraltar. At present, there are more than 45 years of continuous time series data in DATRAS, and survey data are continuously updated by national institutions. The acoustic database hosts information on fisheries observations collected from various pelagic surveys coordinated by ICES and falls into two categories: acoustic data, derived from readings taken on vessels, and those obtained through trawls in the open ocean – pelagic – zone. Combined, this provides key biological data on fish stocks such as herring, mackerel and blue whiting as well as krill and other prey species. The data from both systems are used for stock assessments and fish community studies by the ICES community and form the basis of management advice to the relevant regulatory bodies.
-

'''Short description:''' Global Ocean - near real-time (NRT) in situ quality controlled observations, hourly updated and distributed by INSTAC within 24-48 hours from acquisition in average. Data are collected mainly through global networks (Argo, OceanSites, GOSUD, EGO) and through the GTS '''DOI (product) :''' https://doi.org/10.48670/moi-00036