 Catalogue PIGMA
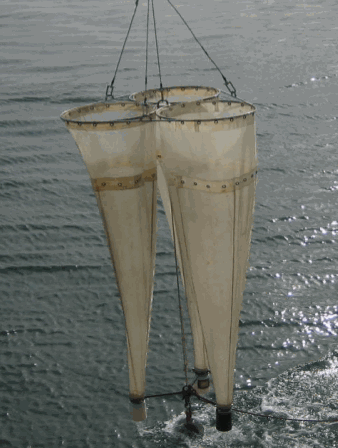
Zooplankton
Type of resources
Available actions
Topics
Keywords
Contact for the resource
Provided by
Years
Formats
Representation types
Update frequencies
status
Scale
-
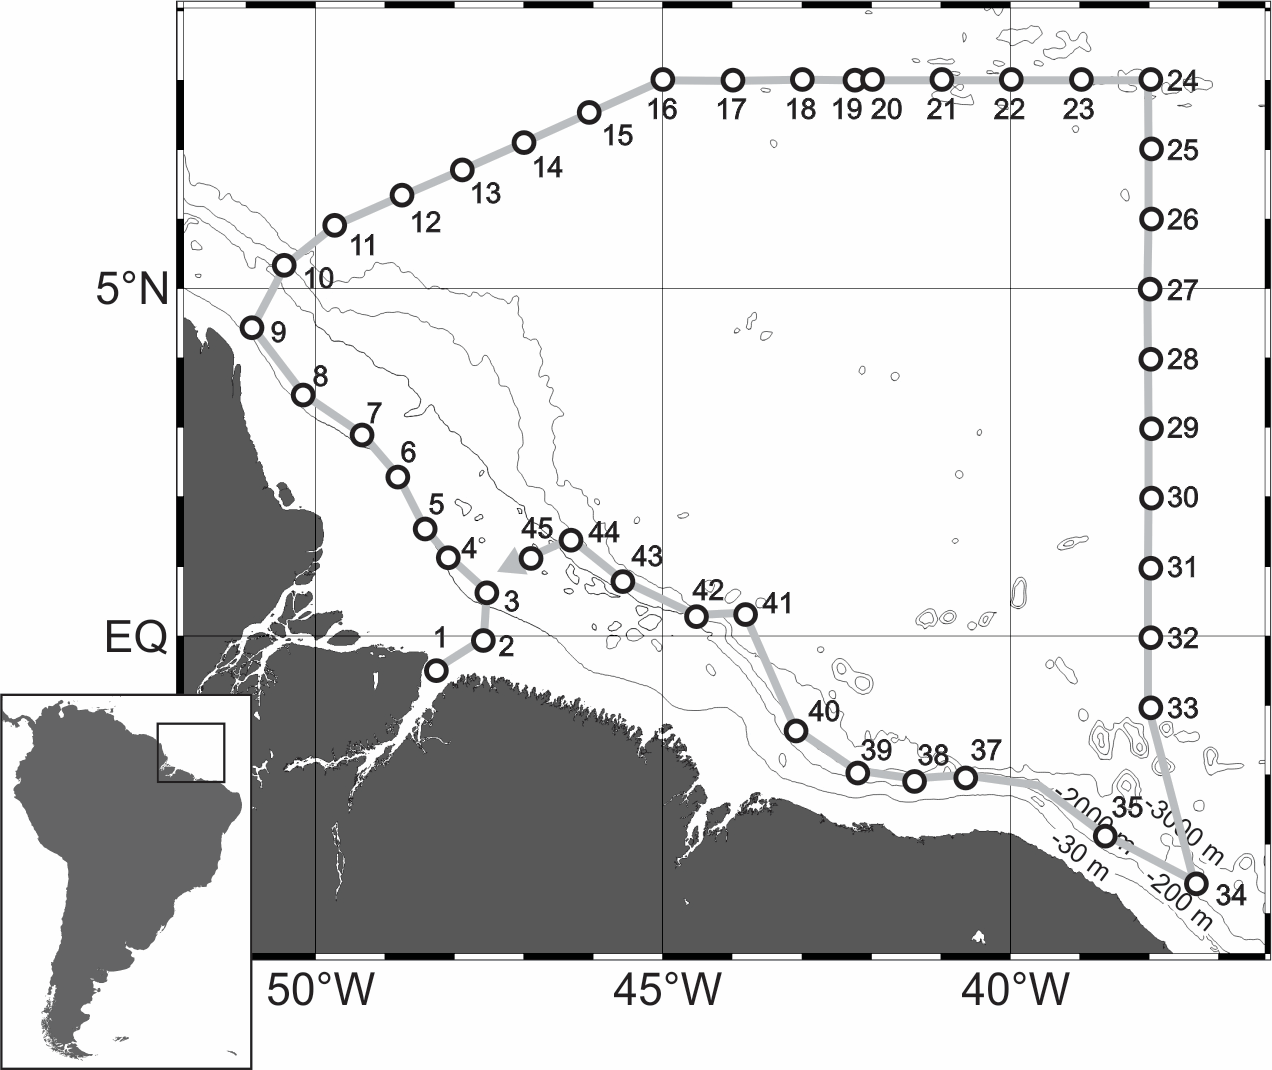
Abundance data (individuals.100 m-3) of planktonic cnidarians collected during the Camadas Finas III oceanographic cruise along the North Brazilian continental shelf between the Amazon and Oyapok river mouths and equatorial Atlantic oceanic waters between 8°N, 51°W and 3.5°S, 37°W. Data was obtained during the oceanographic cruise Camadas Finas III, aboard the research vessel NHo. Cruzeiro do Sul - H38 (DHN/Brazilian Navy), performed in 9-31 October 2012. Planktonic cnidarians were sorted from zooplankton samples collected at at 44 stations in oblique hauls, using Bongo nets with 120 and 300 µm mesh and 0.3 and 0.6 m mouth diameter, respectively. The water column was sampled from near the bottom to the surface over the continental shelf and from 200 m to the surface in the offshore. The net was towed at approximately 2 knots, at various times of day and night.
-

Abundance data (individuals.m-3) of large microzooplankton assemblages collected during two “Acoustics along the Brazilian coast” surveys (ABRACOS 1 and ABRACOS 2) performed along the northeast Brazilian continental shelf and slope between 5 and 9° S and around oceanic seamounts and islands from Fernando de Noronha ridge, including the Fernando de Noronha Archipelago itself and the Rocas Atoll. The surveys were carried out on board the French oceanographic vessel R/V Antea in austral spring (September–October 2015) and autumn (April–May 2017). Planktonic cnidarians were sorted from zooplankton samples collected at 34 and 45 stations in spring and autumn, respectively. Samples were collected through oblique hauls, with a Bongo net with a 64 µm mesh size and 0.3 m mouth opening. The water column was sampled from near the bottom to the surface over the continental shelf and from 200 m to the surface in the offshore. The net was towed at approximately 2 knots, at various times of day and night.
-
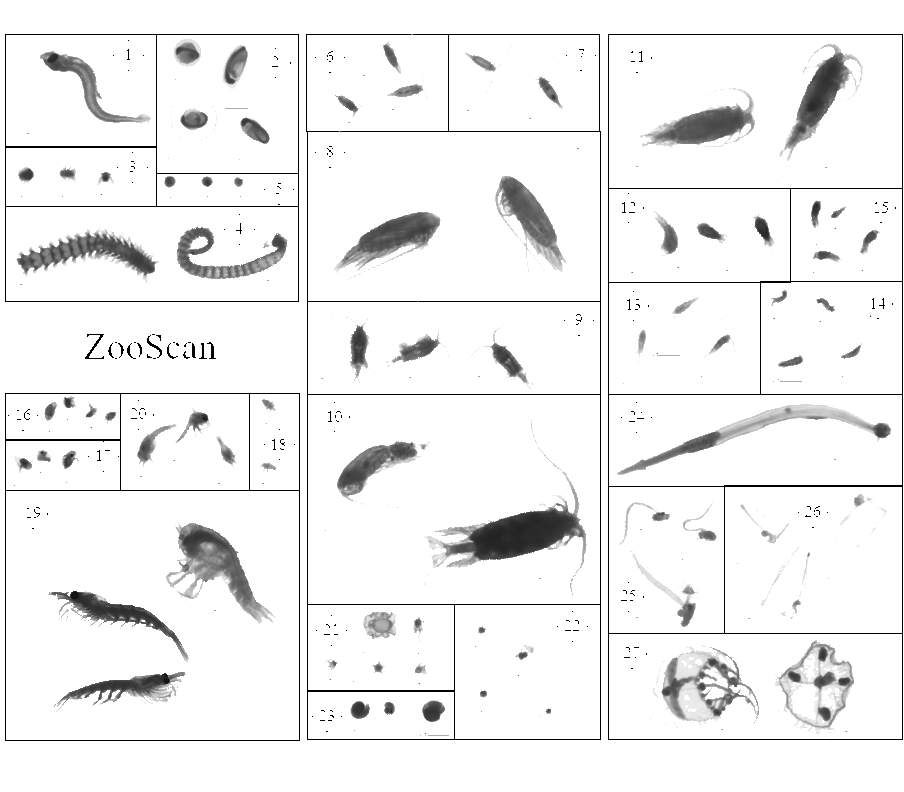
This dataset is composed of 1,153,507 zooplankton individuals, zooplankton parts, non-living particles and imaging artefacts, ranging from 300 µm to 3.39 mm Equivalent Spherical Diameter, individually imaged and measured with the ZooScan (Gorsky et al., 2010). The objects were sorted in 127 taxonomic and morphological groups. The imaged objects originate from samples collected on the Bay of Biscay continental shelf, in spring, from 2004 to 2016 during the PELGAS ecosystemic surveys (Doray et al., 2018). The samples were collected with a WP2 200 µm mesh size fitted with a Hydrobios (back-run stop) mechanical flowmeter, generally from 100 m depth to the surface, or 5 m above the sea floor (if bottom depth less than 100 m) in vertical hauls, at night. From 2004 to 2006, vertical WP2 net tows were performed in the anchovy core distribution area in the southern Bay of Biscay and North of it until the Loire estuary only. Since 2009, WP2 sampling has been carried out at all PELGAS stations, up to the southern coast of Brittany. The samples were preserved in 4% buffered formaldehyde seawater solution directly after collection, until 2019-2020 where they were imaged with the ZooScan, in the lab, on land. Each imaged object is geolocated, associated to a station, a cruise, a year and other metadata that enable the reconstruction of quantitative zooplankton communities for ecological studies (i.e. Grandrémy et al., 2023a). Each object is described by 46 morphological and grey level based features (8 bits encoding, 0 = black, 255 = white), including size, automatically extracted on each individual image by the Zooprocess. Each object was taxonomically identified using the web based application Ecotaxa with built-in, random forest and CNN based, semi-automatic sorting tools followed by expert validation or correction (Picheral et al., 2017). This dataset is intended to be used for ecological studies as well as machine learning applied to plankton studies. The archive contains: - One tab separated file (PELGAS ZooScan zooplankton dataset) containing all data and metadata associated to each imaged and identified object. Metadata and features are in columns (n =71) and objects are in rows (n = 1,153,507). - One comma separated file containing the name, type, definition and unit of each field (column) in the .tsv (dataset_descriptor_zooscan). - One comma separated file containing the taxonomic list of the dataset, with counts and nature of the content of the category, i.e. “T” for taxonomical category, and “M” for morphological category (taxonomy_descriptor_zooscan). - A individual_images directory containing images of each imaged object sorted in subdirectories named according to objects’ identifications object_taxon appended to an Ecotaxa internal taxon numerical id classif_id (i.e. taxon__123456789) across years and sampling stations. Within subdirectories, each object is named after its unique internal Ecotaxa identifier, objid. - A Map of the sampling station location over the 2004-2016 period
-
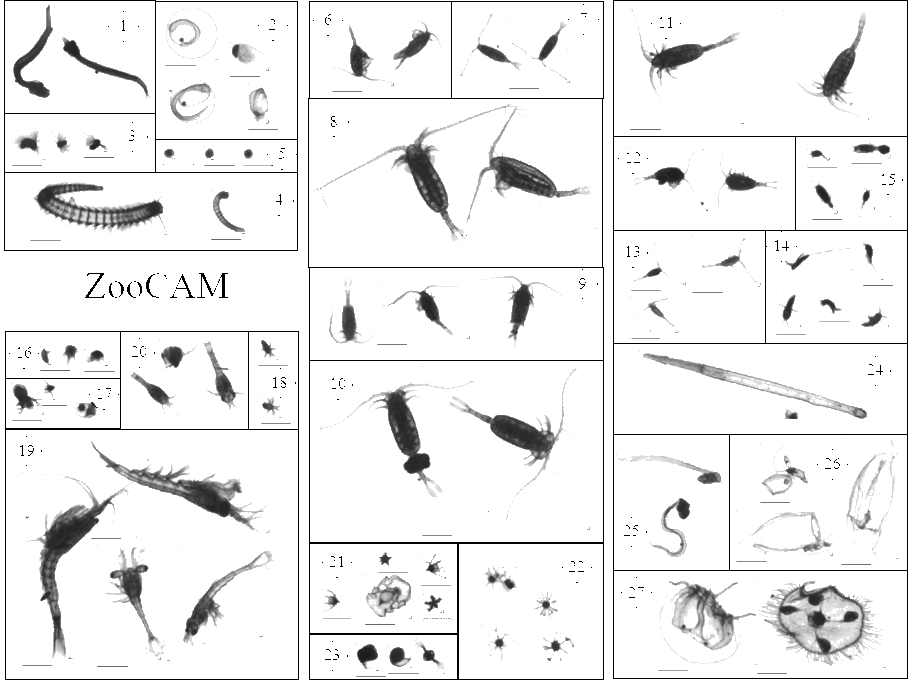
This dataset is composed of 702,111 zooplankton individuals, zooplankton pieces, non-living particles and imaging artefacts, ranging from 300 µm to 3.39 mm Equivalent Spherical Diameter, individually imaged and measured with the ZooCAM (Colas et al., 2018). The objects were sorted in 127 taxonomic and morphological groups. The imaged objects originate from samples collected on the Bay of Biscay continental shelf, in spring, from 2016 to 2019 during the PELGAS ecosystemic surveys (Doray et al., 2018). The samples were collected with a WP2 200 µm mesh size fitted with a Hydrobios (back-run stop) mechanical flowmeter, generally from 100 m depth to the surface, or 5 m above the sea floor (if bottom depth less than 100 m) in vertical hauls, at night. The samples were imaged on board, live, after collection and subsampling, and preserved in 4% buffered formaldehyde seawater. Each imaged object is geolocated, associated to a station, a cruise, a year and other metadata that enable the reconstruction of quantitative zooplankton communities for ecological studies (i.e. Grandrémy et al., 2023a). Each object is described by 52 morphological and grey level based features (8 bits encoding, 0 = black, 255 = white), including size, automatically extracted on each individual image by the ZooCAM software. Each object was taxonomically identified using the ZooCAM software and the web based application Ecotaxa with built-in, random forest and CNN based, semi-automatic sorting tools followed by expert validation or correction (Picheral et al., 2017). Images from 2016-2017 contain ROI bounding box limits, metadata at the bottom of each image, and non-homogenised background within and around the ROI bounding box; Images from 2018 contain non-homogenised background within the ROI bounding box only; images from 2019 have a completely homogeneous and thresholded background around the object. The differences arose from successive ZooCAM software updates that do not modify the calculation of object’s features. This dataset is intended to be used for ecological studies as well as machine learning applied to plankton studies. The archive contains : - One tab separated file (PELGAS ZooCAM zooplankton dataset) containing all data and metadata associated to each imaged and identified object. Metadata and features are in columns (n =72) and objects are in rows (n = 702,111). - One comma separated file containing the name, type, definition and unit of each field (column) in the .tsv (dataset descriptor zoocam). - One comma separated file containing the taxonomic list of the dataset, with counts and nature of the content of the category, i.e. “T” for taxonomical category, and “M” for morphological category (taxonomy descriptor zoocam). - A individual_images directory containing images of each object, named according to the object id objid and sorted in subdirectories according to their taxonomic identification, across years and sampling stations. - A Map of the sampling station location over the 2016-2019 period.
-

Abundance data (individuals.100 m-3) of planktonic cnidarians collected during two “Acoustics along the Brazilian coast” surveys (ABRACOS 1 and ABRACOS 2) performed along the northeast Brazilian continental shelf and slope between 5 and 9° S and around oceanic seamounts and islands from Fernando de Noronha ridge, including the Fernando de Noronha Archipelago itself and the Rocas Atoll. The surveys were carried out on board the French oceanographic vessel R/V Antea in austral spring (September–October 2015) and autumn (April–May 2017). Planktonic cnidarians were sorted from zooplankton samples collected at 34 and 45 stations in spring and autumn, respectively. Samples were collected through oblique hauls, with a Bongo net with a 300 µm mesh size and 0.6 m mouth opening. The water column was sampled from near the bottom to the surface over the continental shelf and from 200 m to the surface in the offshore. The net was towed at approximately 2 knots, at various times of day and night.
-
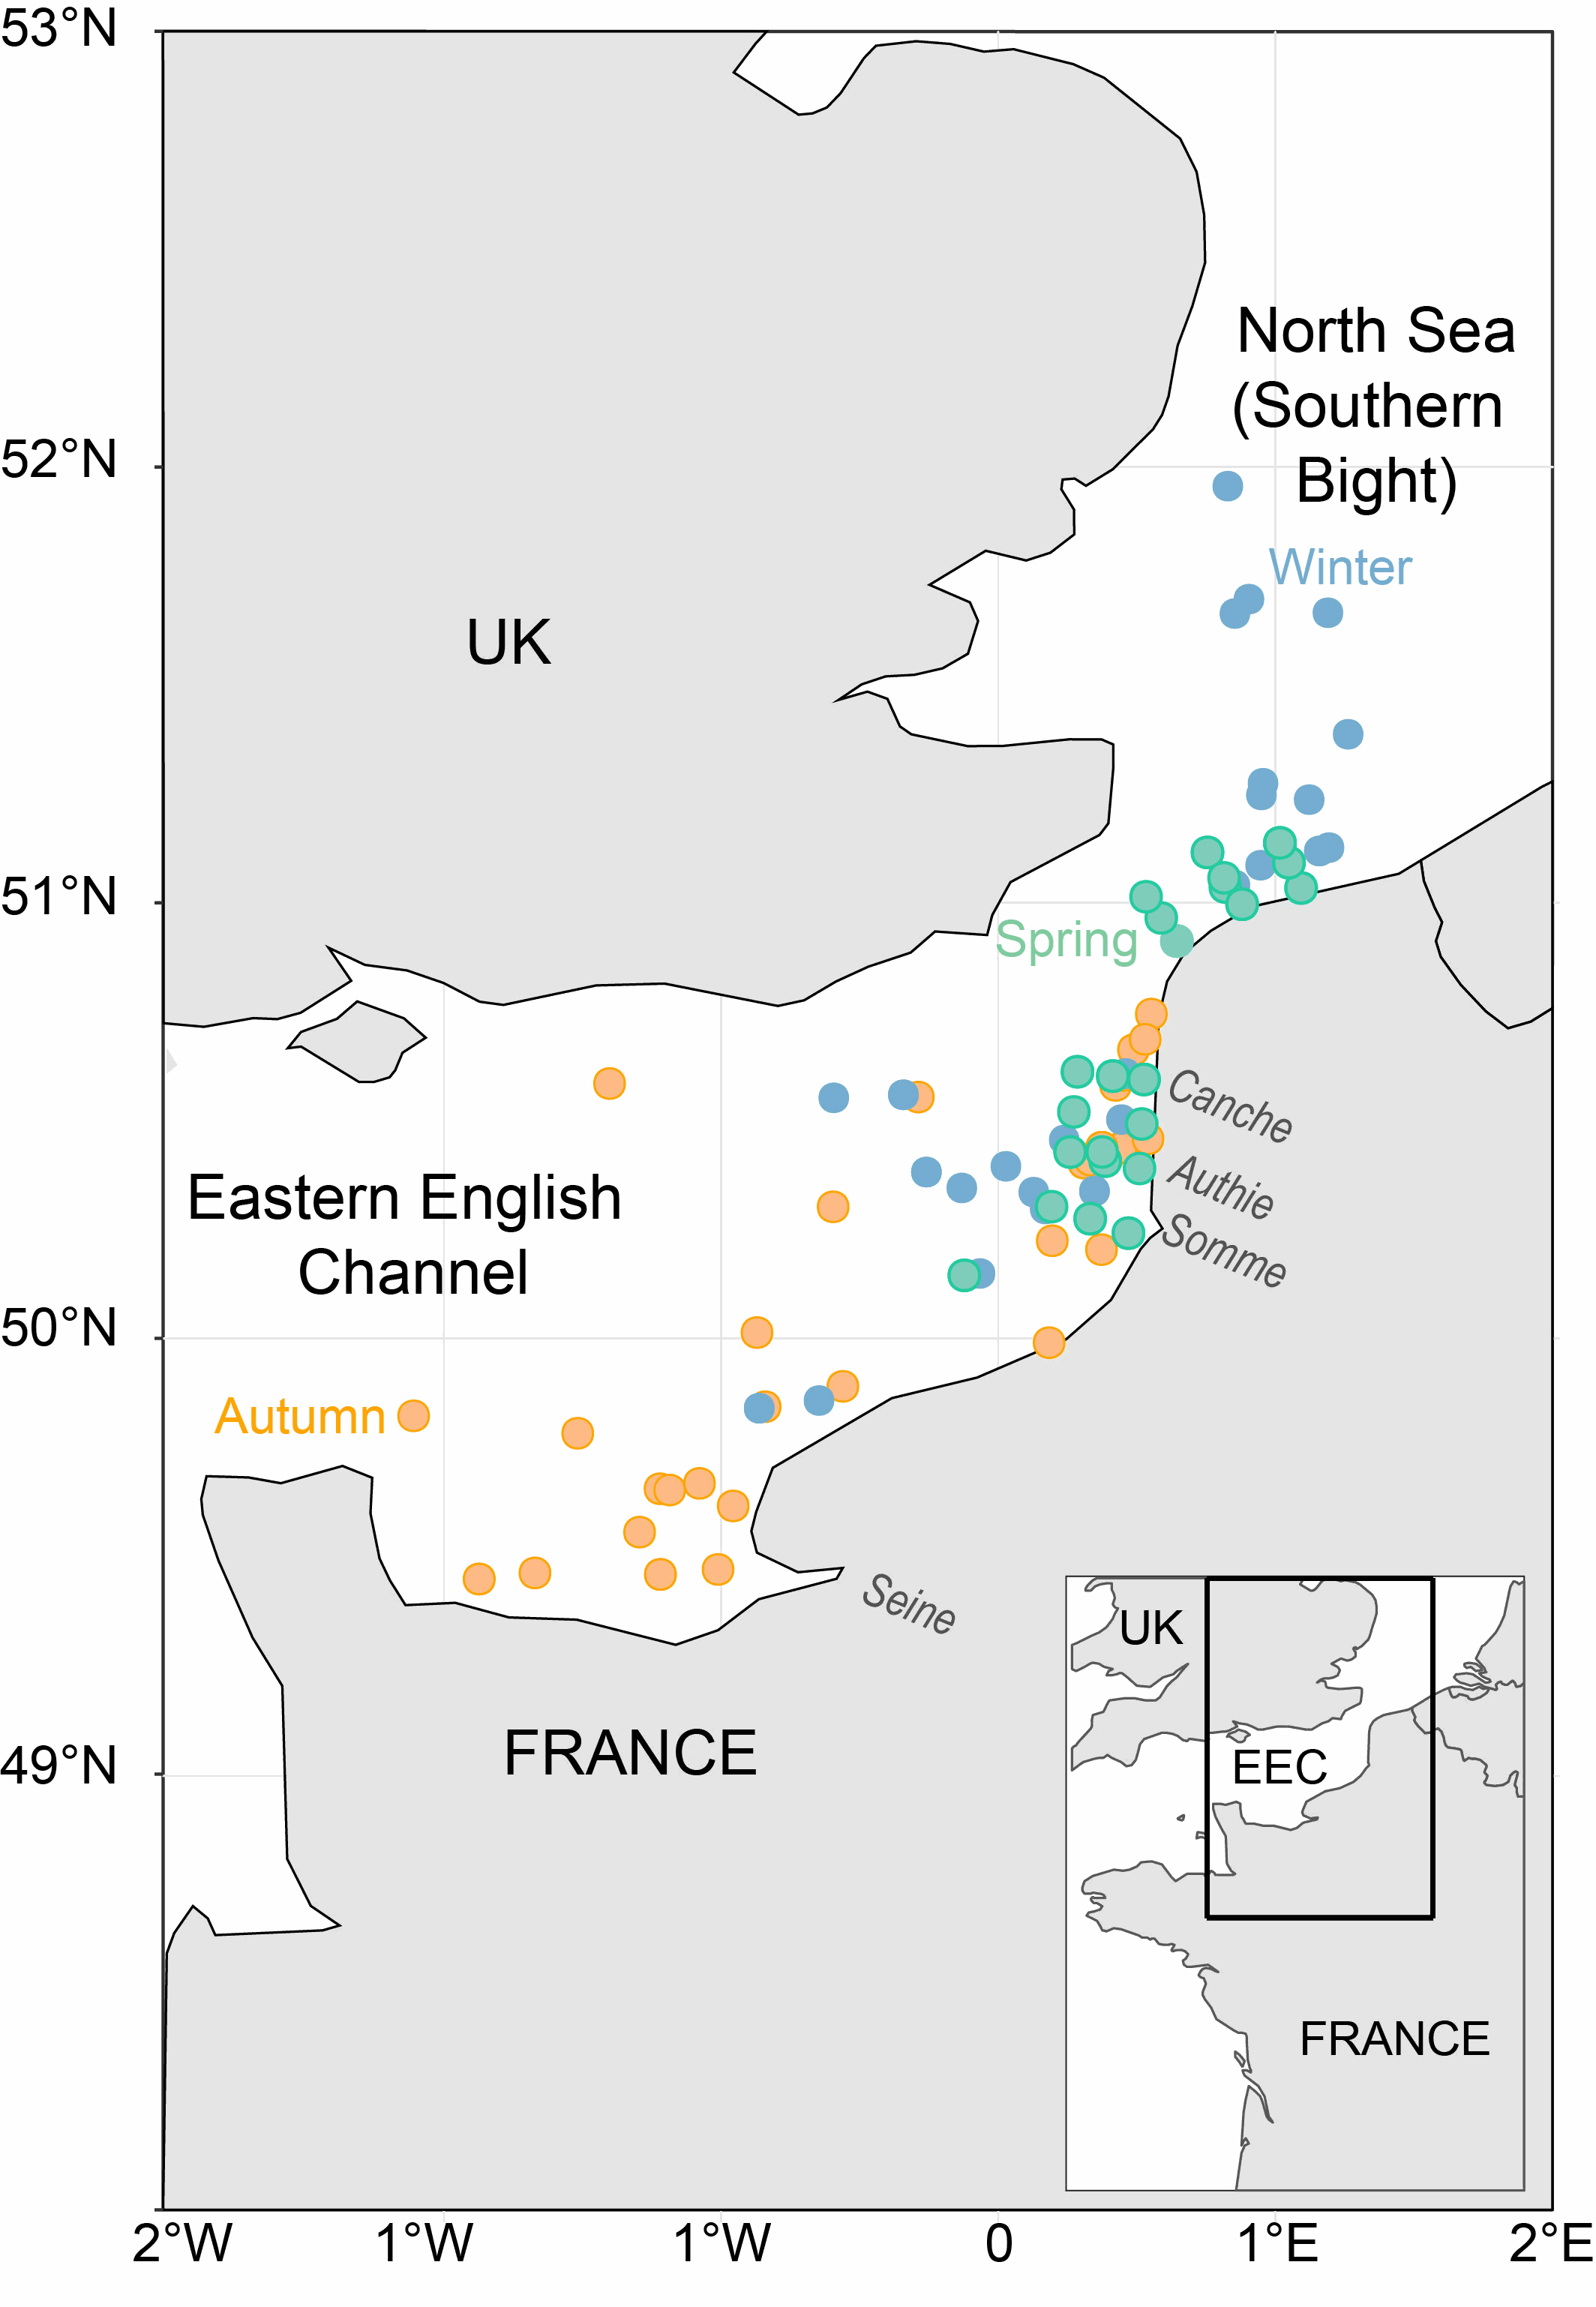
We report stable isotopes data, size measurements and environmental parameters for plankton collected between 2017 to 2019 in the Eastern English Channel and North Sea.
-

This dataset presents taxonomical identification and quantification of samples of zooplankton collected during the ABRACOS 1 (29 September–21 October 2015) and ABRACOS 2 (8 April–9 May 2017) expeditions along the northeastern Brazilian margin (approximately 3°S to 9°S and 35°W to 31°W), encompassing the continental shelf, the Fernando de Noronha Archipelago, Rocas Atoll, and adjacent seamounts. Zooplankton was sampled using two gears : (i) a bongo frame with four mesh size (64, 120, 300 and 500 µm) and (ii) a closing net (WP2, 200 µm). (i) Bongo sampling was conducted by towing a regular bongo frame with four nets fitted with mesh sizes of: - 64 µm (30 cm mouth diameter), - 120 µm (30 cm mouth diameter), - 300 µm (60 cm mouth diameter), - 500 µm (60 cm mouth diameter). At each station, one oblique haul was conducted from 200 m depth to the surface or from approximately 10 m above the seabed to the surface at stations shallower than 200 m. A Hydro-Bios flowmeter was mounted inside each net to estimate the volume of filtered seawater. . Samples were preserved in 4 % buffered formaldehyde (sodium tetraborate, 0.5 g L⁻¹; (Newell and Newell, 1977)). During ABRACOS 1, the entire sample from each mesh size was used for taxonomic identification and quantification. During ABRACOS 2, samples from each net were split into two equal fractions, one dedicated to taxonomy and the other to stable isotope analyses. - 64µm (large microzooplancton) samples were split until a minimum of 200 individuals was reached. Organisms were identified under a stereomicroscope to the finest possible taxonomic level primarily according to Boltovskoy (1999) and counted. Abundances were standardised to numbers of individuals per cubic metre (ind m⁻³) (Tosetto et al., 2024) and reported as “Density” in the datafiles. - 120µm samples were analysed under a stereomicroscope (Zeiss Stemi 2000-C). For ABRACOS 1 survey, the organisms were identified by large taxonomic group. The samples were divided into subsamples by a factor ranging from 2 to 512 (field Subpart) to obtain at least 300 organisms per sample. For each individual zooplanktonic organism, the major and minor axis (fields Major and Minor) were measured in mm. Individual elliptical biovolume (field EBV) in mm³ was calculated as (4/3) × π × (Major/2) × (Minor/2)². Standardized empirical biovolume per m3 (field EBV_STD) in mm³ m⁻³ for the considered individual was computed as EBV × Subpart)/Filtered_Volume, where Filtered_Volume is the total volume filtered for the considered net (Figueiredo et al., 2020). For ABRACOS 2 survey, organisms were identified to the finest taxonomical level possible and counted; measurement of organisms and individual biovolume estimation were not performed. For each organism, abundance was standardized to number of individuals per m3 (ind m⁻³) and reported as Density in the datafile. Users should note that taxonomic resolution differs between surveys for 120 µm samples, which may affect comparability. - 300µm and 500µm were analyzed under a ZooScan system. According to the concentration of organisms, the samples were split by a Motoda splitter into subsamples by a factor ranging from 2 to 512 (field Subpart) to obtain up to 2000 objects in each scan. Subsamples were digitised using the ZooScan (Hydroptic model ZSCAN03) with a 2400 dpi resolution, following the protocol established by Grosjean et al. (2004; http://www.zooscan.obs-vlfr.fr/). Images were then processed using the ZooProcess software (Version 7.19) to isolate each object into a single vignette and generate a range of quantitative descriptors (size, grey level distribution and shape parameters) for each. To classify the vignettes into pre-established taxonomic groups, a semi-automatic approach was initially used for ABRACOS 1 samples, using the Plankton Identifier software according to Gorsky et al. (2010) (Figueiredo et al., 2020), while EcoTaxa software was used for ABRACOS2. The samples from ABRACOS 1 were subsequently re-classified using EcoTaxa to ensure methodological consistency with ABRACOS 2. After classification, all results were manually validated and identified to the smallest taxonomic level possible by multiple specialists. For each individual zooplanktonic organism identified under the Zooscan, the following measurements are available: - The major and minor axes (fields Major and Minor) of each organism were measured in mm. - The area of the organisms (field Area) in mm2 was estimated as π × (Major/2) × (Minor/2) - Their equivalent spherical diameter (field ESD) in mm was estimated as √(Minor * Major) - Individual elliptical biovolume (field EBV) in mm³ was estimated as EBV = 4/3 × π × (Major/2) × (Minor/2)2 - Spherical biovolume (field SBV) was also inferred as 4/3 × π × (Area/π)3/2. - Standardized biovolumes per organism per m3 (fields EBV_STD and SBV_STD) in mm³.m⁻³ were calculated for both EBV and SBV, using the formulas: EBV_STD = ((EBV x Subpart)/Filtered_Volume) / Fraction SBV_STD = ((SBV x Subpart)/Filtered_Volume) / Fraction, where Filtered_Volume is the filtered volume in m3 and Fraction is the ratio of this filtered volume used for taxonomy (1 for ABRACOS 1, 0.5 for ABRACOS 2). (ii) Vertical zooplankton sampling was conducted using a WP2 closing net (200 µm mesh size). At each station, two vertical tows were performed: - One vertical tow 200 m to thermocline (identified as “inf” in the Layer field of the data files) - One vertical tow upper thermocline to surface (idendified as “sup”) Samples were fixed using formaldehyde 4%. The organisms were identified at the more precise taxonomic level possible and counted under stereomicroscope. Abundances were standardized in number of individuals per 1 m3 Data volume: During ABRACOS 1, 35 and 14 successful hauls were performed for taxonomy using bongo net and WP2 net, respectively. During ABRACOS 2, 49 and 30 successful hauls were performed for taxonomy using bongo net and WP2 net, respectively. Data organization: This dataset has been organised in several CSV files (one for each type for both survey): - ReadMe_Zooplankton_Abracos.txt : ReadMe file describing the structure of all data files. - ZooPlankton_Sampling_Abracos1.csv & ZooPlankton_Sampling_Abracos2.csv: description of the zooplankton sampling operations - Taxonomic_Reference_Zooplankton_Abracos.csv : Common taxonomic list for both surveys and sampling modes - Zooplankon_WP2_Abracos1.csv and Zooplankon_WP2_Abracos2.csv: data tables from WP2 sampling (density per taxa) - Zooplankton_64_Abracos1.csv and Zooplankton_64_Abracos2.csv: data tables from bongo 64 µm sampling (density per taxa) - Zooplankton_120_Abracos1.csv and Zooplankton_120_Abracos2.csv: data tables from bongo 120 µm sampling (biovolume per individual) - Zooplankton_300_500_Abracos1.csv and Zooplankton_300_500_Abracos2.csv : data tables from bongo 300 & 500 µm sampling (biovolume per individual)
-

This dataset contains the biological outputs of a global ocean simulation coupling dynamics and biogeochemistry at ¼° over the year 2019. The simulation has been performed using the coupled circulation/ecosystem model NEMO/PISCES (https://www.nemo-ocean.eu/), which is here enhanced to perform an ensemble simulation with explicit simulation of modeling uncertainties in the physics and in the biogeochemistry. This dataset is one of the 40 members of the ensemble simulation. This study was part of the Horizon Europe project SEAMLESS (https://seamlessproject.org/Home.html), with the general objective of improving the analysis and forecast of ecosystem indicators. See Popov et al. (https://os.copernicus.org/articles/20/155/2024/) for more details on the study.
-

'''Short description:''' Le modèle biogéochimique ECO-MARS3D sur la façade Manche Atlantique (PREVIMER_B1-ECOMARS3D-MANGA4000) est un modèle 3D de résolution spatiale 4km qui fournit les concentrations de nutriments et de plancton toutes les heures sur 30 niveaux (fenêtre de prévision à 4 jours). '''Paramètres calculés :''' Les paramètres calculés sont les suivants : * SAL : sea_water_salinity * TEMP : sea_water_temperature * suspended_inorganic_particulate_matter : mass_concentration_of_suspended_matter_in_sea_water * nanopicoplankton_nitrogen : mole_concentration_of_nanoplankton_expressed_as_nitrogen_in_sea_water * diatom_nitrogen : mole_concentration_of_diatoms_expressed_as_nitrogen_in_sea_water * dinoflagellate_nitrogen : mole_concentration_of_dinoflagellates_expressed_as_nitrogen_in_sea_water * microzooplankton_nitrogen : mole_concentration_of_microzooplankton_expressed_as_nitrogen_in_sea_water * mesozooplankton_nitrogen : mole_concentration_of_mesozooplankton_expressed_as_nitrogen_in_sea_water * colonial_phaeocystis_nitrogen : mole_concentration_of_colonial_phaeocystis_expressed_as_nitrogen_in_sea_water * phaeocystis_mucus : concentration_of_phaeocystis_mucus_expressed_as_mass_in_sea_water * ammonium : mole_concentration_of_ammonium_in_sea_water * nitrate : mole_concentration_of_nitrate_in_sea_water * dissolved_silicate : mole_concentration_of_silicate_in_sea_water * dissolved_phosphate : mole_concentration_of_phosphate_in_sea_water * dissolved_oxygen : dissolved_oxygen_in_water_column * cumulative_nanoflagellate_carbon_production : cumulative_nanoflagellate_production_expressed_as_carbon_in_sea_water * cumulative_diatom_carbon_production : cumulative_diatom_production_expressed_as_carbon_in_sea_water * cumulative_dinoflagellate_carbon_production : cumulative_dinoflagellate_production_expressed_as_carbon_in_sea_water * cumulative_phaeocystis_carbon_production : cumulative_phaeocystis_production_expressed_as_carbon_in_sea_water * organic_nitrogen_benth : mole_concentration_of_organic_detritus_expressed_as_nitrogen_in_benthos Les paramètres diagnostiques calculés sont les suivants : * XE : sea_surface_height_above_geoid * maximum_de_diat : maximum_diatom_mass_concentration_in_sea_water * maximum_de_dino : maximum_dinoflagellate_mass_concentration_in_sea_water * maximum_de_nano : maximum_nanoflagellate_mass_concentration_in_sea_water * grad_vert_salinite : maximum_vertical_gradient_of_sea_water_salinity * grad_vert_temp : maximum_vertical_gradient_of_sea_water_temperature * extinction_lumineuse : light_extinction_in_sea_water * prod_diat : cumulated_production_of_diatoms_in_sea_water_column_expressed_in_carbon * prod_dino : cumulated_production_of_dinoflagellates_in_sea_water_column_expressed_in_carbon * prod_nano : cumulated_production_of_nanoflagellates_in_sea_water_column_expressed_in_carbon * chlorophylle_a : chlorophyll_mass_concentration_in_sea_water * prod_cumul_chloro : cumulated_total_production_in_sea_water_column_expressed_in_carbon * maximum_de_phaeocystis : maximum_phaeocystis_mass_concentration_in_sea_water * prod_phaeocystis : cumulated_production_of_phaeocystis_in_sea_water_column_expressed_in_carbon * oxygen_saturation : oxygen_saturation * ammoniumGIRON_tracer_sign: mole_concentration_of_ammonium_in_sea_waterGIRON_tracer_sign * ammoniumGIRON_tracer_age: mole_concentration_of_ammonium_in_sea_waterGIRON_tracer_age * nitrateGIRON_tracer_sign: mole_concentration_of_nitrate_in_sea_waterGIRON_tracer_sign * nitrateGIRON_tracer_age: mole_concentration_of_nitrate_in_sea_waterGIRON_tracer_age * nanopicoplankton_nitrogenGIRON_tracer_sign: mole_concentration_of_nanoplankton_expressed_as_nitrogen_in_sea_waterGIRON_tracer_sign * nanopicoplankton_nitrogenGIRON_tracer_age: mole_concentration_of_nanoplankton_expressed_as_nitrogen_in_sea_waterGIRON_tracer_age * diatom_nitrogenGIRON_tracer_sign: mole_concentration_of_diatoms_expressed_as_nitrogen_in_sea_waterGIRON_tracer_sign * diatom_nitrogenGIRON_tracer_age: mole_concentration_of_diatoms_expressed_as_nitrogen_in_sea_waterGIRON_tracer_age * dinoflagellate_nitrogenGIRON_tracer_sign: mole_concentration_of_dinoflagellates_expressed_as_nitrogen_in_sea_waterGIRON_tracer_sign * dinoflagellate_nitrogenGIRON_tracer_age: mole_concentration_of_dinoflagellates_expressed_as_nitrogen_in_sea_waterGIRON_tracer_age * microzooplankton_nitrogenGIRON_tracer_sign: mole_concentration_of_microzooplankton_expressed_as_nitrogen_in_sea_waterGIRON_tracer_sign * microzooplankton_nitrogenGIRON_tracer_age: mole_concentration_of_microzooplankton_expressed_as_nitrogen_in_sea_waterGIRON_tracer_age * mesozooplankton_nitrogenGIRON_tracer_sign: mole_concentration_of_mesozooplankton_expressed_as_nitrogen_in_sea_waterGIRON_tracer_sign * mesozooplankton_nitrogenGIRON_tracer_age: mole_concentration_of_mesozooplankton_expressed_as_nitrogen_in_sea_waterGIRON_tracer_age * detrital_nitrogenGIRON_tracer_sign: mole_concentration_of_organic_detritus_expressed_as_nitrogen_in_sea_waterGIRON_tracer_sign * detrital_nitrogenGIRON_tracer_age: mole_concentration_of_organic_detritus_expressed_as_nitrogen_in_sea_waterGIRON_tracer_age * colonial_phaeocystis_nitrogenGIRON_tracer_sign: mole_concentration_of_colonial_phaeocystis_expressed_as_nitrogen_in_sea_waterGIRON_tracer_sign * colonial_phaeocystis_nitrogenGIRON_tracer_age: mole_concentration_of_colonial_phaeocystis_expressed_as_nitrogen_in_sea_waterGIRON_tracer_age * phaeocystis_cells_nitrogenGIRON_tracer_sign: mole_concentration_of_phaeocystis_cells_expressed_as_nitrogen_in_sea_waterGIRON_tracer_sign * phaeocystis_cells_nitrogenGIRON_tracer_age: mole_concentration_of_phaeocystis_cells_expressed_as_nitrogen_in_sea_waterGIRON_tracer_age * organic_nitrogen_benthGIRON_tracer_sign: mole_concentration_of_organic_detritus_expressed_as_nitrogen_in_benthosGIRON_tracer_sign * organic_nitrogen_benthGIRON_tracer_age: mole_concentration_of_organic_detritus_expressed_as_nitrogen_in_benthosGIRON_tracer_age * phytoplankton_sign_N_GIRON: nitrogen_fraction_in_phytoplankton_from_source_GIRON * phytoplankton_age_N_GIRON: age_of_nitrogen_fraction_in_phytoplankton_from_source_GIRON * ammoniumLOIRE_tracer_sign: mole_concentration_of_ammonium_in_sea_waterLOIRE_tracer_sign * ammoniumLOIRE_tracer_age: mole_concentration_of_ammonium_in_sea_waterLOIRE_tracer_age * nitrateLOIRE_tracer_sign: mole_concentration_of_nitrate_in_sea_waterLOIRE_tracer_sign * nitrateLOIRE_tracer_age: mole_concentration_of_nitrate_in_sea_waterLOIRE_tracer_age * nanopicoplankton_nitrogenLOIRE_tracer_sign: mole_concentration_of_nanoplankton_expressed_as_nitrogen_in_sea_waterLOIRE_tracer_sign * nanopicoplankton_nitrogenLOIRE_tracer_age: mole_concentration_of_nanoplankton_expressed_as_nitrogen_in_sea_waterLOIRE_tracer_age * diatom_nitrogenLOIRE_tracer_sign: mole_concentration_of_diatoms_expressed_as_nitrogen_in_sea_waterLOIRE_tracer_sign * diatom_nitrogenLOIRE_tracer_age: mole_concentration_of_diatoms_expressed_as_nitrogen_in_sea_waterLOIRE_tracer_age * dinoflagellate_nitrogenLOIRE_tracer_sign: mole_concentration_of_dinoflagellates_expressed_as_nitrogen_in_sea_waterLOIRE_tracer_sign * dinoflagellate_nitrogenLOIRE_tracer_age: mole_concentration_of_dinoflagellates_expressed_as_nitrogen_in_sea_waterLOIRE_tracer_age * microzooplankton_nitrogenLOIRE_tracer_sign: mole_concentration_of_microzooplankton_expressed_as_nitrogen_in_sea_waterLOIRE_tracer_sign * microzooplankton_nitrogenLOIRE_tracer_age: mole_concentration_of_microzooplankton_expressed_as_nitrogen_in_sea_waterLOIRE_tracer_age * mesozooplankton_nitrogenLOIRE_tracer_sign: mole_concentration_of_mesozooplankton_expressed_as_nitrogen_in_sea_waterLOIRE_tracer_sign * mesozooplankton_nitrogenLOIRE_tracer_age: mole_concentration_of_mesozooplankton_expressed_as_nitrogen_in_sea_waterLOIRE_tracer_age * detrital_nitrogenLOIRE_tracer_sign: mole_concentration_of_organic_detritus_expressed_as_nitrogen_in_sea_waterLOIRE_tracer_sign * detrital_nitrogenLOIRE_tracer_age: mole_concentration_of_organic_detritus_expressed_as_nitrogen_in_sea_waterLOIRE_tracer_age * colonial_phaeocystis_nitrogenLOIRE_tracer_sign: mole_concentration_of_colonial_phaeocystis_expressed_as_nitrogen_in_sea_waterLOIRE_tracer_sign * colonial_phaeocystis_nitrogenLOIRE_tracer_age: mole_concentration_of_colonial_phaeocystis_expressed_as_nitrogen_in_sea_waterLOIRE_tracer_age * phaeocystis_cells_nitrogenLOIRE_tracer_sign: mole_concentration_of_phaeocystis_cells_expressed_as_nitrogen_in_sea_waterLOIRE_tracer_sign * phaeocystis_cells_nitrogenLOIRE_tracer_age: mole_concentration_of_phaeocystis_cells_expressed_as_nitrogen_in_sea_waterLOIRE_tracer_age * organic_nitrogen_benthLOIRE_tracer_sign: mole_concentration_of_organic_detritus_expressed_as_nitrogen_in_benthosLOIRE_tracer_sign * organic_nitrogen_benthLOIRE_tracer_age: mole_concentration_of_organic_detritus_expressed_as_nitrogen_in_benthosLOIRE_tracer_age * phytoplankton_sign_N_LOIRE: nitrogen_fraction_in_phytoplankton_from_source_LOIRE * phytoplankton_age_N_LOIRE: age_of_nitrogen_fraction_in_phytoplankton_from_source_LOIRE * ammoniumSEINE_tracer_sign: mole_concentration_of_ammonium_in_sea_waterSEINE_tracer_sign * ammoniumSEINE_tracer_age: mole_concentration_of_ammonium_in_sea_waterSEINE_tracer_age * nitrateSEINE_tracer_sign: mole_concentration_of_nitrate_in_sea_waterSEINE_tracer_sign * nitrateSEINE_tracer_age: mole_concentration_of_nitrate_in_sea_waterSEINE_tracer_age * nanopicoplankton_nitrogenSEINE_tracer_sign: mole_concentration_of_nanoplankton_expressed_as_nitrogen_in_sea_waterSEINE_tracer_sign * nanopicoplankton_nitrogenSEINE_tracer_age: mole_concentration_of_nanoplankton_expressed_as_nitrogen_in_sea_waterSEINE_tracer_age * diatom_nitrogenSEINE_tracer_sign: mole_concentration_of_diatoms_expressed_as_nitrogen_in_sea_waterSEINE_tracer_sign * diatom_nitrogenSEINE_tracer_age: mole_concentration_of_diatoms_expressed_as_nitrogen_in_sea_waterSEINE_tracer_age * dinoflagellate_nitrogenSEINE_tracer_sign: mole_concentration_of_dinoflagellates_expressed_as_nitrogen_in_sea_waterSEINE_tracer_sign * dinoflagellate_nitrogenSEINE_tracer_age: mole_concentration_of_dinoflagellates_expressed_as_nitrogen_in_sea_waterSEINE_tracer_age * microzooplankton_nitrogenSEINE_tracer_sign: mole_concentration_of_microzooplankton_expressed_as_nitrogen_in_sea_waterSEINE_tracer_sign * microzooplankton_nitrogenSEINE_tracer_age: mole_concentration_of_microzooplankton_expressed_as_nitrogen_in_sea_waterSEINE_tracer_age * mesozooplankton_nitrogenSEINE_tracer_sign: mole_concentration_of_mesozooplankton_expressed_as_nitrogen_in_sea_waterSEINE_tracer_sign * mesozooplankton_nitrogenSEINE_tracer_age: mole_concentration_of_mesozooplankton_expressed_as_nitrogen_in_sea_waterSEINE_tracer_age * detrital_nitrogenSEINE_tracer_sign: mole_concentration_of_organic_detritus_expressed_as_nitrogen_in_sea_waterSEINE_tracer_sign * detrital_nitrogenSEINE_tracer_age: mole_concentration_of_organic_detritus_expressed_as_nitrogen_in_sea_waterSEINE_tracer_age * colonial_phaeocystis_nitrogenSEINE_tracer_sign: mole_concentration_of_colonial_phaeocystis_expressed_as_nitrogen_in_sea_waterSEINE_tracer_sign * colonial_phaeocystis_nitrogenSEINE_tracer_age: mole_concentration_of_colonial_phaeocystis_expressed_as_nitrogen_in_sea_waterSEINE_tracer_age * phaeocystis_cells_nitrogenSEINE_tracer_sign: mole_concentration_of_phaeocystis_cells_expressed_as_nitrogen_in_sea_waterSEINE_tracer_sign * phaeocystis_cells_nitrogenSEINE_tracer_age: mole_concentration_of_phaeocystis_cells_expressed_as_nitrogen_in_sea_waterSEINE_tracer_age * organic_nitrogen_benthSEINE_tracer_sign: mole_concentration_of_organic_detritus_expressed_as_nitrogen_in_benthosSEINE_tracer_sign * organic_nitrogen_benthSEINE_tracer_age: mole_concentration_of_organic_detritus_expressed_as_nitrogen_in_benthosSEINE_tracer_age * phytoplankton_sign_N_SEINE: nitrogen_fraction_in_phytoplankton_from_source_SEINE * phytoplankton_age_N_SEINE: age_of_nitrogen_fraction_in_phytoplankton_from_source_SEINE
-
This dataset gathers results of monthly sampling with a WP2 plankton net within the Gironde plume (Bay of Biscay) in 2008 from March to August, as part of the ECLAIR suite of surveys. The sampling in May was part of the ECLAIR time-series but was performed onboard the THALASSA vessel during the PELGAS 2008 survey. Results are made of anchovy and sardine egg abundances, as well as size-fractionnated zooplankton biomass.