2017
Type of resources
Available actions
Topics
Keywords
Contact for the resource
Provided by
Years
Formats
Representation types
Update frequencies
status
Service types
Scale
Resolution
-
This data product selects sample areas of digital bathymetry, chosen for their relevance to marine activities and data sources alternative to GEBCO. The approach for building the digital map of water depth is to use GEBCO as a baseline and look at a set of sample areas where GEBCO could be improved upon. Sample areas have also been selected to be representative of each continent bordering the Atlantic and expected future requirements. Data sources include GEBCO, EMODNET, USGS and CHS.
-

Localisation et description des sentiers de randonnées (GR, PDIPR, itinérance à pied, chemin local,sans classement). Localisation et description des tronçons (accessibilité/nature du sol/état...). Bornes/mats (description/état/historique des interventions...) Mobiliers (description/état/historique des interventions...)
-

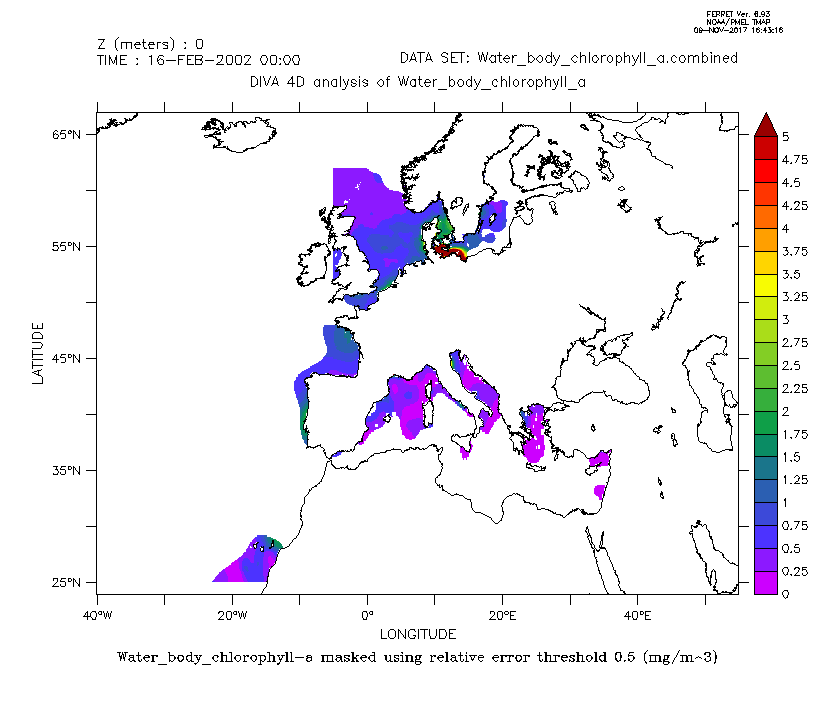
Combined product of Water body chlorophyll a based on DIVA 4D 10-year analysis on five regions : Northeast Atlantic Ocean, North Sea, Baltic Sea, Black Sea, Mediterranean Sea. The boundaries and overlapping zones between these five regions were filtered to avoid any unrealistic spatial discontinuities. This combined Water body chlorophyll a product is masked using the relative error threshold 0.5. Units: mg/m^3. Created by 'University of Liege, GeoHydrodynamics and Environment Research (ULg-GHER)'.
-

The EuroMapApp task of the AtlantOS project aims to integrate Europe’s existing and future bathymetric data sets from the Atlantic Ocean into a seamless whole and put these results into a widely accessible format allowing immediate visualization of the seafloor for the specialist and non-specialist user alike. The partner institutions are GEOMAR, Ifremer, NIOZ, and NERC-BODC.
-
Ce jeu de données donne la liste des campings du département de la Gironde, potentiellement exposés en cas de risque majeur.
-

Frise chronologique des millésimes de modes d'occupation des sols produits par les régions françaises et par le programme Corine Land Cover.
-
Temporal series (annual mean values) with error of estimation and Long Term Average (LTA) with error of estimation of total nitrogen load for each river mouth where in situ data is available. Different sources can be mixed if any.
-
Ce jeu de données donne les intercommunalités sur le département de la Gironde.
-

ICES hosts data collected from both net trawl surveys (primarily bottom trawling), and from echo sounding (acoustic sampling in the pelagic zone). The net trawls are primarily hosted in the DATRAS data portal, and the acoustics in the acoustic trawl surveys portal. DATRAS (the Database of Trawl Surveys) stores data collected primarily from bottom trawl fish surveys coordinated by ICES expert groups. The survey data are covering the Baltic Sea, Skagerrak, Kattegat, North Sea, English Channel, Celtic Sea, Irish Sea, Bay of Biscay and the eastern Atlantic from the Shetlands to Gibraltar. At present, there are more than 45 years of continuous time series data in DATRAS, and survey data are continuously updated by national institutions. The acoustic database hosts information on fisheries observations collected from various pelagic surveys coordinated by ICES and falls into two categories: acoustic data, derived from readings taken on vessels, and those obtained through trawls in the open ocean – pelagic – zone. Combined, this provides key biological data on fish stocks such as herring, mackerel and blue whiting as well as krill and other prey species. The data from both systems are used for stock assessments and fish community studies by the ICES community and form the basis of management advice to the relevant regulatory bodies.
-

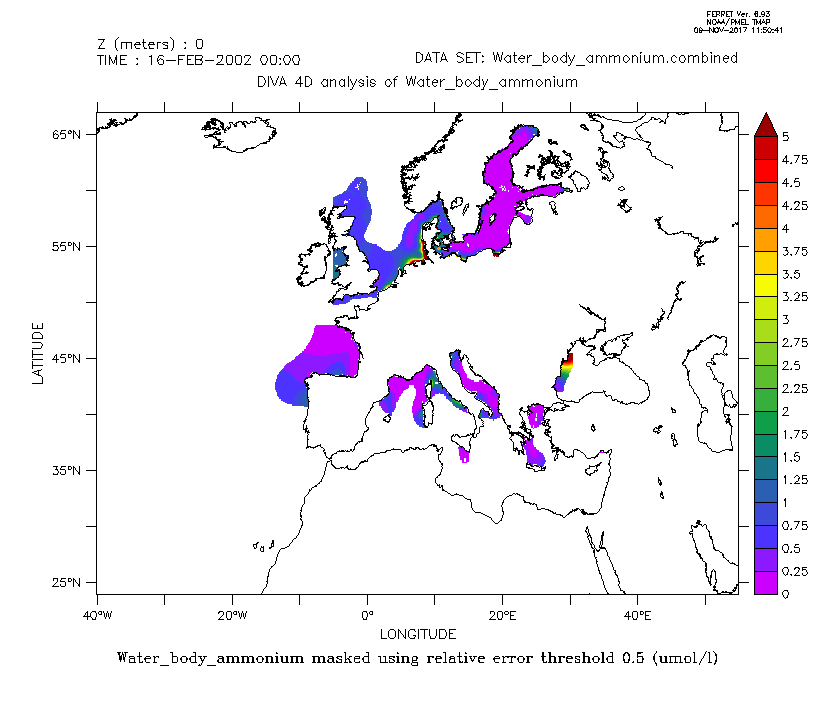
Combined product of Water body ammonium based on DIVA 4D 10-year analysis on five regions : Northeast Atlantic Ocean, North Sea, Baltic Sea, Black Sea, Mediterranean Sea. The boundaries and overlapping zones between these five regions were filtered to avoid any unrealistic spatial discontinuities. This combined Water body ammonium product is masked using the relative error threshold 0.5. Units: umol/l.
 Catalogue PIGMA