 Catalogue PIGMA
2015
Type of resources
Available actions
Topics
Keywords
Contact for the resource
Provided by
Years
Formats
Representation types
Update frequencies
status
Service types
Scale
Resolution
-

Etat d’avancement de la mise en place des Plan de Protection de l'Atmosphère (PPA) 8 mars 2013 (mis à jour le 24 septembre 2015) Afin de mieux répondre à l’urgence sanitaire causée par la pollution atmosphérique dans plusieurs zones du territoire national, une dynamique de mise en révision des Plans de Protection de l’Atmosphère existants et d’élaboration de nouveaux Plans a été lancée dans toutes les zones polluées de France. A l’heure actuelle : On compte 36 PPA en France, dont 28 signés 1 PPA sont en cours de révision 7 PPA sont en cours d’élaboration 47% de la population française est couverte par un PPA
-
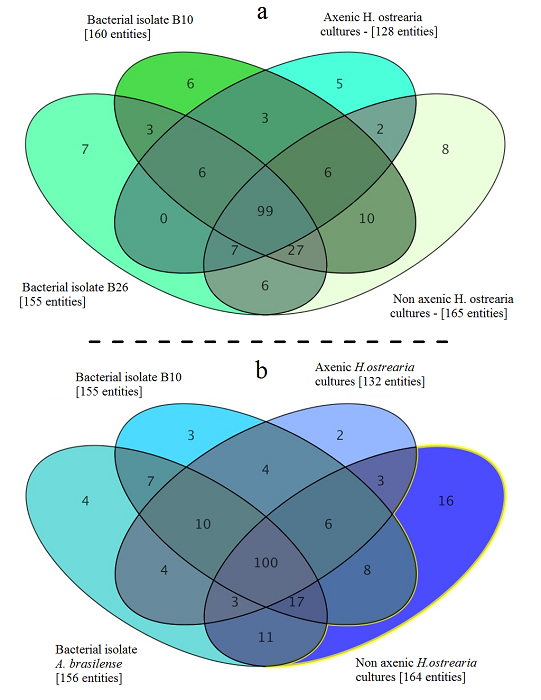
Metabolome of of the marine diatom Haslea ostrearia. Bacteria were isolated from Haslea ostrearia isolates cultivated in ES 1/3 medium in laboratory conditions over a 3-month period. These microalgal isolates were recovered from four sites on the French Atlantic coast: Bouin , La Barre-de-Monts (46.90 N; 2.11°W), Isle de Ré (46.22 N; 1.45°W), and La Tremblade (45.80 N; 1.15°W) . Data processing and statistical analysis of the metabolic profiles were performed on an LC/MS Metabolomics Discovery Workflow using Mass Profiler Professional Software and an Agilent 1290 Infinity II LC system coupled to an Agilent 6540 UHD Accurate-Mass QTOF hybrid mass spectrometer (Agilent Technologies, Waldbronn, Germany) equipped with a dual electrospray ionization (ESI) source. The full history (tools, parameters, input and output data files) is publicly available on http://dx.doi.org/10.12770/046e1e6a-864e-48a6-944b-d8613d67de0f
-
Specification of the desirable and recomended product attributes for generating spatial layers of sea surface temperature temperature trend for the last 10, 50, 100 years for the Mediterranean basin and for each NUTS3 region along the coast.
-
SeaDataNet Temperature and Salinity historical data collection v2, including revised quality flags after quality control with ODV. For data access please register at http://www.marine-id.org
-
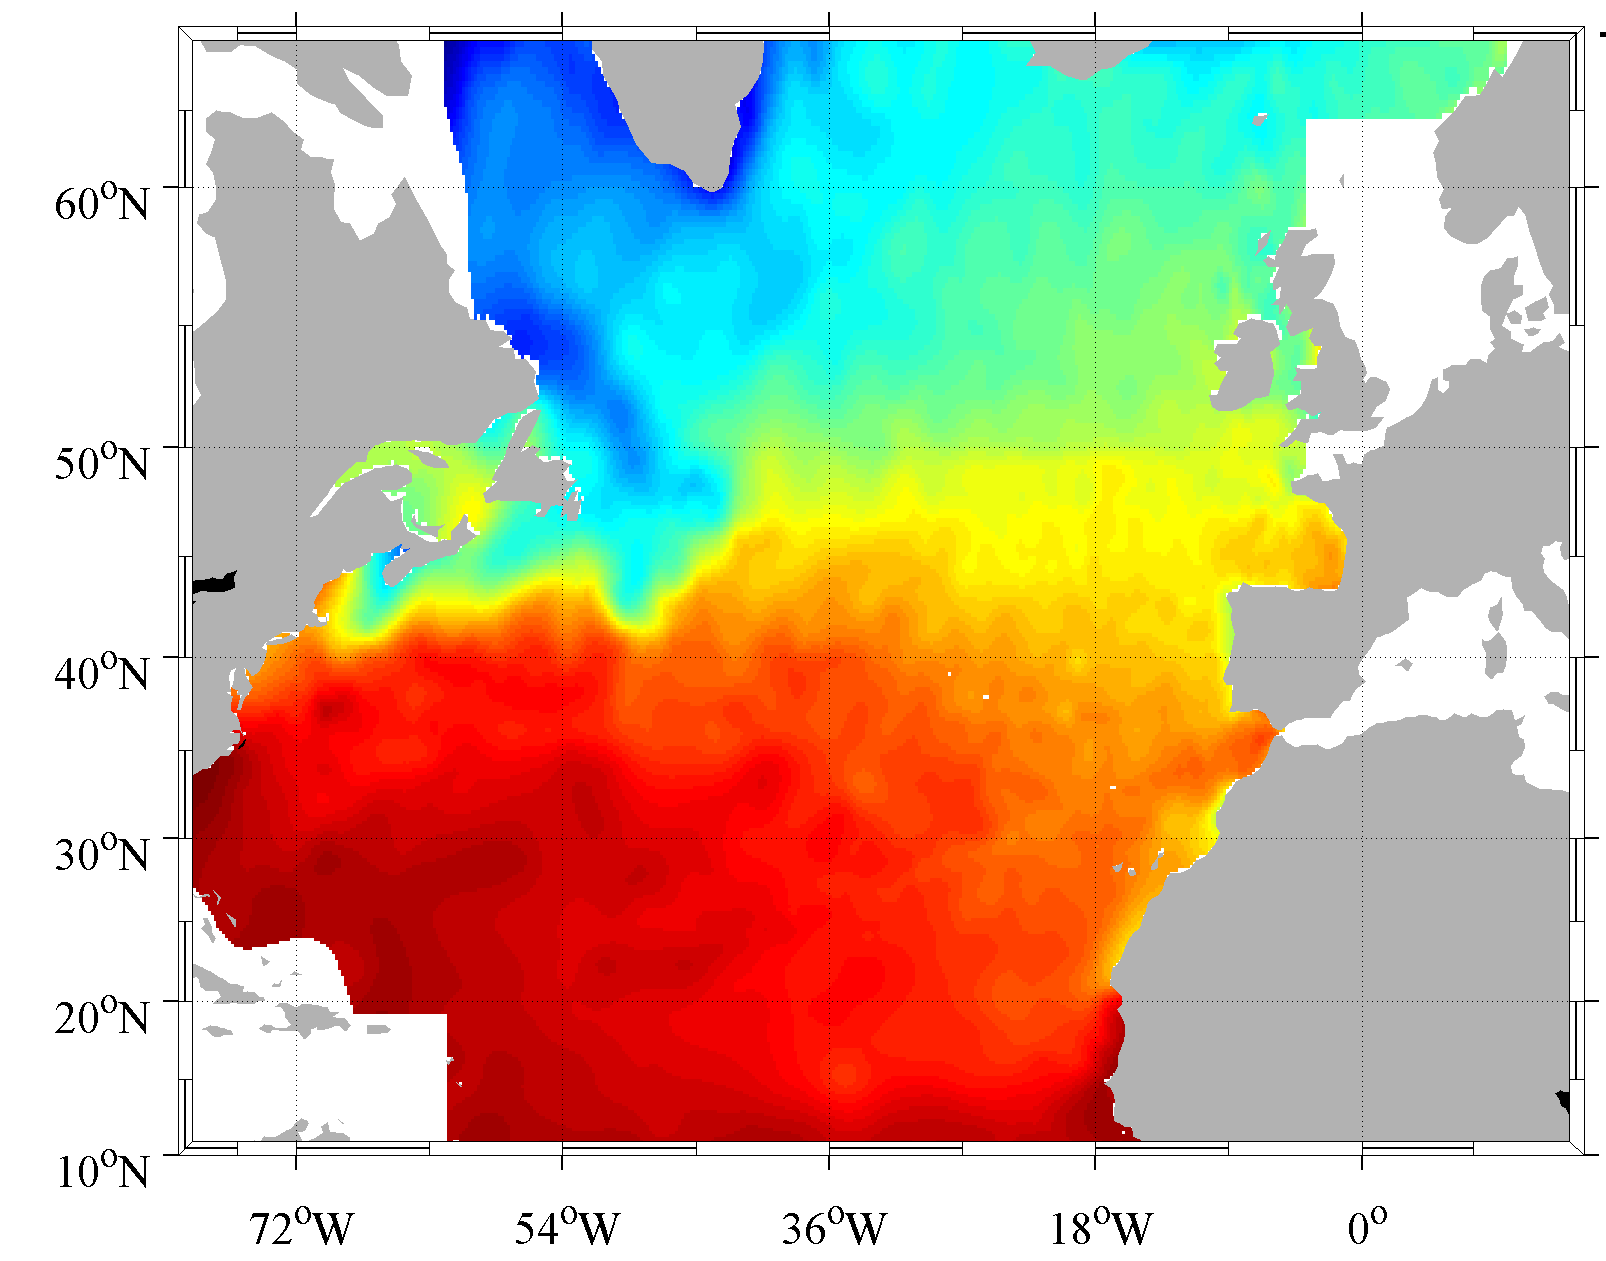
Climatology done from the SeaDataNet aggregated dataset v1.1 for the North Atlantic Ocean. The version used for the DIVA software is the 4.6.9. The period covers 1900-2013. For data access please register at http://www.marine-id.org
-

Les périmètres des quartiers prioritaires de la politique de la ville sont fixés par le décret n° 2014-1750 du 30 décembre 2014 pour la métropole et par le décret n° 2014-1751 du 30 décembre 2014 pour les départements et collectivités d’outre-mer, rectifiés par le décret n°2015-1138 du 14 septembre 2015.
-

Avec près de 1,4 millions d’hectares de surface agricole utilisée et 100 000 ha d'estives, l'agriculture occupe en 2010 près de 35 % du territoire aquitain. Par son assolement diversifié, elle contribue largement à la diversité des paysages et la structuration de l'espace régional. Toutefois, au cours de la dernière décennie, plus de 96 000 hectares ont quitté le giron de l'agriculture...
-
Specification of the desirable and recommended product attributes for generating spatial layers of annual avergae internal energy for the last 20 years.
-
Specification of the desirable and recommended product attributes for generating spatial layers of sea-level trend (units: mm/year) from tide gauges over periods of 50 years (1963-2012) and 100 years (1913-2012), to characterize and assess average annual sea-level rise at the coast.
-
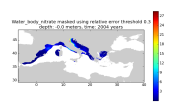
Moving 10-years analysis of nitrates at Mediterranean Sea for each season : - winter (January-March), - spring (April-June), - summer (July-September), - autumn (October-December). Every year of the time dimension corresponds to the 10-year centered average of each season. Decades span from 1960-1969 until 2004-2013. Observational data span from 1960 to 2013. Depth range (IODE standard depths): -1500.0, -1400.0, -1300.0, -1200.0, -1100.0, -1000.0, -900.0, -800.0, -700.0, -600.0, -500.0, -400.0, -300.0, -250.0, -200.0, -150.0, -125.0, -100.0, -75.0, -50.0, -30.0, -20.0, -10.0, -5.0, -0.0. Data Sources: observational data from SeaDataNet/EMODNet Chemistry Data Network. Description of DIVA analysis: Geostatistical data analysis by DIVA (Data-Interpolating Variational Analysis) tool. Profiles were interpolated at standard depths using weighted parabolic interpolation algorithm (Reiniger and Ross, 1968). GEBCO 1min topography is used for the contouring preparation. Analyzed filed masked using relative error threshold 0.3 and 0.5. DIVA settings: A constant value for signal-to-noise ratio was used equal to 3. Correlation length was optimized and filtered vertically and a seasonally-averaged profile was used. Logarithmic transformation applied to the data prior to the analysis. Background field: the data mean value is subtracted from the data. Detrending of data: no. Advection constraint applied: no. Originators of Italian data sets-List of contributors • Brunetti Fabio (OGS) • Cardin Vanessa, Bensi Manuel doi:10.6092/36728450-4296-4e6a-967d-d5b6da55f306 • Cardin Vanessa, Bensi Manuel, Ursella Laura, Siena Giuseppe doi:10.6092/f8e6d18e-f877-4aa5-a983-a03b06ccb987 • Cataletto Bruno (OGS) • Cinzia Comici Cinzia (OGS) • Civitarese Giuseppe (OGS) • DeVittor Cinzia (OGS) • Giani Michele (OGS) • Kovacevic Vedrana (OGS) • Mosetti Renzo (OGS) • Solidoro C.,Beran A.,Cataletto B.,Celussi M.,Cibic T.,Comici C.,Del Negro P.,De Vittor C.,Minocci M.,Monti M.,Fabbro C.,Falconi C.,Franzo A.,Libralato S.,Lipizer M.,Negussanti J.S.,Russel H.,Valli G., doi:10.6092/e5518899-b914-43b0-8139-023718aa63f5 • Celio Massimo (ARPA FVG) • Malaguti Antonella (ENEA) • Fonda Umani Serena (UNITS) • Bignami Francesco (ISAC/CNR) • Boldrini Alfredo (ISMAR/CNR) • Marini Mauro (ISMAR/CNR) • Miserocchi Stefano (ISMAR/CNR) • Zaccone Renata (IAMC/CNR) • Lavezza, R., Dubroca, L. F. C., Ludicone, D., Kress, N., Herut, B., Civitarese, G., Cruzado, A., Lefèvre, D., Souvermezoglou, E., Yilmaz, A., Tugrul, S., and Ribera d’Alcala, M.: Compilation of quality controlled nutrient profiles from the Mediterranean Sea, doi:10.1594/PANGAEA.771907, 2011. Units: umol/l