 Catalogue PIGMA
Helpdesk CERSAT
Type of resources
Topics
Keywords
Contact for the resource
Provided by
Years
Formats
Representation types
status
Scale
Resolution
-

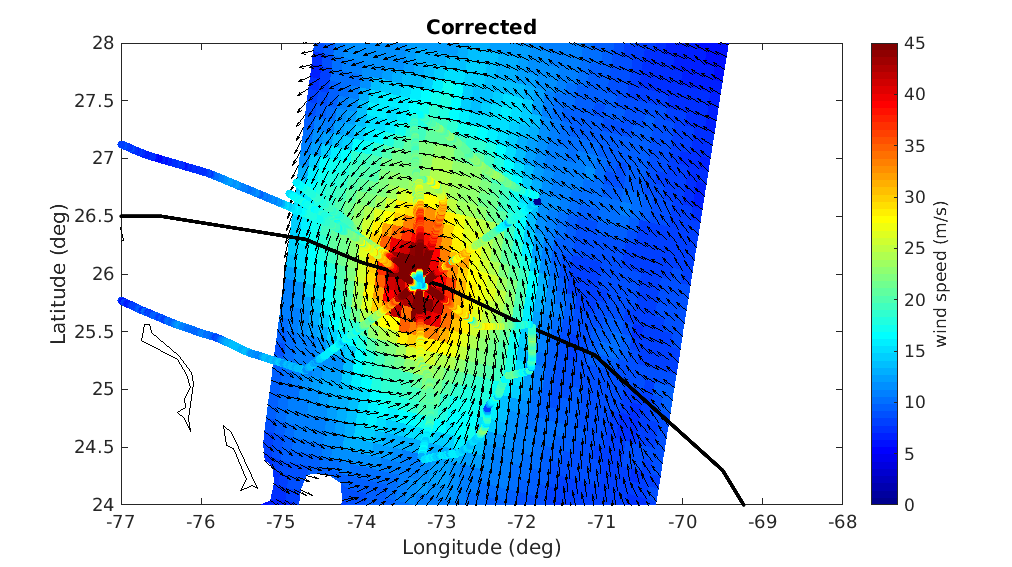
This daily High-Resolution (HR) Level 3 gridded wind product is derived from Copernicus Sentinel-1 SAR (Synthetic Aperture Radar) observations, over the North Western Atlantic ("ATL" area). It is based on the European Space Agency (ESA) Level-2 OCN products at the highest available resolution. Although L2-OCN products already contain wind vectors, those are calculated using the CMOD5.n Geophysical Model Function (GMF) applied to the co-polarized (co-pol) VV channel (emitting in Vertical polarization and receiving in Vertical polarization). This VV GMF was mapped from scatterometer sensors (Hersbach et al., 2007) which are only able to use co-pol measurements. However, these co-pol GMF are known to lose sensitivity for wind above 20 m/s. Therefore, wind based on such GMF alone, are known to under-estimate wind speed (Polverari et al., 2022). For the L3 products winds based on SAR, we take advantage of the available cross-polarized (cross-pol) VH channel (emitting in Vertical polarization and receiving in Horizontal polarization) for which GMF were specifically derived based on C-Band SAR (Mouche et al., 2017, Mouche et al., 2019). Winds estimated from the combination of both the co-pol and cross-pol channels are referred to as dual-polarization (or dual-pol) winds. As shown in Mouche et al. (2019), taking advantage of the dual polarization strongly improves the wind estimation for high wind conditions thanks to the much greater VH channel sensitivity compared to VV. These new wind estimations are then gridded with a 0.012 degree resolution (between 0.5 and 1.2 km in zonal direction depending on the latitude and 1.3 km in meridional direction) using a cylindrical equidistant projection, independently for ascending and descending satellite passes and for each satellite (so 4 wind fields are available per day for two satellites). This dataset is generated over all Sentinel-1 mission time series starting from March 2018 and updated in delayed mode with a 4-months delay. It is also produced for 4 other different European areas. This dataset is produced and disseminated in the frame of Copernicus Marine Service.
-

This daily High-Resolution (HR) Level 3 gridded wind product is derived from Copernicus Sentinel-1 SAR (Synthetic Aperture Radar) observations, over the Mediterranean Sea ("MED" area). It is based on the European Space Agency (ESA) Level-2 OCN products at the highest available resolution. Although L2-OCN products already contain wind vectors, those are calculated using the CMOD5.n Geophysical Model Function (GMF) applied to the co-polarized (co-pol) VV channel (emitting in Vertical polarization and receiving in Vertical polarization). This VV GMF was mapped from scatterometer sensors (Hersbach et al., 2007) which are only able to use co-pol measurements. However, these co-pol GMF are known to lose sensitivity for wind above 20 m/s. Therefore, wind based on such GMF alone, are known to under-estimate wind speed (Polverari et al., 2022). For the L3 products winds based on SAR, we take advantage of the available cross-polarized (cross-pol) VH channel (emitting in Vertical polarization and receiving in Horizontal polarization) for which GMF were specifically derived based on C-Band SAR (Mouche et al., 2017, Mouche et al., 2019). Winds estimated from the combination of both the co-pol and cross-pol channels are referred to as dual-polarization (or dual-pol) winds. As shown in Mouche et al. (2019), taking advantage of the dual polarization strongly improves the wind estimation for high wind conditions thanks to the much greater VH channel sensitivity compared to VV. These new wind estimations are then gridded with a 0.012 degree resolution (between 0.5 and 1.2 km in zonal direction depending on the latitude and 1.3 km in meridional direction) using a cylindrical equidistant projection, independently for ascending and descending satellite passes and for each satellite (so 4 wind fields are available per day for two satellites). This dataset is generated over all Sentinel-1 mission time series starting from March 2018 and updated in delayed mode with a 4-months delay. It is also produced for 4 other different European areas. This dataset is produced and disseminated in the frame of Copernicus Marine Service.
-
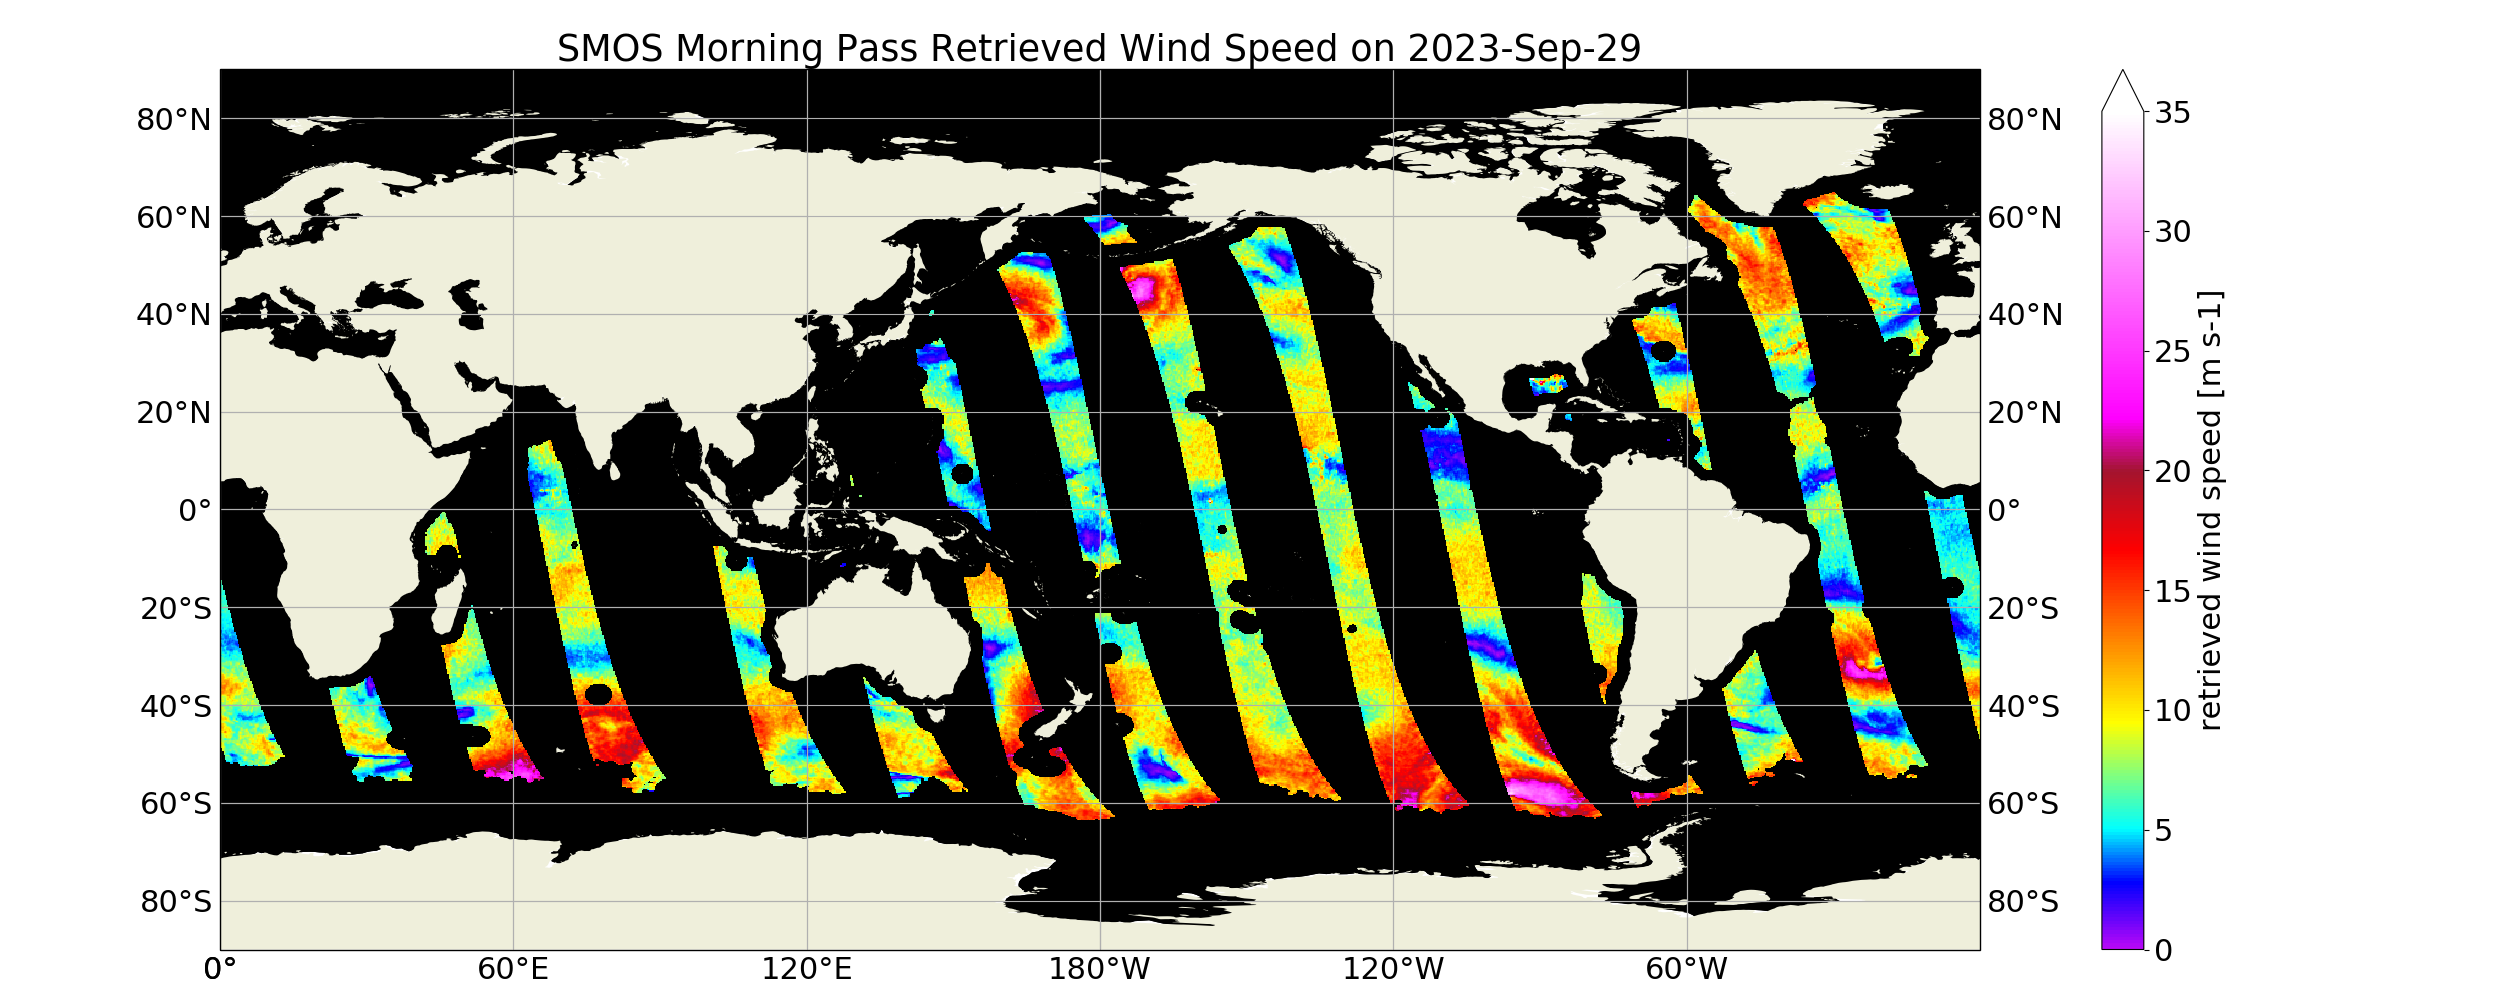
“SMOS Level 3 daily wind speed” (SMOS L3WS) products are daily composite maps of the collected SMOS L2 swath wind products for a specific day, provided with the same grid than the Level 2 wind data (SMOS L2WS NRT) but separated into ascending and descending passes. SMOS L3WS products are available the day after from sensing and are generated in NetCDF-4 format as described in the "SMOS Wind Data Service Product Description Document" (http://www.smosstorm.org/Document-tools/SMOS-Wind-Data-Service-Documentation ).
-

This dataset contains the high-frequency total horizontal current at 15m depth on a global grid at 1/4° resolution. It is composed by the addition of two components, the first is the Geostrophic current derived by Altimetry, from the DT-2018 CMEMS database, and the second is the unsteady-Ekman ageostrophic component forced by the wind. All the details about the algorithm and the physical content of this ageostrophy component are given in the ATBD. The data are available through HTTP and FTP; access to the data is free and open. This dataset was generated by Datlas Ocean and is distributed by Ifremer / CERSAT in the frame of the World Ocean Circulation (WOC) project funded by the European Space Agency (ESA).
-
A prerequisite for a successful development of a multi-mission wind dataset is to ensure good inter-calibration of the different extreme wind datasets to be integrated in the product. Since the operational hurricane community is working with the in-situ dropsondes as wind speed reference, which are in turn used to calibrate the NOAA Hurricane Hunter Stepped Frequency Microwave Radiometer (SFMR) wind data, MAXSS has used the latter to ensure extreme-wind inter-calibration among the following scatterometer and radiometer systems: the Advanced Scatterometers onboard the Metop series (i.e., ASCAT-A, -B, and -C), the scatterometers onboard Oceansat-2 (OSCAT) and ScatSat-1 (OSCAT-2), and onboard the HY-2 series (HSCAT-A, -B); the Advanced Microwave Scanning Radiometer 2 onboard GCOM-W1(AMSR-2), the multi-frequency polarimetric radiometer (Windsat), and the L-band radiometers onboard the Soil Moisture and Ocean Salinity (SMOS) and the Soil Moisture Active Passive (SMAP) missions. In summary, a two-step strategy has been followed to adjust the high and extreme wind speeds derived from the mentioned scatterometer and radiometer systems, available in the period 2009-2020. First, the C-band ASCATs have been adjusted against collocated storm-motion centric SFMR wind data. Then, both SFMR winds and ASCAT adjusted winds have been used to adjust all the other satellite wind systems. In doing so, a good inter-calibration between all the systems is ensured not only under tropical cyclone (TC) conditions, but also elsewhere. This dataset was produced in the frame of the ESA funded Marine Atmosphere eXtreme Satellite Synergy (MAXSS) project. The primary objective of the ESA Marine Atmosphere eXtreme Satellite Synergy (MAXSS) project is to provide guidance and innovative methodologies to maximize the synergetic use of available Earth Observation data (satellite, in situ) to improve understanding about the multi-scale dynamical characteristics of extreme air-sea interaction.
-
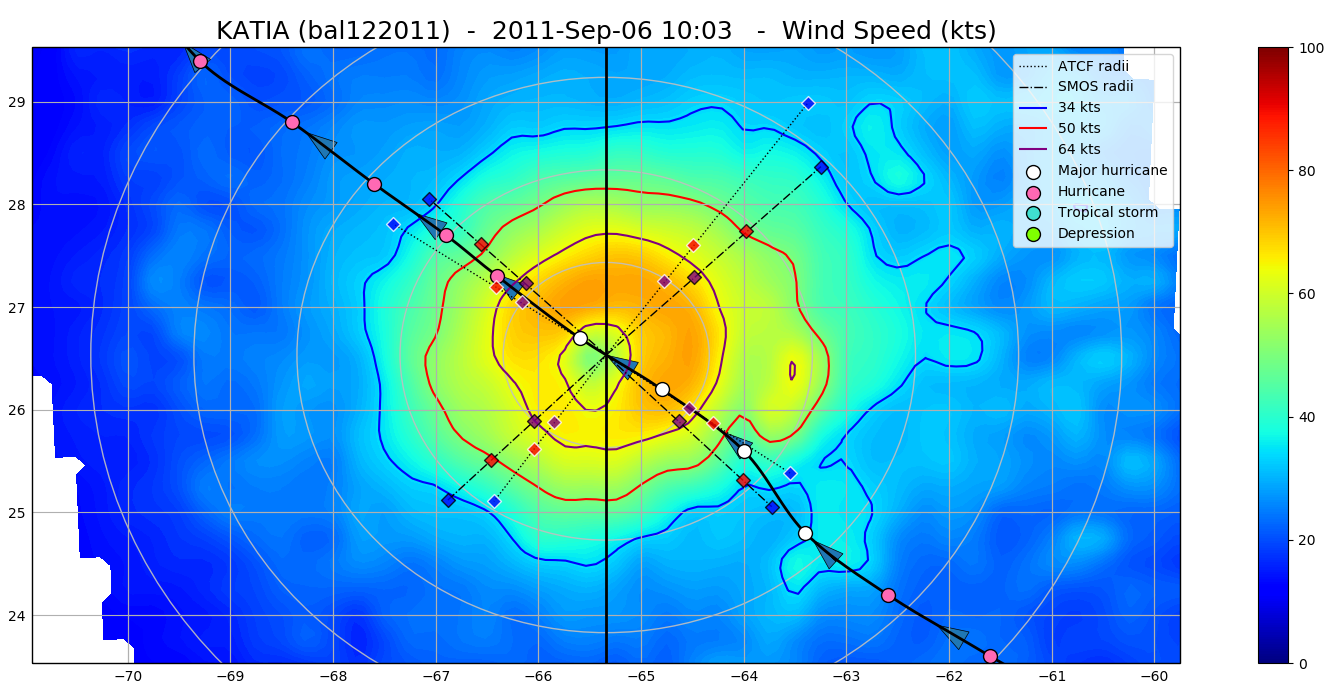
The SMOS WRF product is available in Near Real Time to support tropical cyclones (TC) forecasts. It is generated within 4 to 6 hours from sensing from the SMOS L2 swath wind speed products (SMOS L2WS NRT), in the so-called "Fix (F-deck)" format compatible with the US Navy's ATCF (Automated Tropical Cyclone Forecasting) System. The SMOS WRF "fixes" to the best-track forecasts contain : the SMOS 10-min maximum-sustained winds (in knots) and wind radii (in nautical miles) for the 34 kt (17 m/s), 50 kt (25 m/s) and 64 kt (33 m/s) winds per geographical storm quadrants, and for each SMOS pass intercepting a TC in all the active ocean basins. See the complete description the "SMOS Wind Data Service Product Description Document" ( http://www.smosstorm.org/Document-tools/SMOS-Wind-Data-Service-Documentation ).
-
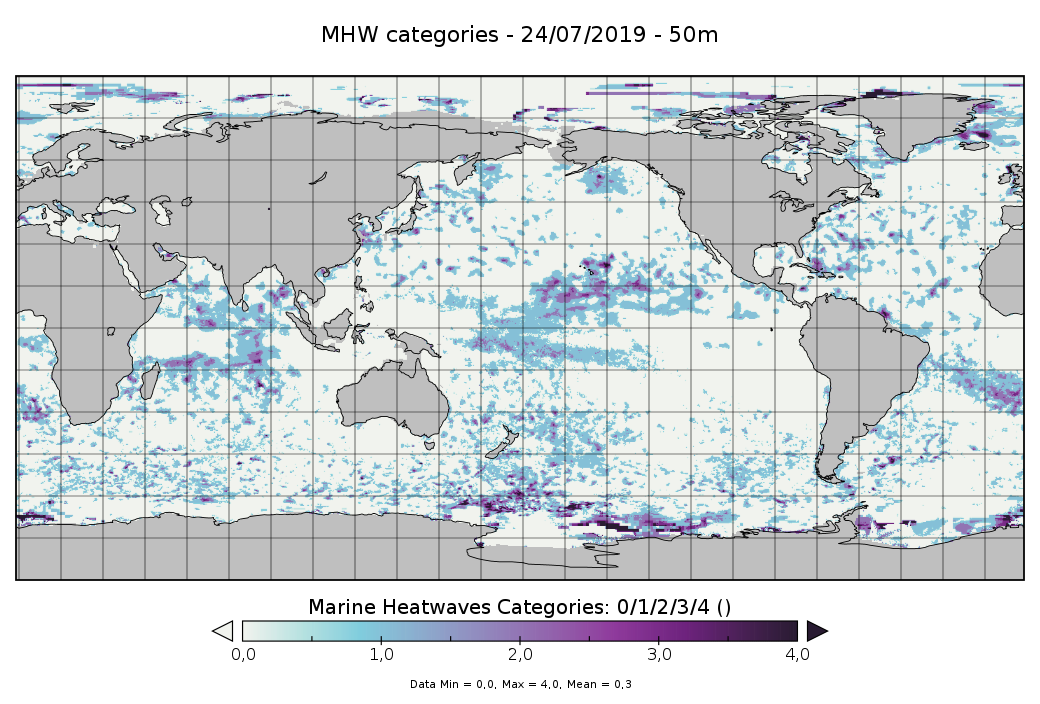
These datasets contain 4D (x, y, z, t) weekly temperature and marine heatwaves (MHW) categories estimated from the surface up to 300-m depth, at a 0.25°x0.25° horizontal grid resolution and for 4 areas of interest that are: • Area 1 (around the Madeira Islands): 30°N-35°N, 15°W-20°W • Area 2 (Tropical Pacific Ocean): 30°S-30°N, 120°E-130°W • Area 3 (Mediterranean Sea): 40°N-45°N, 15°W-20°W • Area 4 (Global): 82.875°S-89.875°N, 0.125°E-359.875°E The weekly MHW are centered on the date of the file (±3days). For the temperature reconstruction, 2 approaches have been used: - for the regional areas, the temperature has been computed with a 2 steps method: a first estimate of the vertical temperature profiles by using a machine learning approach (Multi-Layer Perceptron (MLP)) and then, a combination of this field with in situ temperature profiles observations through an optimal interpolation algorithm. The Copernicus Marine Service ARMOR3D dataset was used as the targeted temperature field for the MLP. The input data used are: • First step: ◦ SST data are from daily OSTIA analyses [from Copernicus Marine Service: SST_GLO_SST_L4_REP_OBSERVATIONS_010_011 product] interpolated over the 0.25°x0.25° targeted grid resolution; ◦ SLA data are from the Copernicus Marine Service product SEALEVEL_GLO_PHY_L4_REP_OBSERVATIONS_008_047/dataset-duacs-rep-global-merged-allsat-phy-l4 • Second step: ◦ The in situ data are from the Copernicus Marine Service In Situ TAC and contains several observations type: CTD, Argo floats, drifting buoys, moorings, marine mammals). - For the global area, the temperature comes from the Copernicus Marine Service product ARMOR3D (MULTIOBS_GLO_PHY_TSUV_3D_MYNRT_015_012 (https://doi.org/10.48670/moi-00052). The MHW categories are derived from the Hobday’s method [Hobday et al.,2018] for the 4 areas. Each MHW event is classified among four categories (moderate to extreme), identified in terms of multiples of the local difference between the 90th percentile and climatological values, and defined as moderate (1-2×, Category I), strong (2-3×, Category II), severe (3-4×, Category III), and extreme (>4×, Category IV). When the category is zero, this means that there is no MHW. The period 1993-2021 is used as a baseline for defining the climatology to be as close as possible to the 30-year period suggested by Hobday. This choice is motivated by the need of altimetry data to constrain the vertical temperature reconstruction, which is required for most ocean reanalyses as well, therefore the baseline period slightly differs from the one used for the 2D atlas.
-
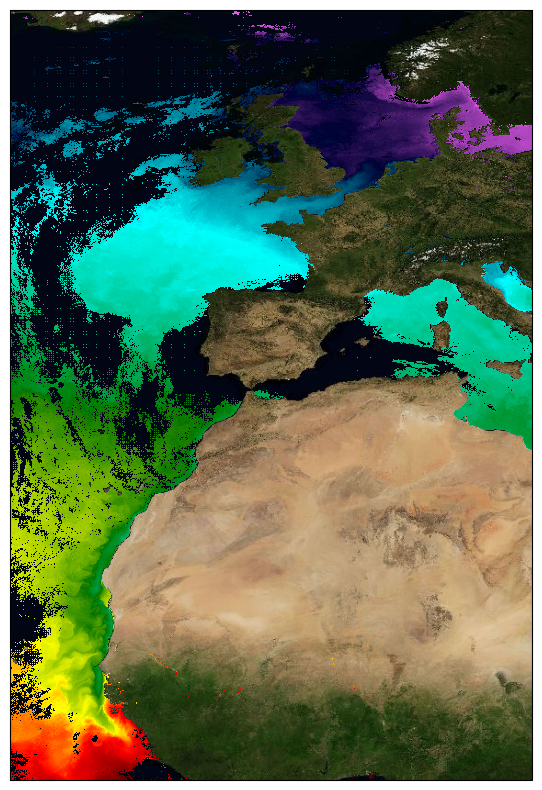
This dataset provide a times series of daily multi-sensor composite fields of Sea Surface Temperature (SST) foundation at ultra high resolution (UHR) on a 0.02 x 0.02 degree grid (approximately 2 x 2 km) for the North-East Atlantic (European North West shelf, Iberia, Bay of Biscay, Irish Sea down to Canary upwelling), every 24 hours. Whereas along swath observation data essentially represent the skin or sub-skin SST, the L3S SST product is defined to represent the SST foundation (SSTfnd). SSTfnd is defined within GHRSST as the temperature at the base of the diurnal thermocline. It is so named because it represents the foundation temperature on which the diurnal thermocline develops during the day. SSTfnd changes only gradually along with the upper layer of the ocean, and by definition it is independent of skin SST fluctuations due to wind- and radiation-dependent diurnal stratification or skin layer response. It is therefore updated at intervals of 24 hrs. SSTfnd corresponds to the temperature of the upper mixed layer which is the part of the ocean represented by the top-most layer of grid cells in most numerical ocean models. It is never observed directly by satellites, but it comes closest to being detected by infrared and microwave radiometers during the night, when the previous day's diurnal stratification can be assumed to have decayed. The processing combines the observations of multiple polar orbiting and geostationary satellites, embedding infrared of microwave radiometers. All these sources are intercalibrated with each other before merging. A ranking procedure is used to select the best sensor observation for each grid point. The processing is described on Copernicus Marine Service [SST_ATL_PHY_L3S_NRT_010_037 dataset] and users can refer to the user manual and quality documents available there for more details. This dataset is generated daily within a 24 delay and is therefore suitable for assimilation into operational models. It is produced in the frame of Copernicus Marine Service and the data available through various tools and protocols with a simple user registration from this service (product identifier: SST_ATL_PHY_L3S_NRT_010_037) at: https://data.marine.copernicus.eu/product/SST_ATL_PHY_L3S_NRT_010_037/
-

This dataset provide a times series of daily multi-sensor composite fields of Sea Surface Temperature (SST) foundation at high resolution (HR) on a 0.10 x 0.10 degree grid (approximately 10 x 10 km) for the Global Ocean, every 24 hours. Whereas along swath observation data essentially represent the skin or sub-skin SST, the L3S SST product is defined to represent the SST foundation (SSTfnd). SSTfnd is defined within GHRSST as the temperature at the base of the diurnal thermocline. It is so named because it represents the foundation temperature on which the diurnal thermocline develops during the day. SSTfnd changes only gradually along with the upper layer of the ocean, and by definition it is independent of skin SST fluctuations due to wind- and radiation-dependent diurnal stratification or skin layer response. It is therefore updated at intervals of 24 hrs. SSTfnd corresponds to the temperature of the upper mixed layer which is the part of the ocean represented by the top-most layer of grid cells in most numerical ocean models. It is never observed directly by satellites, but it comes closest to being detected by infrared and microwave radiometers during the night, when the previous day's diurnal stratification can be assumed to have decayed. The processing combines the observations of multiple polar orbiting and geostationary satellites, embedding infrared of microwave radiometers. All these sources are intercalibrated with each other before merging. A ranking procedure is used to select the best sensor observation for each grid point. This dataset is generated daily within a 24 delay and is therefore suitable for assimilation into operational models. It is produced in the frame of Copernicus Marine Service and the data available through various tools and protocols with a simple user registration from this service (product identifier: SST_GLO_SST_L3S_NRT_OBSERVATIONS_010_010) at: https://data.marine.copernicus.eu/product/SST_GLO_SST_L3S_NRT_OBSERVATIONS_010_010
-
The main objective of the SWIM Level 3 (L3) product is to provide global gridded wave statistics from the along-track directional wave spectra measures, as observed with SWIM instrument onboard CFOSAT. CFOSAT (Chinese French Ocean SATellite) is a french-chinese mission launched in 2018, whose aim is to provide wind (SCAT instrument) and wave (SWIM instrument) measurements over the sea surface. The processing uses the integrated parameters (wave length, significant wave height, direction) of the wave systems associated with the individual partitions retrieved from SWIM wave spectra, computing monthly statistics such as distribution, min, max, mean and median over a global 2 degree resolution grid. Three sub-products are generated separately for each SWIM beam (from 4° to 10°) from respectively the SWIM Level 2 spectra produced by the CWWIC center (CNES), the SWIM Level 2S spectra produced by the IWWOC center (Ifremer) and forecast spectra produced from WaveWatch3 wave model at Ifremer as an independent source for comparison. The SWIM level 3 dataset is generated in delayed mode. It is currently mainly meant as a validation dataset aiming at inter-comparing the different SWIM Level 2 between each other, with an independent model (here WaveWatch3) or other external similar wave statistics products. The SWIM L3 dataset is generated and distributed by Ifremer / CERSAT in the frame of the Ifremer Wind and Wave Operation Center (IWWOC) co-funded by Ifremer and CNES and dedicated to the processing of the delayed mode data of CFOSAT mission.