 Catalogue PIGMA
2022
Type of resources
Available actions
Topics
Keywords
Contact for the resource
Provided by
Years
Formats
Representation types
Update frequencies
status
Service types
Scale
Resolution
-
Serveur wms du projet CHARM III
-
The SARWAVE project is developing a new sea state processor from SAR images to be applied over open ocean, sea ice, and coastal areas, and exploring potential synergy with other microwave and optical EO products.
-
Serveur wms sur les photos anciennes
-
This dataset contains the pictures used for morphometric measurements, as well as the elemental compositon and production rates data, of planktonic Rhizaria. Specimens were collected in the bay of Villefranche-sur-Mer in May 2019 and during the P2107 cruise in the California Current in July-August 2021. Analyses of the data can be found at https://github.com/MnnLgt/Elemental_composition_Rhizaria.
-

The CDR-derived Wet Tropospheric Correction (WTC) Product V2 is generated from the Level-2+ along-track altimetry products version 2024 (L2P 2024) distributed by AVISO+ (www.aviso.altimetry.fr). It provides a long-term, homogenized estimation of the wet tropospheric correction based on Climate Data Records (CDRs) of atmospheric water vapour combined with high frequencies MWR data. Two independent CDRs datasets are used: - REMSS V7R2 (coverage until 2022) https://www.remss.com/measurements/atmospheric-water-vapor/tpw-1-deg-product/ - HOAPS V5 precursor CDR from EUMETSAT CM SAF (coverage until 2020) HOAPS V4/V5 data available via https://wui.cmsaf.eu Note: the HOAPS V5 precursor is not yet an official CM SAF product; full validation and public release are pending. The MWR/CDR WTC V2 estimates is derived using spatially varying but temporally constant polynomial coefficients (ai). 1. WTC V2 – Along-track L2P Product Data format: The WTC V2 product is delivered in Level-2+ (L2P) format, along the satellite ground track. Each mission is distributed as a compressed archive (.tar.gz) containing one NetCDF4 CF-1.8 file per mission cycle. Archive naming convention: <mission>_WTC_from_WV_CDR_<version>.tar.gz mission: TP (TOPEX/Poseidon), J1, J2, J3 version: product version (currently V2) File naming convention inside archives: <mission>_C<cycle>.nc cycle: 4-digit cycle index (e.g., C0001) Each NetCDF file contains: 1/ Along-track WTC estimate; 2/ Ancillary information; 3/ Space–time coordinates 2. WTC CDR Uncertainties – Gridded Product: A complementary product is provided, delivering regional trend estimates and associated uncertainties from the WTC Climate Data Record. The uncertainty product is distributed as a single NetCDF4 file: wtc_trend_uncertainties.nc . This file contains global gridded fields of WTC CDR trend and uncertainty parameters. Product content: This is the first dedicated version providing both: WTC CDR (HOAPS) linear trends, and Uncertainty estimates on these trends. Uncertainties are expressed as 1-sigma confidence intervals, and propagated using the methodology described in Section 2.3 of the Product User Manual. The product includes: - Total uncertainty on the WTC trend, propagated from all identified uncertainty sources in the WTC–TCWV regression. - Individual contributions of uncertainty sources (Uncertainties on regression coefficients: a0, a1 and their standard deviations; Uncertainties inherited from the HOAPS TCWV CDR) These fields enable users to assess the relative importance of each uncertainty component and recompute uncertainty propagation with alternative methods. Included regression input variables: To ensure transparency and reproducibility, the product provides: 1/ regression coefficients a0, a1; 2/ their associated uncertainties (std of a0, std of a1); 3/additional diagnostic fields required to recompute uncertainties if needed.
-
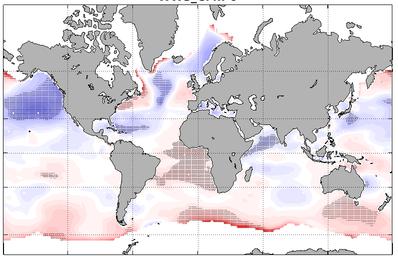
Global wave hindcast (1961-2020) at 1° resolution using CMIP6 wind and sea-ice forcings for ALL (historical), GHG (historical greenhouse-gas-only), AER (historical Anthropogenic-aerosol-only), NAT (historical natural only) scenario.
-
This data set is related to the article "Improving the robustness of dissipation rate estimates from microstructure shear data processing in ocean turbulence" (submitted to JTech, AMS). It provides the raw data files (with extension .p) from a vertical microstructure profiler VMP-6000 used for the published study. Raw data files are provided since the study precisely report on the data processing of raw microstructure horizontal velocity shear data to get dissipation rates of turbulent kinetic energy using the manufacturer software. The software (ODAS) can be downloaded from the manufacturer website at: https://rocklandscientific.com. The profiles were collected in the Mediterranean Sea in 2013 (French VAD cruise) and 2014 (Italian MEDOCC cruise), and in the North Atlantic Ocean in 2021 (MoMAR cruise). More details on the profiles are given in the related publication.
-
A prerequisite for a successful development of a multi-mission wind dataset is to ensure good inter-calibration of the different extreme wind datasets to be integrated in the product. Since the operational hurricane community is working with the in-situ dropsondes as wind speed reference, which are in turn used to calibrate the NOAA Hurricane Hunter Stepped Frequency Microwave Radiometer (SFMR) wind data, MAXSS has used the latter to ensure extreme-wind inter-calibration among the following scatterometer and radiometer systems: the Advanced Scatterometers onboard the Metop series (i.e., ASCAT-A, -B, and -C), the scatterometers onboard Oceansat-2 (OSCAT) and ScatSat-1 (OSCAT-2), and onboard the HY-2 series (HSCAT-A, -B); the Advanced Microwave Scanning Radiometer 2 onboard GCOM-W1(AMSR-2), the multi-frequency polarimetric radiometer (Windsat), and the L-band radiometers onboard the Soil Moisture and Ocean Salinity (SMOS) and the Soil Moisture Active Passive (SMAP) missions. In summary, a two-step strategy has been followed to adjust the high and extreme wind speeds derived from the mentioned scatterometer and radiometer systems, available in the period 2009-2020. First, the C-band ASCATs have been adjusted against collocated storm-motion centric SFMR wind data. Then, both SFMR winds and ASCAT adjusted winds have been used to adjust all the other satellite wind systems. In doing so, a good inter-calibration between all the systems is ensured not only under tropical cyclone (TC) conditions, but also elsewhere. This dataset was produced in the frame of the ESA funded Marine Atmosphere eXtreme Satellite Synergy (MAXSS) project. The primary objective of the ESA Marine Atmosphere eXtreme Satellite Synergy (MAXSS) project is to provide guidance and innovative methodologies to maximize the synergetic use of available Earth Observation data (satellite, in situ) to improve understanding about the multi-scale dynamical characteristics of extreme air-sea interaction.
-
French benthic invertebrates composition and abundance taxa data are collected during monitoring surveys on the English Channel / Bay of Biscay coasts and Mediterranean coast (Quadrige program code : REBENT_FAU, RSL_FAU). Protocols are implemented in the Water Framework Directive. Data are transmitted in a Seadatanet format (CDI + ODV) to EMODnet Biology european database. 498 ODV files have been generated from period 01/01/2003 to 31/12/2021.
-
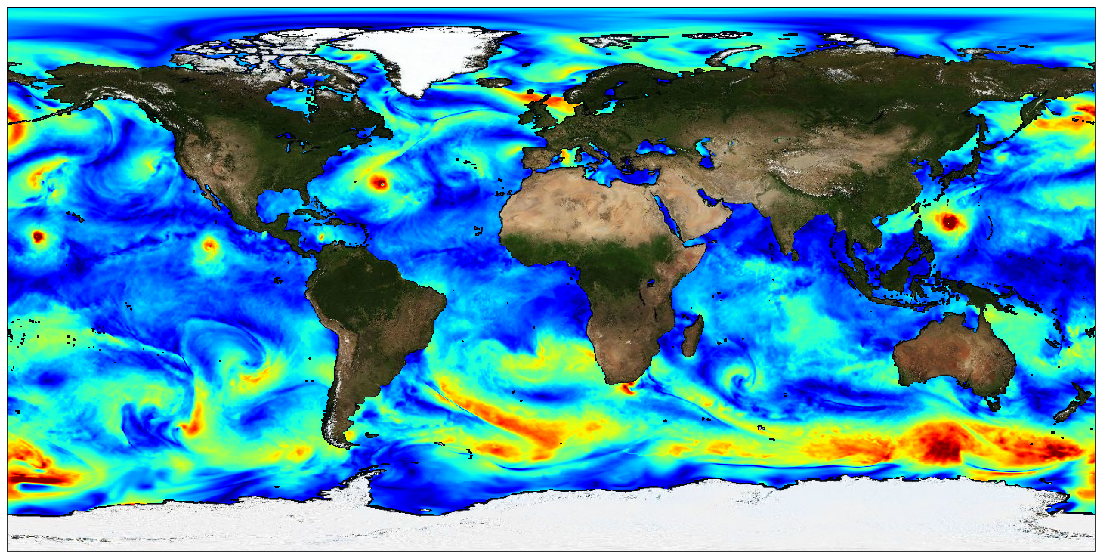
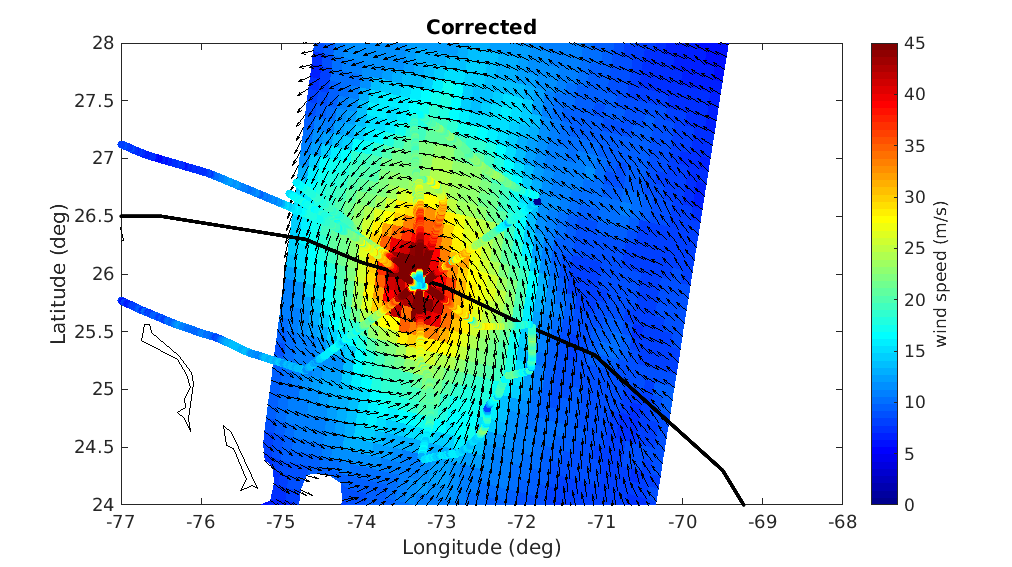
The Level 4 merged microwave wind product is a complete set of hourly global 10-m wind maps on a 0.25x0.25 degree latitude-longitude grid, spanning 1 Jan 2010 through the end of 2020. The product combines background neutral equivalent wind fields from ERA5, daily surface current fields from CMEMS, and stress equivalent winds obtained from several microwave passive and active sensors to produce hourly surface current relative stress equivalent wind analyses. The satellite winds include those from recently launched L-band passive sensors capable of measuring extreme winds in tropical cyclones, with little or no degradation from precipitation. All satellite winds used in the analyses have been recalibrated using a large set of collocated satellite-SFMR wind data in storm-centric coordinates. To maximize the use of the satellite microwave data, winds within a 24-hour window centered on the analysis time have been incorporated into each analysis. To accomodate the large time window, satellite wind speeds are transformed into deviations from ERA5 background wind speeds interpolated to the measurement times, and then an optical flow-based morphing technique is applied to these wind speed increments to propagate them from measurement to analysis time. These morphed wind speed increments are then added to the background wind speed at the analysis time to yield a set of total wind speeds fields for each sensor at the analysis time. These individual sensor wind speed fields are then combined with the background 10-m wind direction to yield vorticity and divergence fields for the individual sensor winds. From these, merged vorticity and divergence fields are computed as a weighted average of the individual vorticity and divergence fields. The final vector wind field is then obtained directly from these merged vorticity and divergence fields. Note that one consequence of producing the analyses in terms of vorticity and divergence is that there are no discontinuities in the wind speed fields at the (morphed) swath edges. There are two important points to be noted: the background ERA5 wind speed fields have been rescaled to be globally consistent with the recalibrated AMSR2 wind speeds. This rescaling involves a large increase in the ERA5 background winds beyond about 17 m/s. For example, an ERA5 10 m wind speed of 30 m/s is transformed into a wind speed of 41 m/s, and a wind speed of 34 m/s is transformed into a wind speed of about 48 m/s. Besides the current version of the product is calibrated for use within tropical cyclones and is not appropriate for use elsewhere. This dataset was produced in the frame of ESA MAXSS project. The primary objective of the ESA Marine Atmosphere eXtreme Satellite Synergy (MAXSS) project is to provide guidance and innovative methodologies to maximize the synergetic use of available Earth Observation data (satellite, in situ) to improve understanding about the multi-scale dynamical characteristics of extreme air-sea interaction.