 Catalogue PIGMA
2024
Type of resources
Available actions
Topics
Keywords
Contact for the resource
Provided by
Years
Formats
Representation types
Update frequencies
status
Scale
Resolution
-
The coastal heights data combines two datasets: the land-sea mask of the gridded EMODnet bathymetry and the height of high-water (HAT) relative to chart datum (LAT) as computed with the GTSM tide model. Near the coast a diffusion scheme is applied to make the heights consistent with the land-sea mask. Finally, only grid cells that are classified as sea, but neighbor a land cell are selected. The main assumption in this approach is that the height of the topography near the coastline is close to the high-water mark. The main purpose of this dataset is to improve extrapolation towards the coast. In many areas around Europe there is a (small) gap between the point closest to the coast for which a survey is available and the coastline. In this way interpolation from coarser background data is avoided.
-
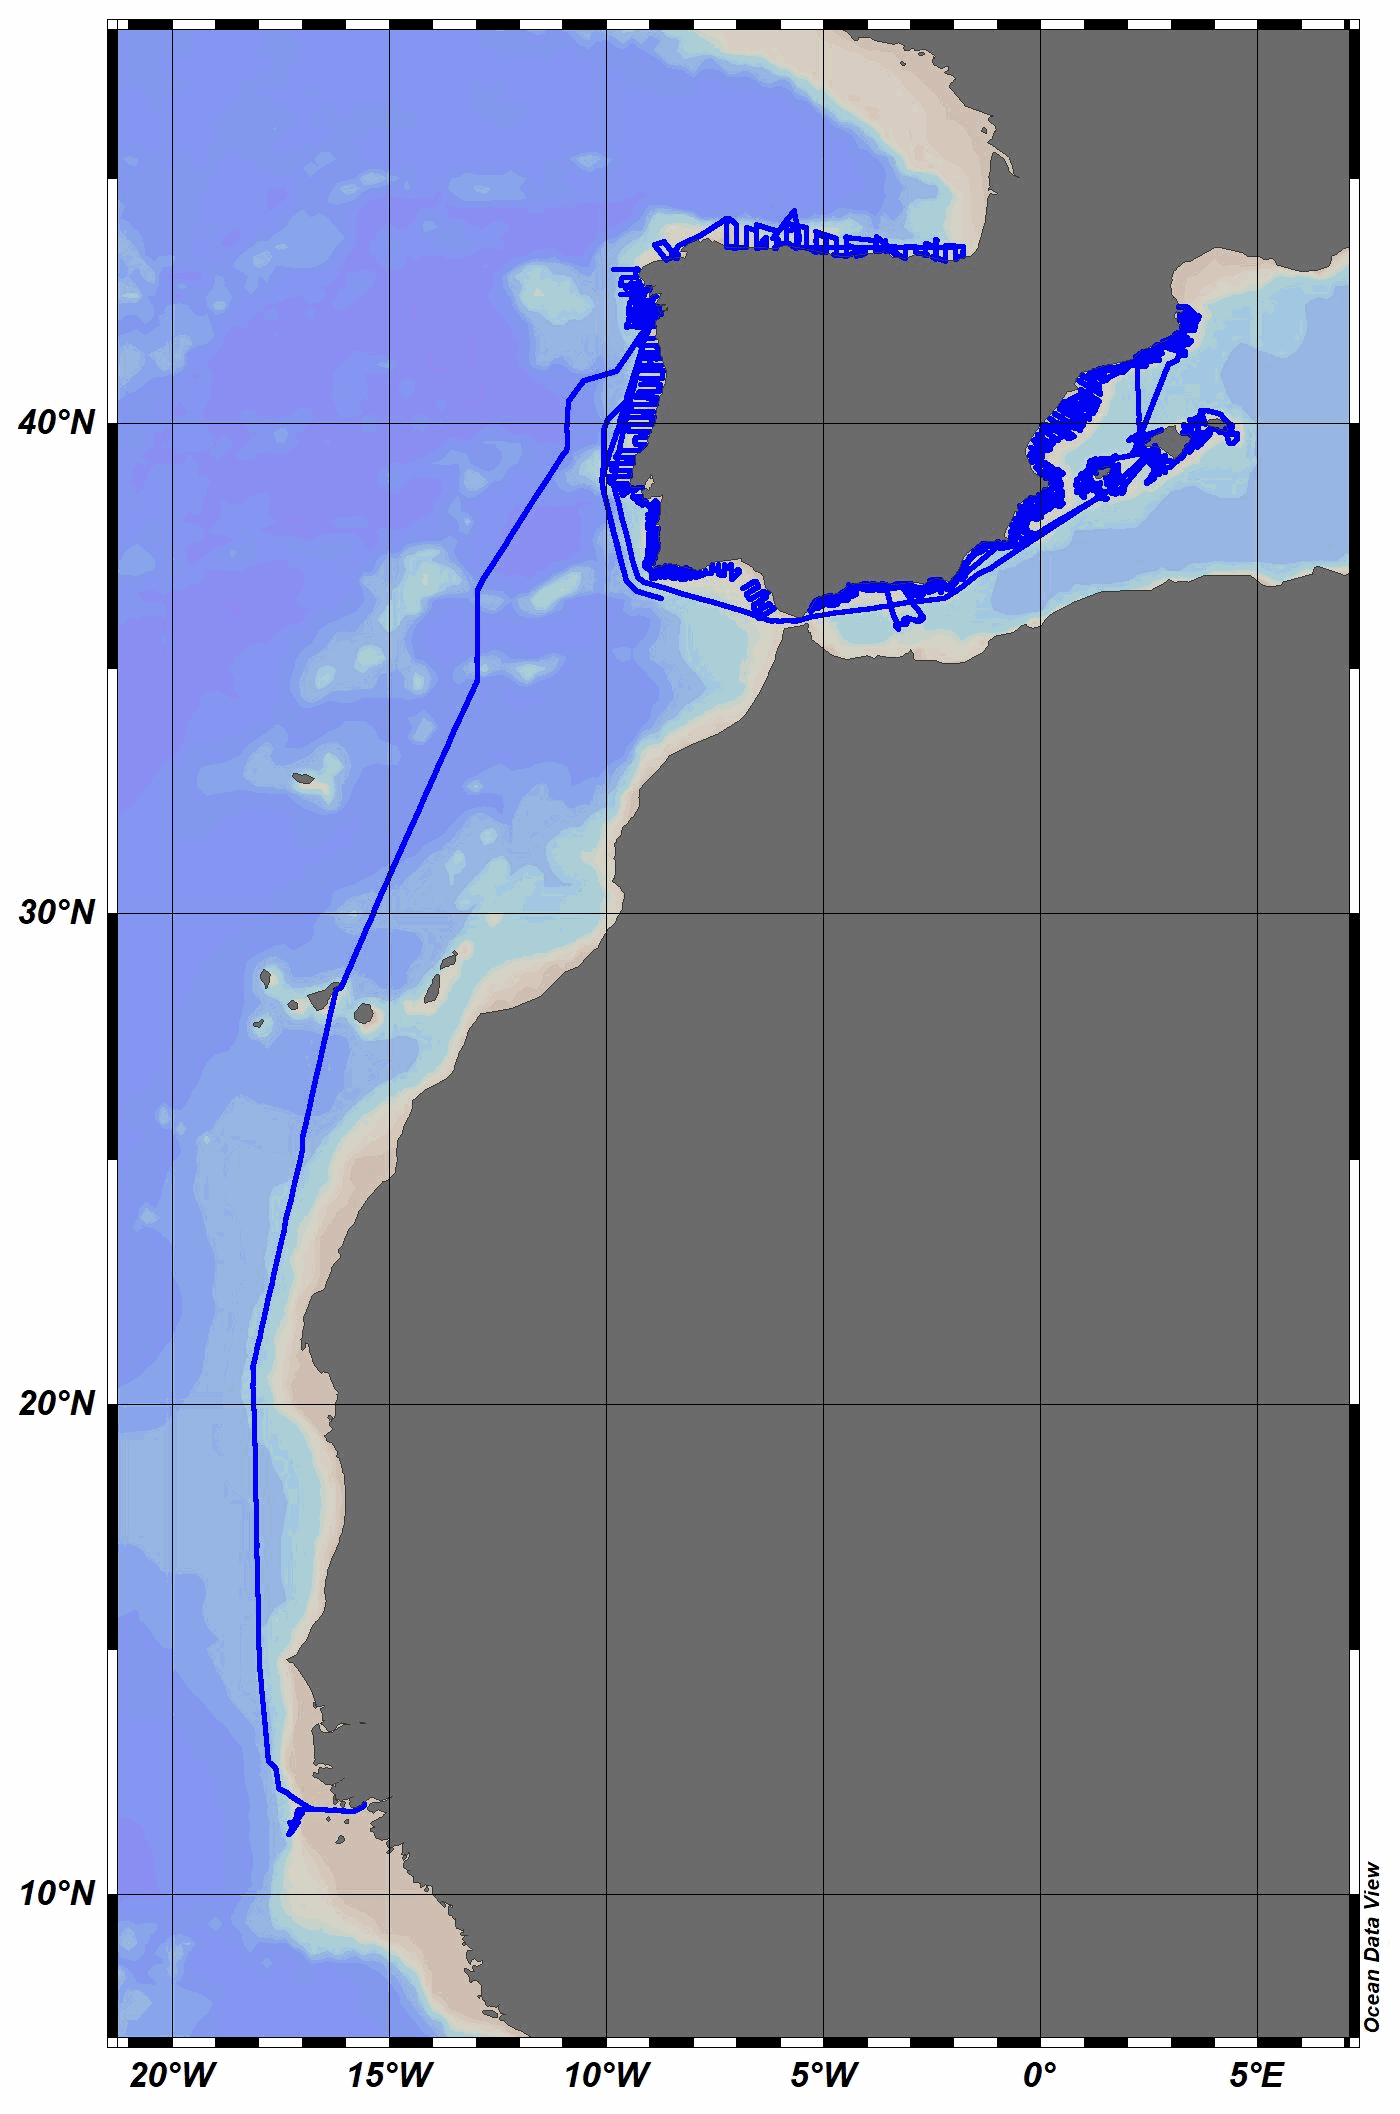
The R/V Miguel Oliver was built in 2007 for scientific fisheries assessment and oceanographic research purposes. Owned by the Spanish General Secretariat of Fisheries, it mainly operates around the Iberian Peninsula and Canary Islands waters. Equipped with an automatic weather station, collected data are daily sent to the Spanish Institute of Oceanography (IEO) Data Center / National Oceanographic Data Center (NODC) for delayed-mode quality control and long-term archive and dissemination. Recently, a semi-automatic process has been used to perform quality control and data assessment. The quality controlled data have been stored in MEDAR/MEDATLAS format, and the corresponding quality flag has been added to each individual measurement. This facilitates their reuse for different purposes, from climatology or academic studies to industrial sector needs, among others. In 2023, air temperature, relative humidity, wind speed and direction and solar radiation were collected.
-
Water_body_ammonium - Monthly Climatology for the European Seas for the period 1960-2023 on the domain from longitude -45.0 to 70.0 degrees East and latitude 24.0 to 83.0 degrees North. Data Sources: observational data from SeaDataNet/EMODnet Chemistry Data Network. Description of DIVA analysis: The computation was done with the DIVAnd (Data-Interpolating Variational Analysis in n dimensions), version 2.7.12, using GEBCO 30sec topography for the spatial connectivity of water masses. Horizontal correlation length and vertical correlation length vary spatially depending on the topography and domain. Depth range: 0.0, 5.0, 10.0, 15.0, 20.0, 25.0, 30.0, 35.0, 40.0, 45.0, 50.0, 55.0, 60.0, 65.0, 70.0, 75.0, 80.0, 85.0, 90.0, 95.0, 100.0, 125.0, 150.0, 175.0, 200.0, 225.0, 250.0, 275.0, 300.0, 325.0, 350.0, 375.0, 400.0, 425.0, 450.0, 475.0, 500.0, 550.0, 600.0, 650.0, 700.0, 750.0, 800.0, 850.0, 900.0, 950.0, 1000.0, 1050.0, 1100.0, 1150.0, 1200.0, 1250.0, 1300.0, 1350.0, 1400.0, 1450.0, 1500.0, 1550.0, 1600.0, 1650.0, 1700.0, 1750.0, 1800.0, 1850.0, 1900.0, 1950.0, 2000.0, 2100.0, 2200.0, 2300.0, 2400.0, 2500.0, 2600.0, 2700.0, 2800.0, 2900.0, 3000.0, 3100.0, 3200.0, 3300.0, 3400.0, 3500.0, 3600.0, 3700.0, 3800.0, 3900.0, 4000.0, 4100.0, 4200.0, 4300.0, 4400.0, 4500.0, 4600.0, 4700.0, 4800.0, 4900.0, 5000.0, 5100.0, 5200.0, 5300.0, 5400.0, 5500.0 m. Units: umol/l. The horizontal resolution of the produced DIVAnd analysis is 0.25 degrees.
-
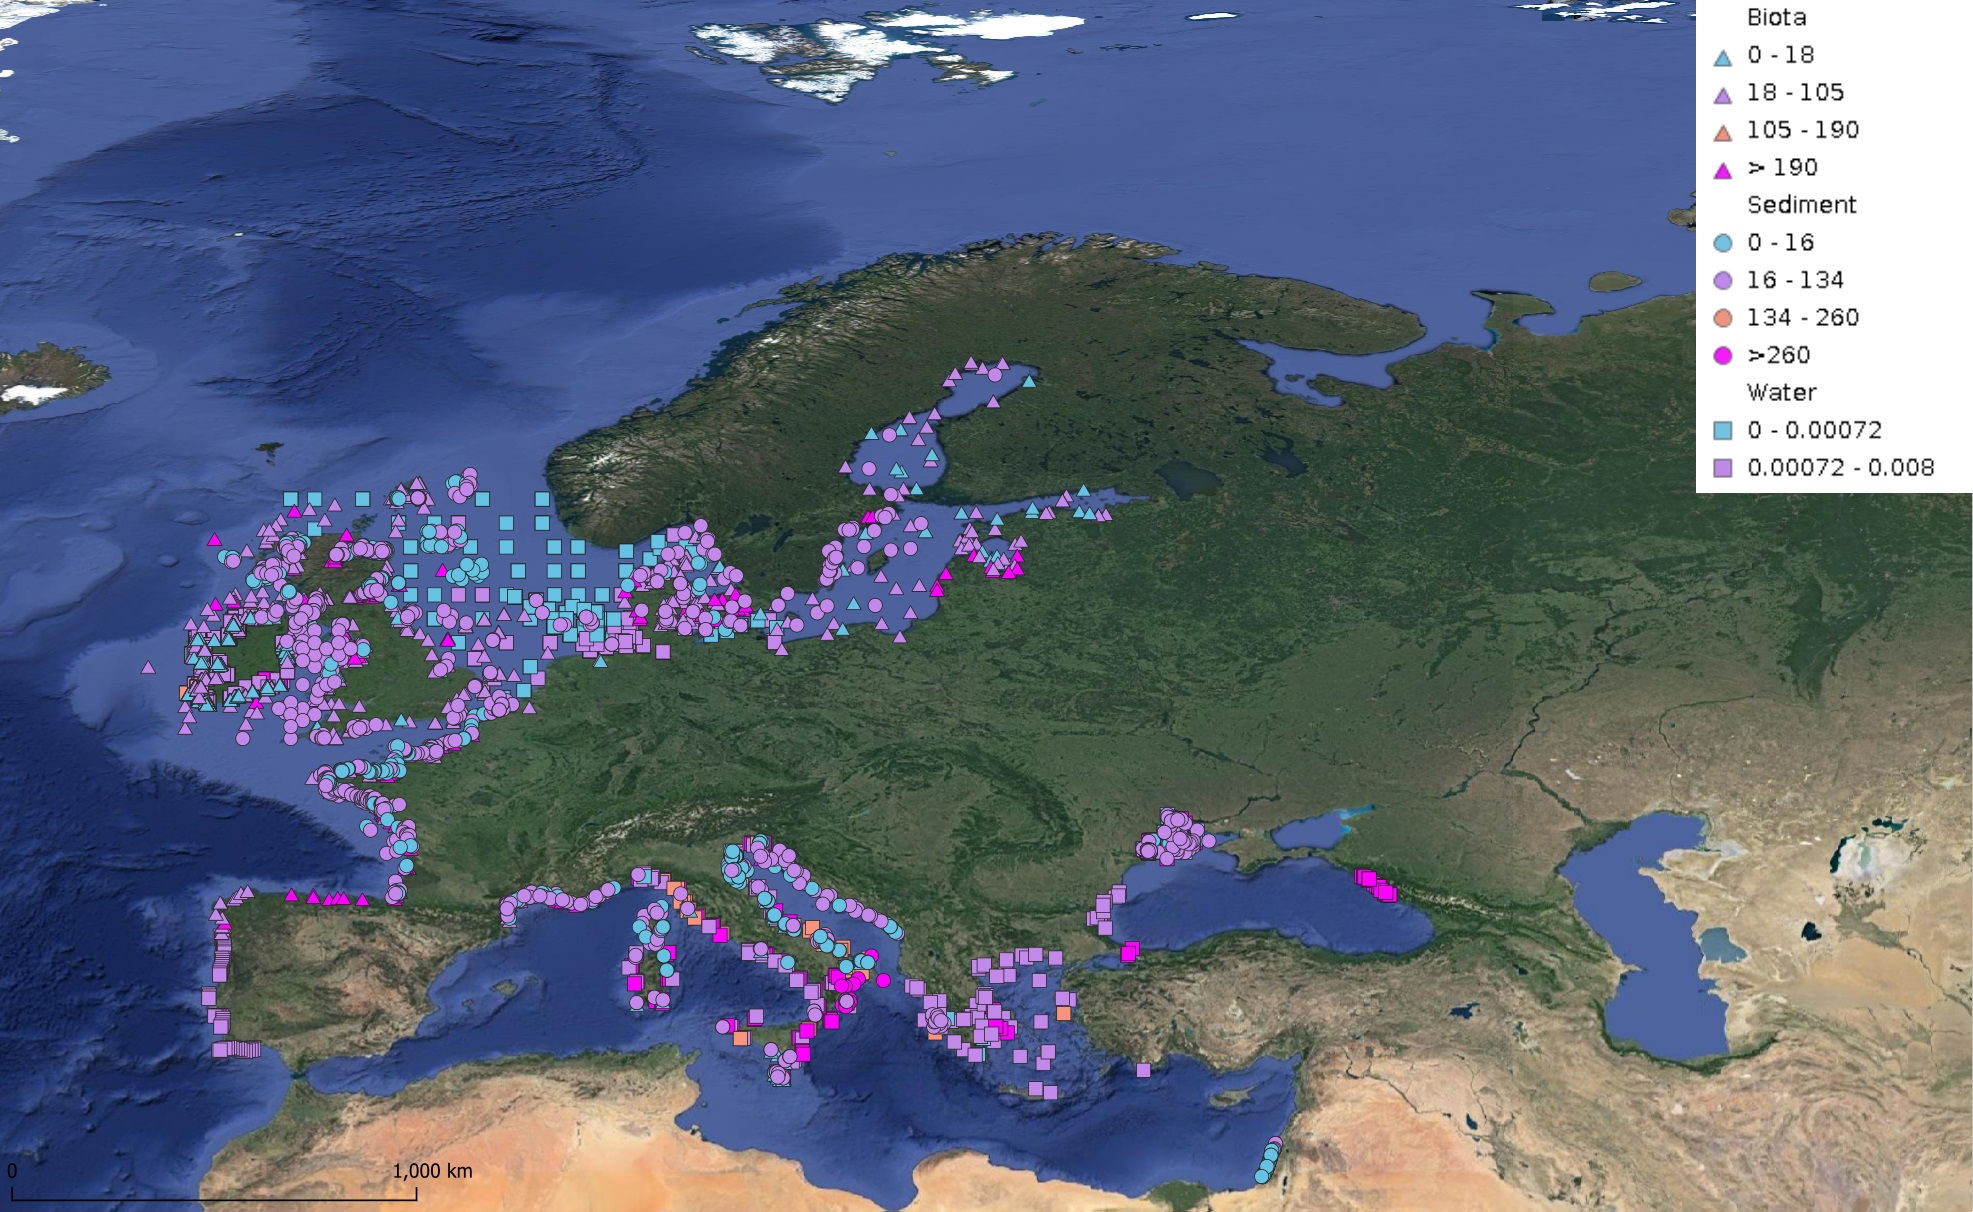
This product displays for Naphthalene, median values since 2012 that have been measured per matrix and are present in EMODnet regional contaminants aggregated datasets, v2024. The median values ranges are derived from the following percentiles: 0-25%, 25-75%, 75-90%, >90%. Only "good data" are used, namely data with Quality Flag=1, 2, 6, Q (SeaDataNet Quality Flag schema). For water, only surface values are used (0-15 m), for sediment and biota data at all depths are used.
-
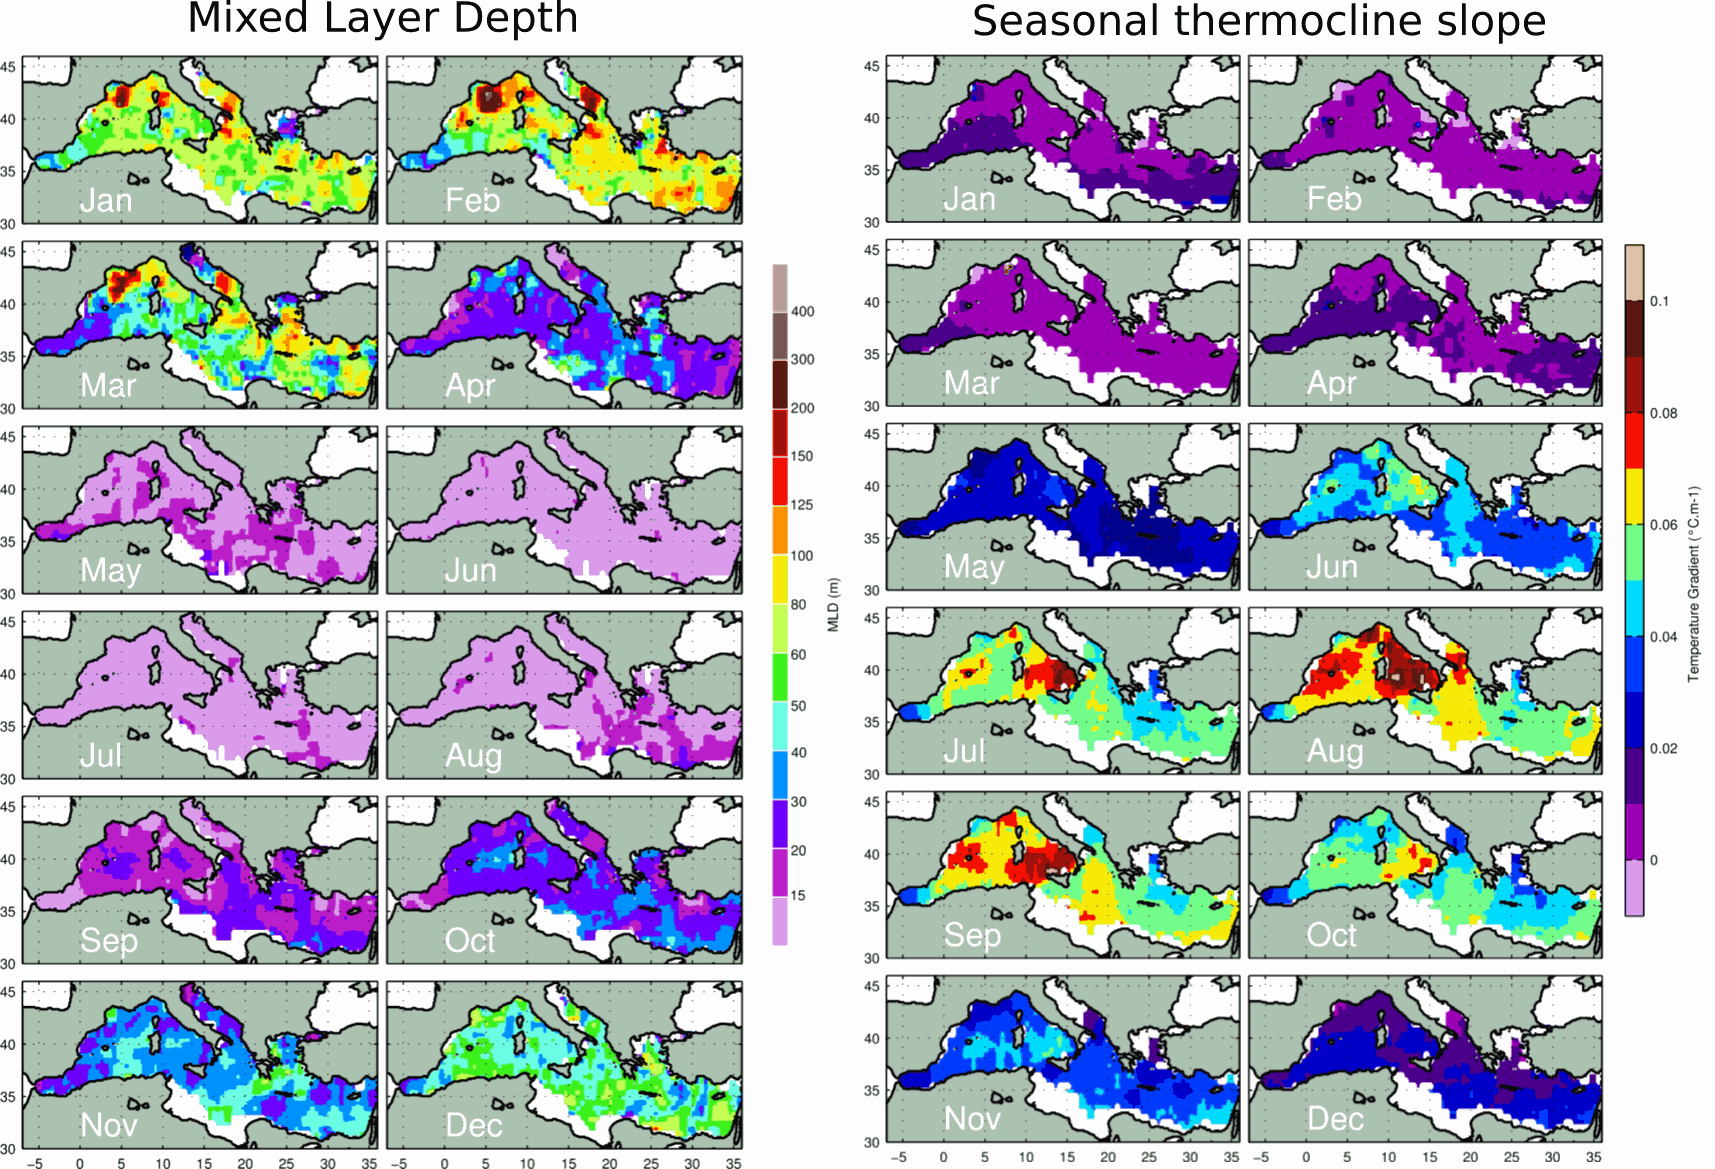
These monthly gridded climatology were produced using MBT, XBT, Profiling floats, Gliders, and ship-based CTD data from different database and carried out in the Med. between 1969 and 2013. The Mixed Layer Depth (MLD) is calculated with a delta T= 0.1 C criterion relative to 10m reference level on individual profiles. The Depth of the Bottom of the Seasonal Thermocline (DBST) is calculated on individual profiles as the maximum value from a vector composed of two elements: 1) the depth of the temperature minimum in the upper 200m; 2) the MLD. This double criterion for the calculation of DBST is necessary in areas where the mixed layer exceed 200m depth. DBST is the integration depth used in the calculation of the upper-ocean Heat Storage Rate. For more details about the data and the methods used, see: Houpert et al. 2015, Seasonal cycle of the mixed layer, the seasonal thermocline and the upper-ocean heat storage rate in the Mediterranean Sea derived from observations, Progress in Oceanography, http://doi.org/10.1016/j.pocean.2014.11.004
-

This dataset contains the high-frequency total horizontal current at 15m depth on a global grid at 1/4° resolution. It is composed by the addition of two components, the first is the Geostrophic current derived by Altimetry, from the DT-2018 CMEMS database, and the second is the unsteady-Ekman ageostrophic component forced by the wind. All the details about the algorithm and the physical content of this ageostrophy component are given in the ATBD. The data are available through HTTP and FTP; access to the data is free and open. This dataset was generated by Datlas Ocean and is distributed by Ifremer / CERSAT in the frame of the World Ocean Circulation (WOC) project funded by the European Space Agency (ESA).
-
EMODnet Chemistry aims to provide access to marine chemistry data sets and derived data products concerning eutrophication, ocean acidification and contaminants. The chemicals chosen EMODnet Chemistry aims to provide access to marine chemistry datasets and derived data products concerning eutrophication, acidity and contaminants. The importance of the selected substances and other parameters relates to the Marine Strategy Framework Directive (MSFD). This aggregated dataset contains all unrestricted EMODnet Chemistry data on potential hazardous substances, despite the fact that some data might not be related to pollution (e.g. collected by deep corer). Temperature, salinity and additional parameters are included when available. It covers the Mediterranean Sea. Data were harmonised and validated by the ‘Hellenic Centre for Marine Research, Hellenic National Oceanographic Data Centre (HCMR/HNODC)’ in Greece. The dataset contains water, sediment and biota profiles and timeseries. The temporal coverage is 1974–2020 for water measurements, 1971–2020 for sediment measurements and 1979-2022 for biota measurements. Regional datasets concerning contaminants are automatically harvested and the resulting collections are harmonised and validated using ODV Software and following a common methodology for all sea regions ( https://doi.org/10.6092/8b52e8d7-dc92-4305-9337-7634a5cae3f4 ). Parameter names are based on P01 vocabulary, which relates to BODC Parameter Usage Vocabulary and is available at: https://vocab.nerc.ac.uk/search_nvs/P01/ . The harmonised dataset can be downloaded as as an ODV spreadsheet, which is composed of a metadata header followed by tab separated values. This spreadsheet can be imported into ODV Software for visualisation (more information can be found at: https://www.seadatanet.org/Software/ODV ). In addition, the same dataset is offered also as a txt file in a long/vertical format, in which each P01 measurement is a record line. Additionally, there are a series of columns that split P01 terms into subcomponents (substance, CAS number, matrix...).This transposed format is more adapted to worksheet applications (e.g. LibreOffice Calc).
-
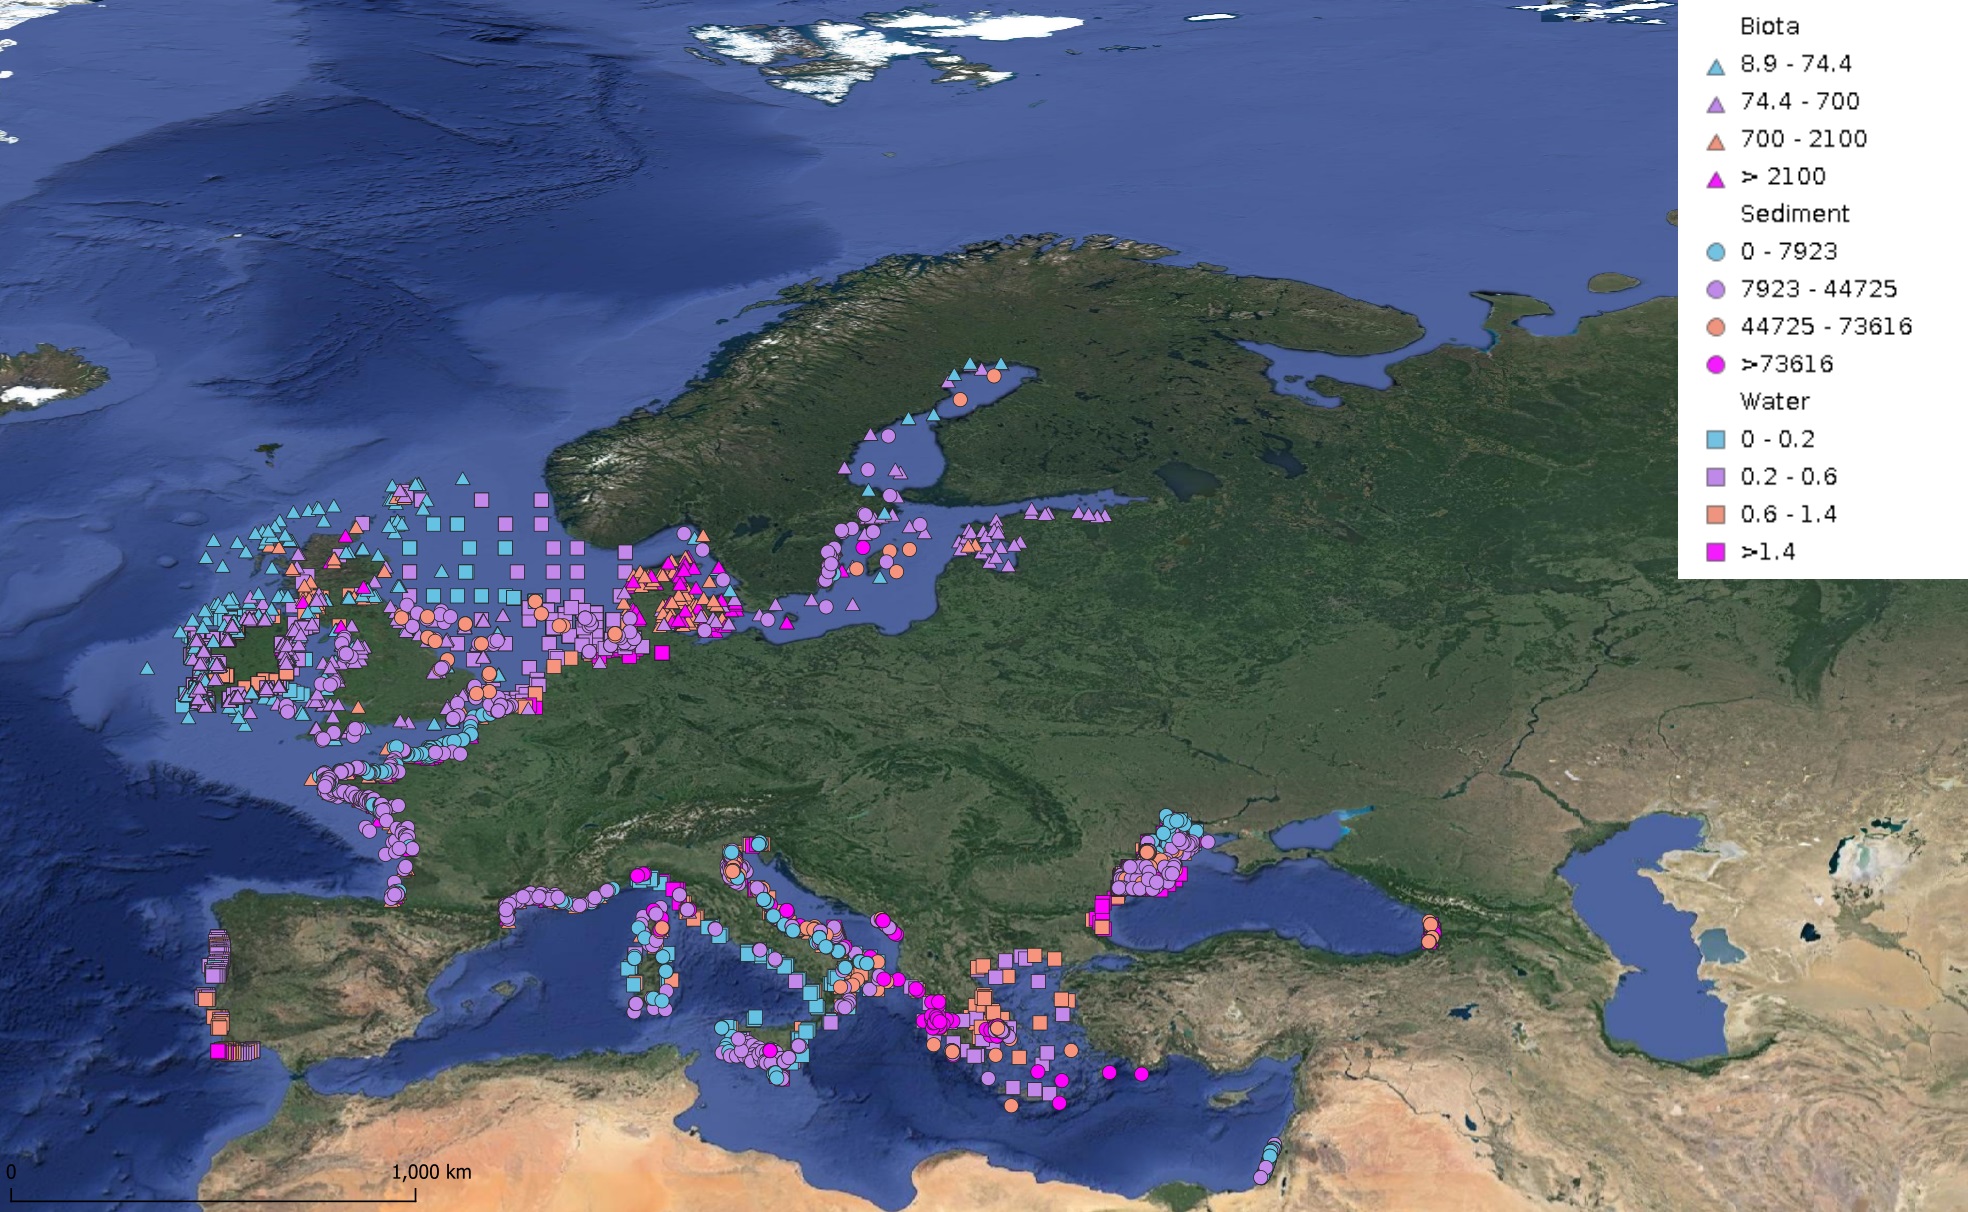
This product displays for Nickel, median values since 2012 that have been measured per matrix and are present in EMODnet regional contaminants aggregated datasets, v2024. The median values ranges are derived from the following percentiles: 0-25%, 25-75%, 75-90%, >90%. Only "good data" are used, namely data with Quality Flag=1, 2, 6, Q (SeaDataNet Quality Flag schema). For water, only surface values are used (0-15 m), for sediment and biota data at all depths are used.
-
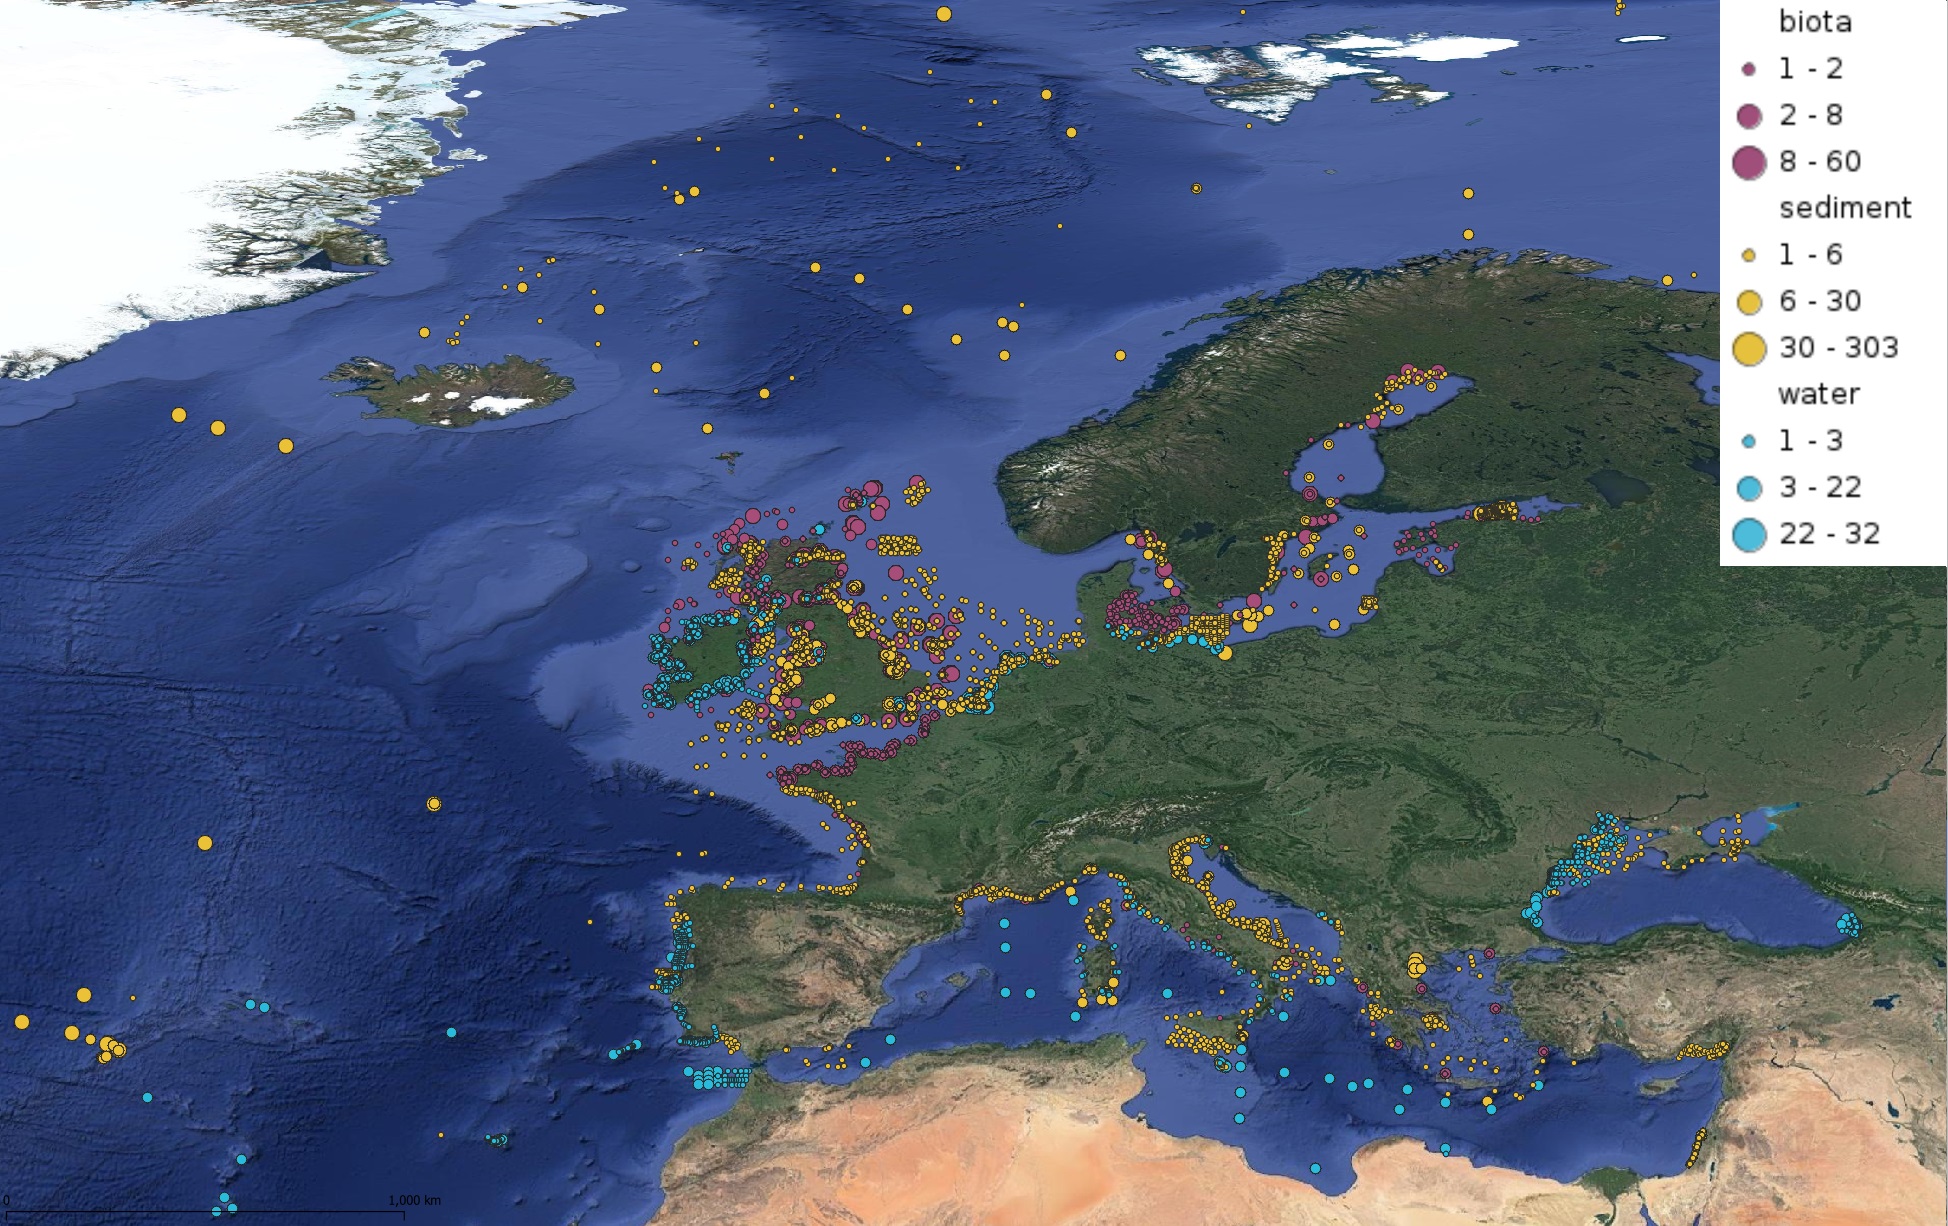
This product displays for Nickel, positions with values counts that have been measured per matrix and are present in EMODnet regional contaminants aggregated datasets, v2022. The product displays positions for all available years.
-
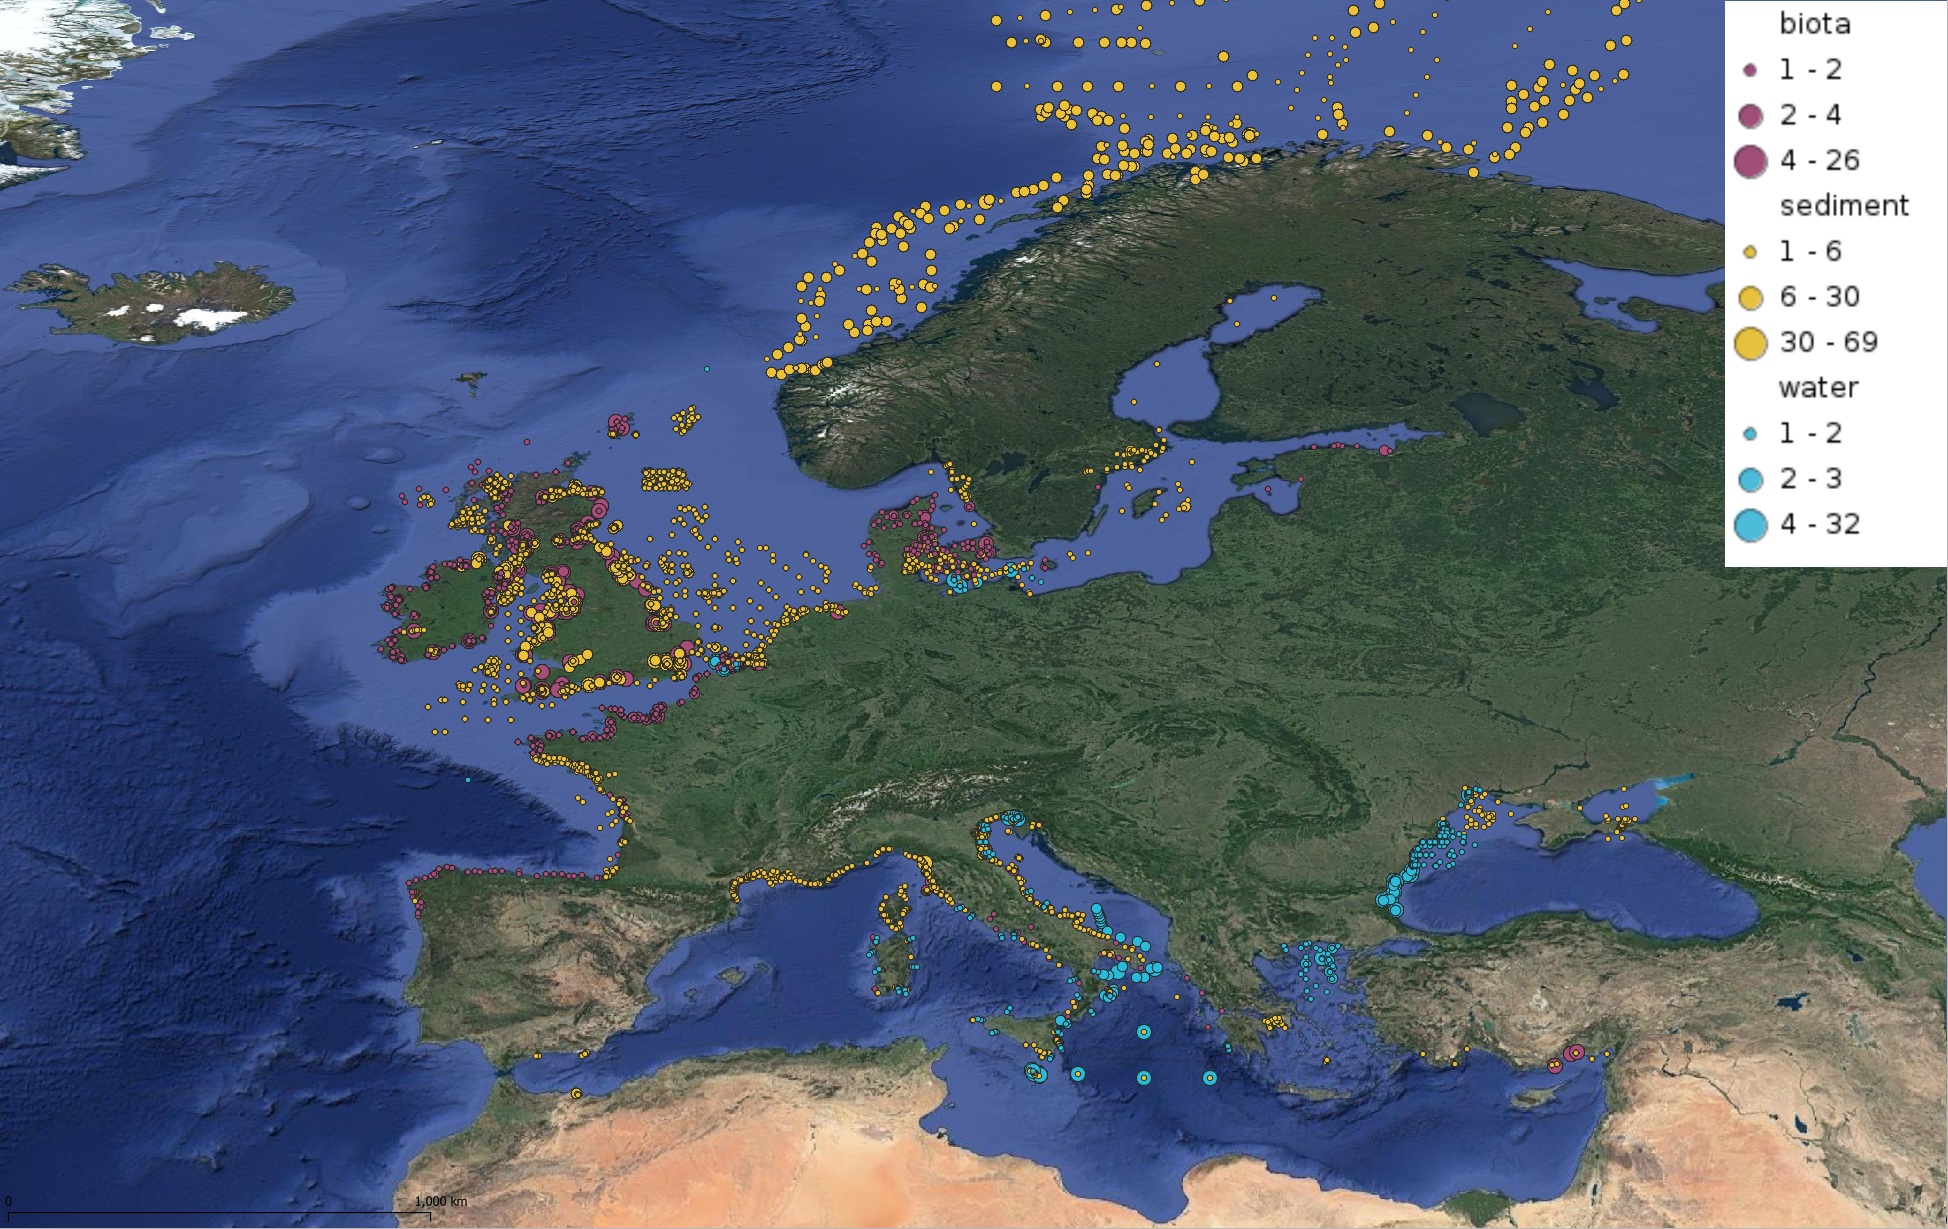
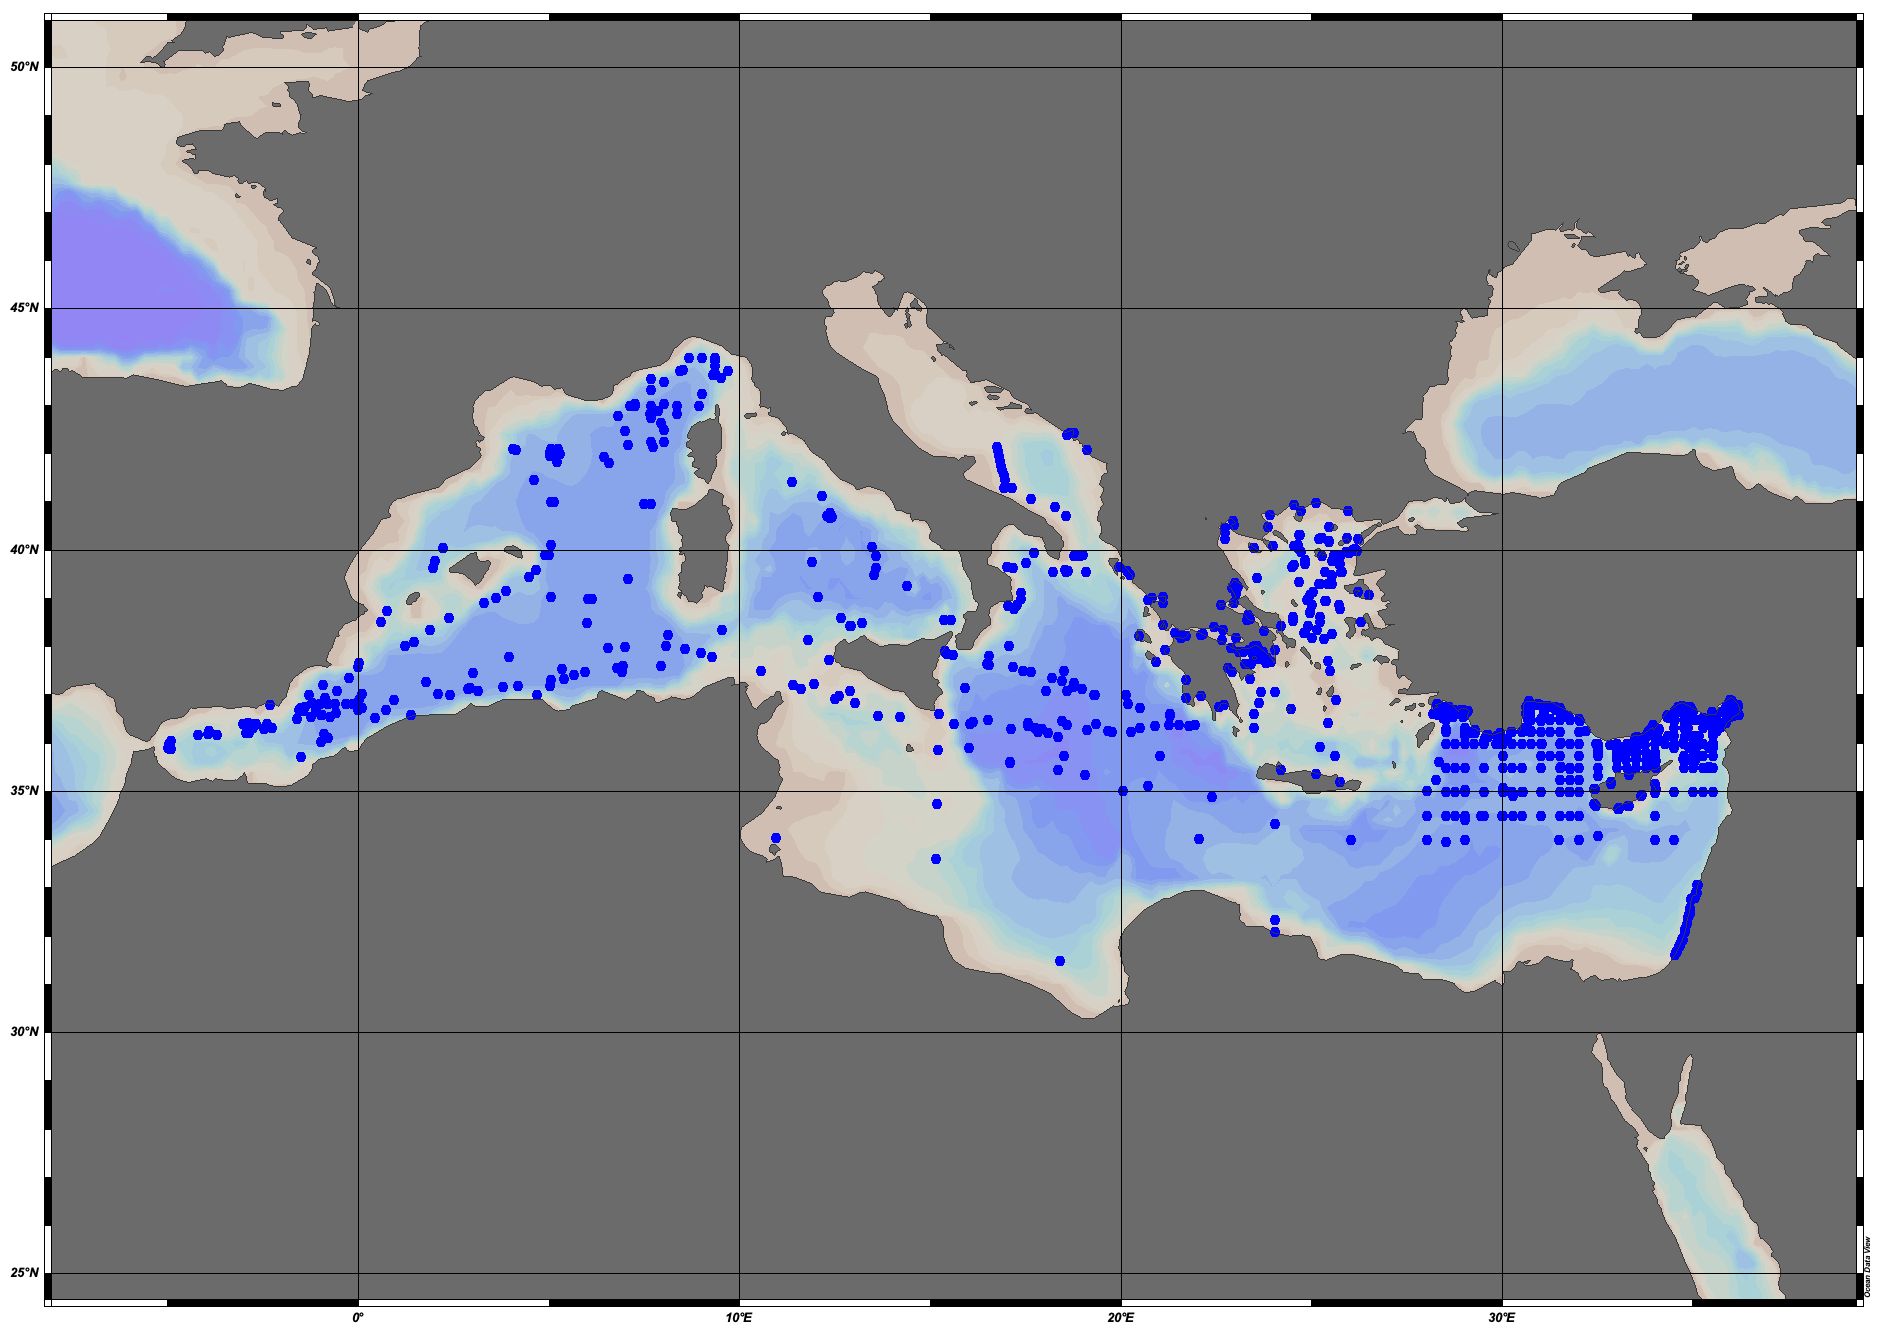
This product displays for Fluoranthene, positions with values counts that have been measured per matrix and are present in EMODnet regional contaminants aggregated datasets, v2022. The product displays positions for all available years.