 Catalogue PIGMA
0.1 degree
Type of resources
Available actions
Topics
Keywords
Contact for the resource
Provided by
Years
Formats
Representation types
Update frequencies
status
Resolution
-
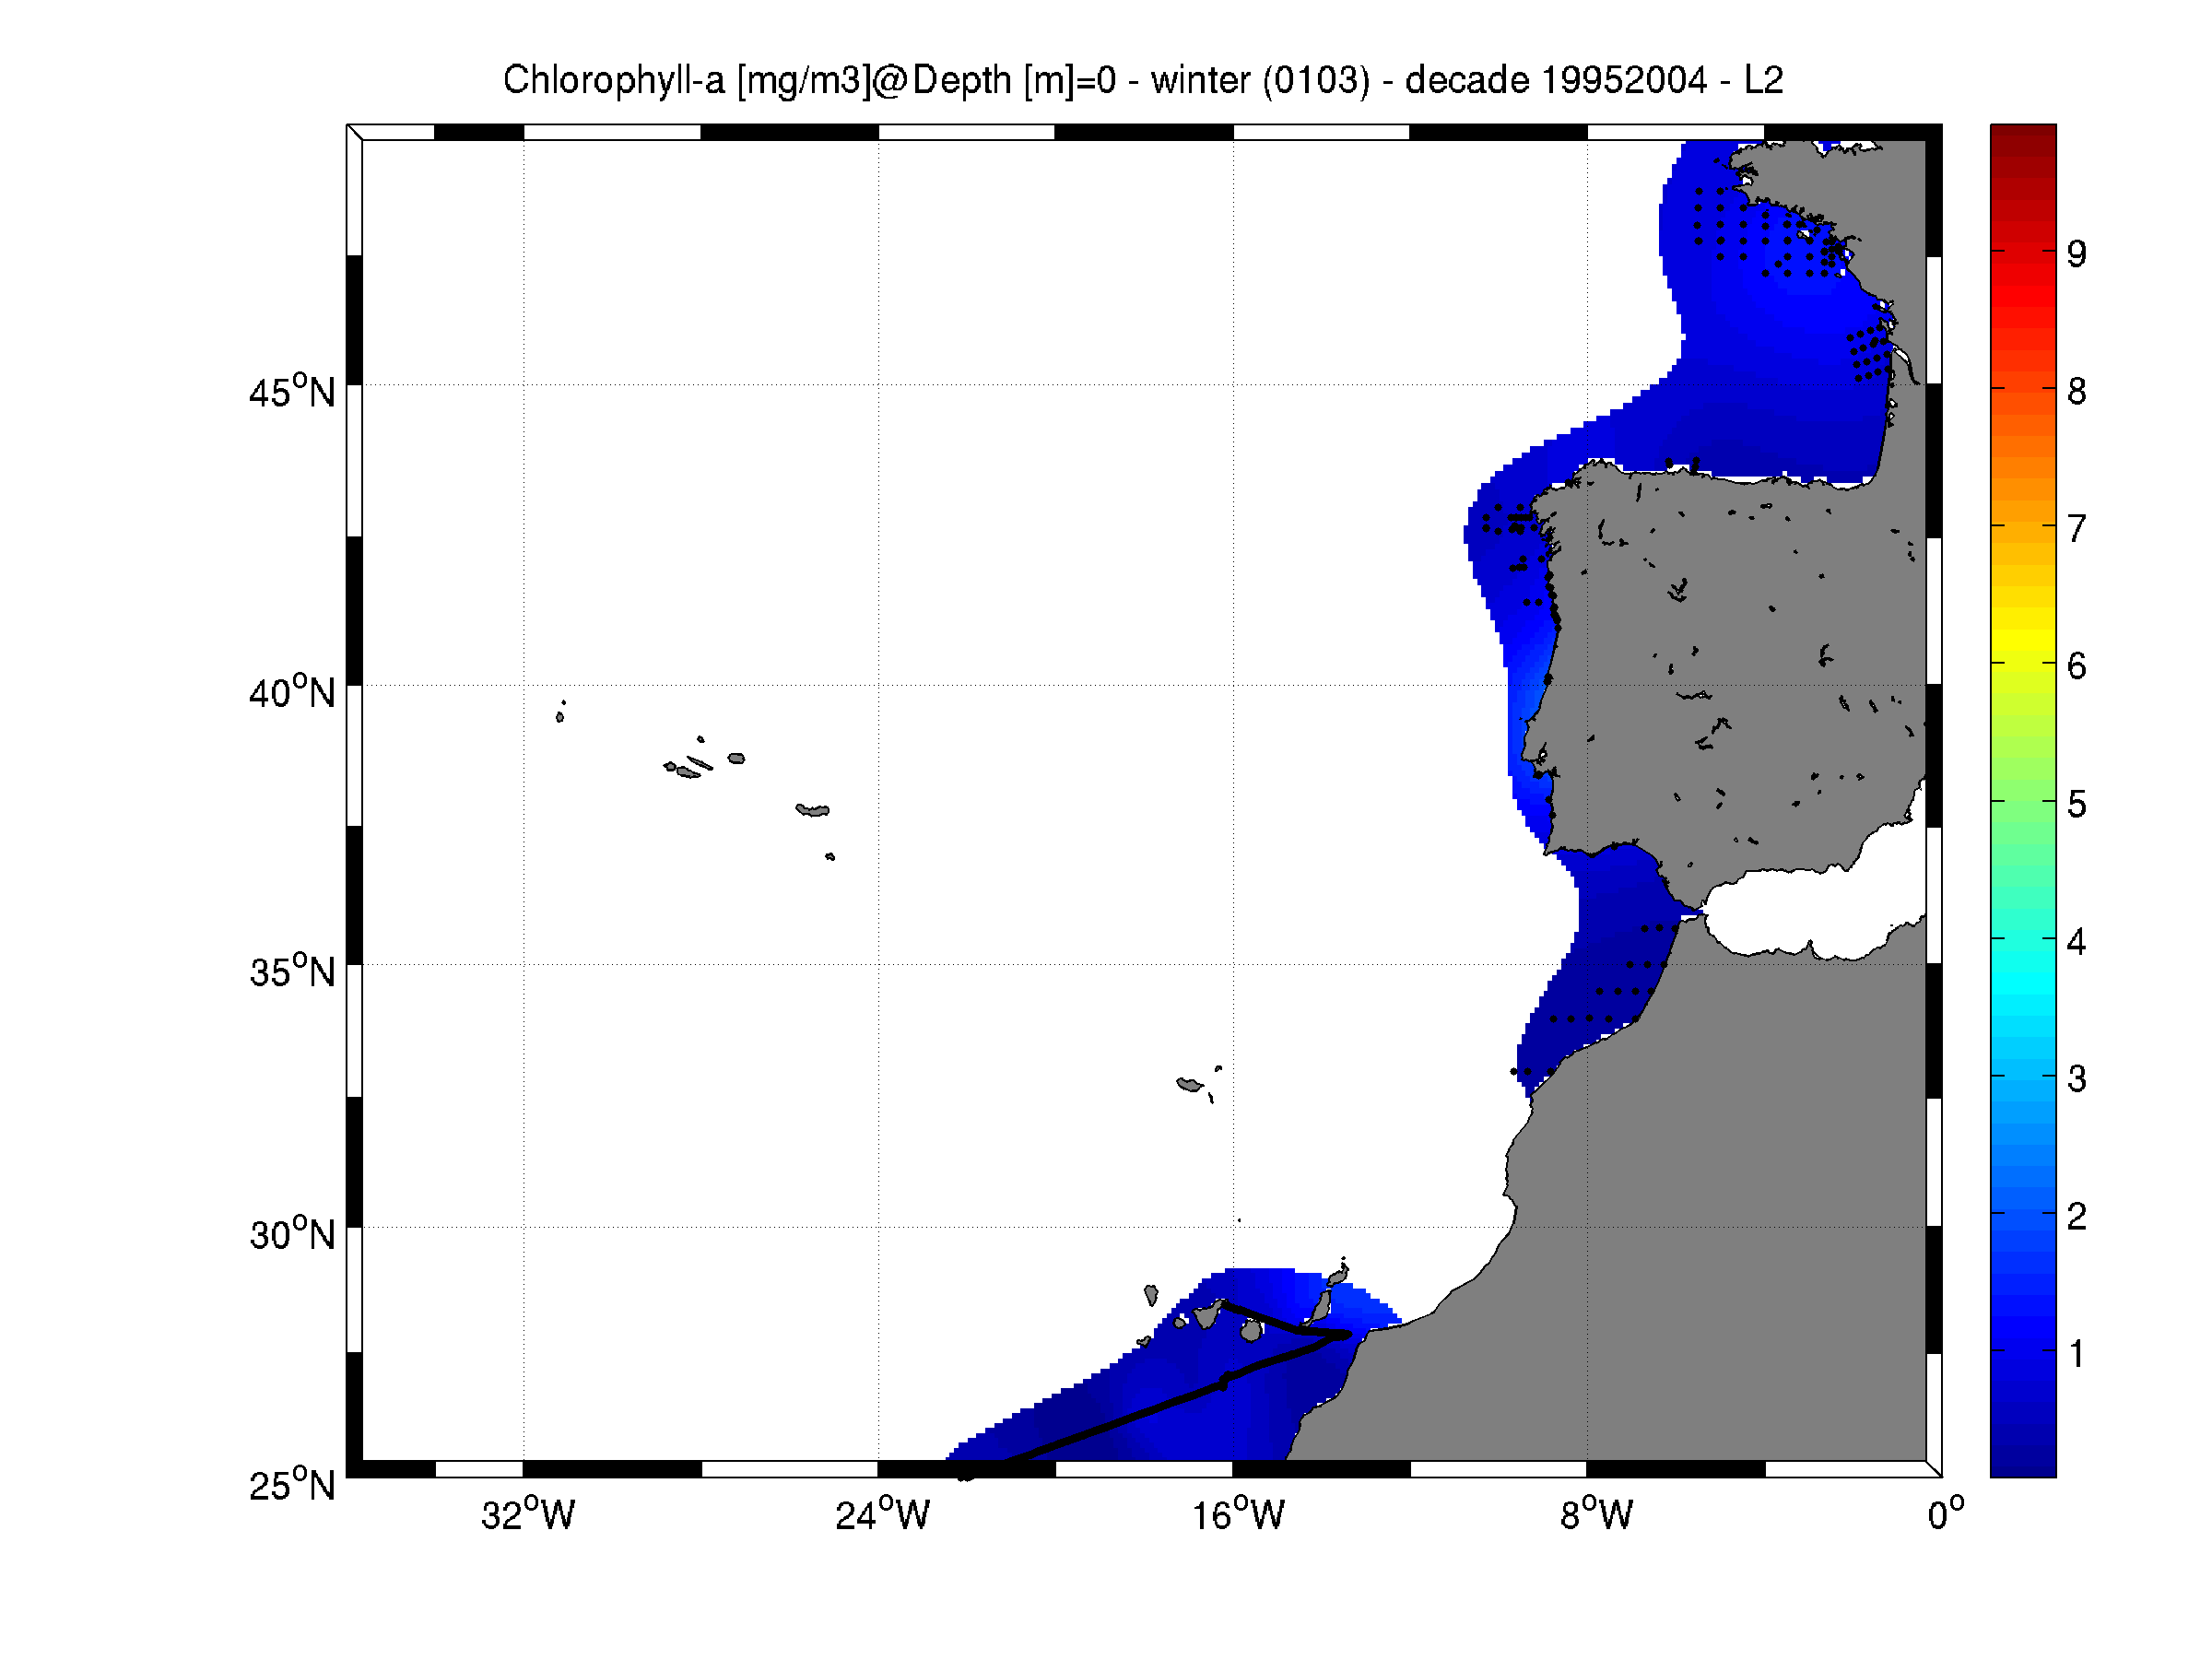
Moving 10-years analysis of Chlorophyll-a -1.0-ANA at Northeast Atlantic Ocean for each season: - winter: January-March, - spring: April-June, - summer: July-September, - autumn: October-December. Every year of the time dimension corresponds to the 10-year centred average of each season. Decades span from 1985-1994 until 2005-2014. Observational data span from 1970 to 2015. Depth range (IODE standard depths): -300.0, -250.0, -200.0, -150.0, -125.0, -100.0, -75.0, -50.0,-40.0, -30.0, -20.0, -10.0, -5.0, -0.0 Data Sources: observational data from SeaDataNet/EMODNet Chemistry Data Network. Description of DIVA analysis: Geostatistical data analysis by DIVA (Data-Interpolating Variational Analysis) tool. GEBCO 1min topography is used for the contouring preparation. Analyzed filed masked using relative error threshold 0.3 and 0.5 DIVA settings. Signal to noise ratio and correlation length were optimized and filtered vertically and a seasonally-averaged profile was used. Logarithmic transformation applied to the data prior to the analysis. Background field: the data mean value is subtracted from the data. Detrending of data: no, Advection constraint applied: no. Units: mg/m^3
-

Moving 6-year analysis of Water body chlorophyll-a in the NorthEast Atlantic for each season: - winter: January-March, - spring: April-June, - summer: July-September, - autumn: October-December. Every year of the time dimension corresponds to the 6-year centred average of each season. 6-year periods span from 1971/1976 until 2019/2024. Observation data span from 1971 to 2024. High-frequency observation trails were filtered to a 3h temporal resolution. Depth levels (IODE standard depths): [0.0, 5.0, 10.0, 20.0, 30.0, 40.0, 50.0, 75.0, 100.0, 125.0, 150.0, 200.0, 250.0, 300.0]. Data sources: observational data from SeaDataNet/EMODNet Chemistry Data Network. Description of DIVAnd analysis: the computation was done with DIVAnd (Data-Interpolating Variational Analysis in n dimensions), version 2.7.12, using GEBCO 30 sec topography for the spatial connectivity of water masses. The horizontal resolution of the produced DIVAnd maps is 0.1 degrees. Horizontal correlation length varies from 200km in open sea regions to 50km at the coast. Vertical correlation length is defined as twice the vertical resolution. Signal-to-noise ratio was fixed to 1 for vertical profiles and 0.1 for time series to account for the redundancy in the time series observations. A logarithmic transformation (DIVAnd.loglin) was applied to the data prior to the analysis. Background field: a vertically-filtered profile of the seasonal data mean value (including all years) is substracted from the data. Detrending of data: no, advection constraint applied: no. Units: mg/m3.
-
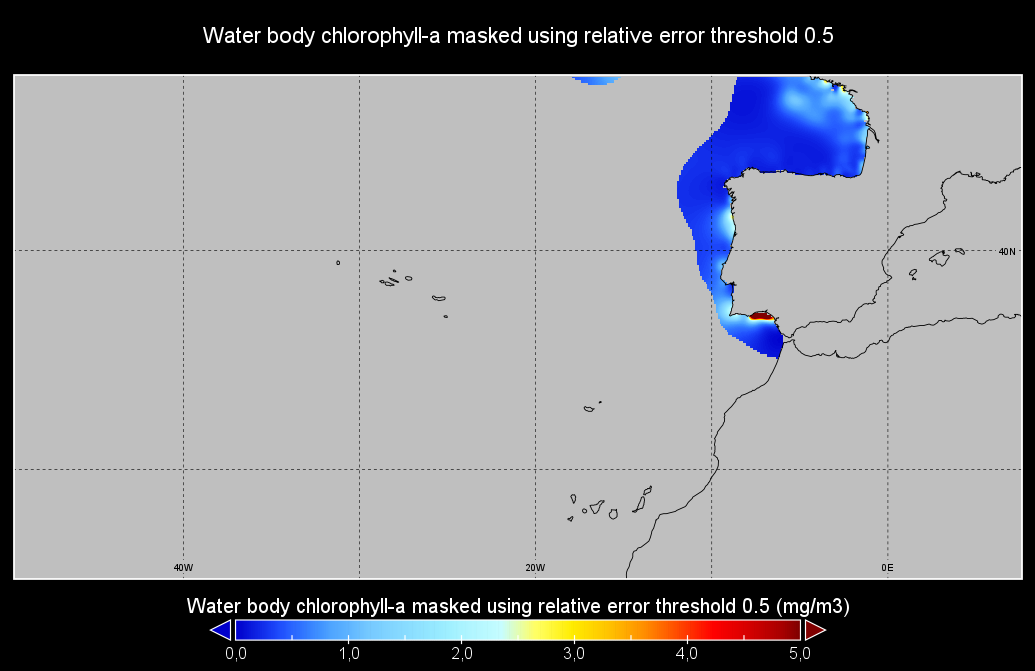
Moving 6-year analysis of Water body chlorophyll-a in the NorthEast Atlantic for each season: - winter: January-March, - spring: April-June, - summer: July-September, - autumn: October-December. Every year of the time dimension corresponds to the 6-year centred average of each season. 6-year periods span from 1971/1976 until 2016/2021. Observation data span from 1971 to 2021. High-frequency observation trails were filtered to a 3h temporal resolution. Depth levels (IODE standard depths): [0.0, 5.0, 10.0, 20.0, 30.0, 40.0, 50.0, 75.0, 100.0, 125.0, 150.0, 200.0, 250.0, 300.0]. Data sources: observational data from SeaDataNet/EMODNet Chemistry Data Network. Descrption of DIVAnd analysis: the computation was done with DIVAnd (Data-Interpolating Variational Analysis in n dimensions), version 2.7.4, using GEBCO 30 sec topography for the spatial connectivity of water masses. The horizontal resolution of the produced DIVAnd maps is 0.1 degrees. Horizontal correlation length varies from 200km in open sea regions to 50km at the coast. Vertical correlation length is defined as twice the vertical resolution. Signal-to-noise ratio was fixed to 1 for vertical profiles and 0.1 for time series to account for the redundancy in the time series observations. A logarithmic transformation (DIVAnd.Anam.loglin) was applied to the data prior to the analysis to avoid unrealistic negative values. Background field: a vertically-filtered profile of the seasonal data mean value (including all years) is substracted from the data. Detrending of data: no, advection constraint applied: no. Units: mg/m3.
-
Moving 6-year analysis and visualization of Water body phosphate in the North Sea. Four seasons (December-February, March-May, June-August, September-November). Data Sources: observational data from SeaDataNet/EMODnet Chemistry Data Network. Description of DIVA analysis: Geostatistical data analysis by DIVAnd (Data-Interpolating Variational Analysis) tool, version 2.7.9. results were subjected to the minfield option in DIVAnd to avoid negative/underestimated values in the interpolated results; error threshold masks L1 (0.3) and L2 (0.5) are included as well as the unmasked field. The depth dimension allows visualizing the gridded field at various depths.
-

Moving 6-year analysis and visualization of Water body silicate in the North Sea. Four seasons (December-February, March-May, June-August, September-November). Data Sources: observational data from SeaDataNet/EMODnet Chemistry Data Network. Description of DIVA analysis: Geostatistical data analysis by DIVAnd (Data-Interpolating Variational Analysis) tool, version 2.7.12. results were subjected to the minfield option in DIVAnd to avoid negative/underestimated values in the interpolated results; error threshold masks L1 (0.3) and L2 (0.5) are included as well as the unmasked field. The depth dimension allows visualizing the gridded field at various depths.
-
-

This dataset provide a times series of daily multi-sensor composite fields of Sea Surface Temperature (SST) foundation at high resolution (HR) on a 0.10 x 0.10 degree grid (approximately 10 x 10 km) for the Global Ocean, every 24 hours. Whereas along swath observation data essentially represent the skin or sub-skin SST, the L3S SST product is defined to represent the SST foundation (SSTfnd). SSTfnd is defined within GHRSST as the temperature at the base of the diurnal thermocline. It is so named because it represents the foundation temperature on which the diurnal thermocline develops during the day. SSTfnd changes only gradually along with the upper layer of the ocean, and by definition it is independent of skin SST fluctuations due to wind- and radiation-dependent diurnal stratification or skin layer response. It is therefore updated at intervals of 24 hrs. SSTfnd corresponds to the temperature of the upper mixed layer which is the part of the ocean represented by the top-most layer of grid cells in most numerical ocean models. It is never observed directly by satellites, but it comes closest to being detected by infrared and microwave radiometers during the night, when the previous day's diurnal stratification can be assumed to have decayed. The processing combines the observations of multiple polar orbiting and geostationary satellites, embedding infrared of microwave radiometers. All these sources are intercalibrated with each other before merging. A ranking procedure is used to select the best sensor observation for each grid point. This dataset is generated daily within a 24 delay and is therefore suitable for assimilation into operational models. It is produced in the frame of Copernicus Marine Service and the data available through various tools and protocols with a simple user registration from this service (product identifier: SST_GLO_SST_L3S_NRT_OBSERVATIONS_010_010) at: https://data.marine.copernicus.eu/product/SST_GLO_SST_L3S_NRT_OBSERVATIONS_010_010
-
A Group for High Resolution Sea Surface Temperature (GHRSST) Level 4 sea surface temperature (SST) analysis produced daily on an operational basis at the Canadian Meteorological Center. This dataset merges infrared satellite SST at varying points in the time series from the Advanced Very High Resolution Radiometer (AVHRR) from NOAA-18,19, the European Meteorological Operational-A (METOP-A) and Operational-B (METOP-B), and microwave data from the Advanced Microwave Scanning Radiometer 2 (AMSR2) onboard the GCOM-W satellite in conjunction with in situ observations of SST from drifting buoys and ships from the ICOADS program. It uses the previous days analysis as the background field for the statistical interpolation used to assimilate the satellite and in situ observations. This dataset adheres to the GHRSST Data Processing Specification (GDS) version 2 format specifications.
-

Moving 6-year analysis of Water body silicate in the NorthEast Atlantic for each season: - winter: January-March, - spring: April-June, - summer: July-September, - autumn: October-December. Every year of the time dimension corresponds to the 6-year centred average of each season. 6-year periods span from 1950/1955 until 2019/2024. Observation data span from 1950 to 2024. Depth levels (IODE standard depths): [0.0, 5.0, 10.0, 20.0, 30.0, 40.0, 50.0, 75.0, 100.0, 125.0, 150.0, 200.0, 250.0, 300.0, 400.0, 500.0, 600.0, 700.0, 800.0, 900.0, 1000.0, 1100.0, 1200.0, 1300.0, 1400.0, 1500.0, 1750.0, 2000.0]. Data sources: observational data from SeaDataNet/EMODNet Chemistry Data Network. Description of DIVAnd analysis: the computation was done with DIVAnd (Data-Interpolating Variational Analysis in n dimensions), version 2.7.12, using GEBCO 30 sec topography for the spatial connectivity of water masses. The horizontal resolution of the produced DIVAnd maps is 0.1 degrees. Horizontal correlation length varies from 300km in open sea regions to 50km at the coast. Vertical correlation length is defined as twice the vertical resolution. Signal-to-noise ratio was fixed to 1 for vertical profiles and 0.1 for time series to account for the redundancy in the time series observations. A logarithmic transformation (DIVAnd.loglin) was applied to the data prior to the analysis. Background field: a vertically-filtered profile of the seasonal data mean value (including all years) is substracted from the data. Detrending of data: no, advection constraint applied: no. Units: umol/l.
-
A Group for High Resolution Sea Surface Temperature (GHRSST) Level 4 sea surface temperature analysis produced daily on an operational basis at the Naval Oceanographic Office (NAVOCEANO) on a global 0.1 degree grid. The K10 L4 sea surface temperature analysis uses SST observations from the Advanced Very High Resolution Radiometer (AVHRR), the Advanced Microwave Scanning Radiometer for EOS (AMSR-E), and the Geostationary Operational Environmental Satellite (GOES) Imager. The age, reliability, and resolution of the data are used in the weighted average with the analysis tuned to represent SST at 1 meter depth. AVHRR Pathfinder 9km climatology is used when no new satellite SST retrievals are available after 34 days.