 Catalogue PIGMA
2016
Type of resources
Available actions
Topics
Keywords
Contact for the resource
Provided by
Years
Formats
Representation types
Update frequencies
status
Scale
Resolution
-
Specifications of the desirable and recommended product attributes for generating spatial layers of sea level trend for the last 10 years for the Mediterranean basin and for each NUTS3 region along the coast.
-

Businesses, policymakers, and local communities need to access reliable weather and climate information to safeguard human health, wellbeing, economic growth, and environmental sustainability. However, important changes in climate variability and extreme weather events are difficult to pinpoint and account for in existing modelling and forecasting tools. Moreover, many changes in the global climate are linked to the Arctic, where climate change is occurring rapidly, making weather and climate prediction a considerable challenge. Blue-Action evaluated the impact of Arctic warming on the northern hemisphere and developed new techniques to improve forecast accuracy at sub-seasonal to decadal scales. Blue-Action specifically worked to understand and simulate the linkages between the Arctic and the global climate system, and the Arctic’s role in generating weather patterns associated with hazardous conditions and climatic extremes. In doing so, Blue-Action aimed to improve the safety and wellbeing of people in the Arctic and across the Northern Hemisphere, reduce the risks associated with Arctic operations and resource exploitation, and support evidence-based decision-making by policymakers worldwide.
-
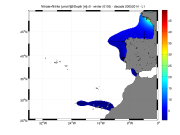
Moving 10-years analysis of nitrate plus nitrite at Northeast Atlantic Ocean for each season: - winter: January-March, - spring: April-June, - summer: July-September, - autumn: October-December. Every year of the time dimension corresponds to the 10-year centred average of each season. Decades span : - from 1984-1993 until 2005-2014 (winter) - from 1979-1988 until 2005-2014 (spring) - from 1982-1991 until 2005-2014 (summer) - from 1972-1981 until 2005-2014 (autumn) Observational data span from 1962 to 2014. Depth range (IODE standard depths): -3000.0, -2500.0, -2000.0, -1750, -1500.0, -1400.0, -1300.0, -1200.0, -1100.0, -1000.0, -900.0, -800.0, -700.0, -600.0, -500.0, -400.0, -300.0, -250.0, -200.0, -150.0, -125.0, -100.0, -75.0, -50.0,-40.0, -30.0, -20.0, -10.0, -5.0, -0.0 Data Sources: observational data from SeaDataNet/EMODNet Chemistry Data Network. Description of DIVA analysis: Geostatistical data analysis by DIVA (Data-Interpolating Variational Analysis) tool. GEBCO 1min topography is used for the contouring preparation. Analyzed filed masked using relative error threshold 0.3 and 0.5 DIVA settings. Signal to noise ratio and correlation length were optimized and filtered vertically and a seasonally-averaged profile was used. Logarithmic transformation applied to the data prior to the analysis. Background field: the data mean value is subtracted from the data. Detrending of data: no, Advection consraint applied: no. Units: umol/l
-
Specification of the desirable and recommended product attributes for generating time series of average annual sea-level rise for the last 50 and 100 yrs.
-
Auteur(s): Cha Lucie , Analyse des paysages de méga évènements sur des sites internationaux. Historique de l'évolution de expositions géantes. Projet d'aménagement de la ville de Bordeaux qui a posé sa candidature pour l'Exposition universelle de 2025
-
Description ot the spatial layers attributes of sea level trend for the last 50 and 100 years for the Mediterranean basin and for each NUTS3 region along the coast.
-

VOS/SOOP tracks are usually repeated several times a year and inform about the marine sinks and sources of atmospheric carbon dioxide on a global bases and their variability. Data from this network has been made available to the scientific community and interested public via the Carbon Dioxide Information Analysis Centre (CDIAC) Oceans at the Department of Energy, USA, since the early 1990’s where PIs submitted and shared their data. In 2017, CDIAC Ocean will be named Ocean Carbon Data System (OCADS) and join NOAA’s National Centers for Environmental Information (NCEI). In 2007, the marine biogeochemistry community coordinated by the International Ocean Carbon Coordination Project (IOCCP), launched the Surface Ocean Carbon Dioxide ATlas (SOCAT) in order to uniformly quality control and format the data with detailed documentation. Underway carbon dioxide data from the VOS network are integrated in SOCAT.
-
Specification of the desirable and recommended products attributes for generating spatial layers of sea level trend for the last 50 and 100 years for the Mediterranean basin and for each NUTS3 region along the coast.
-
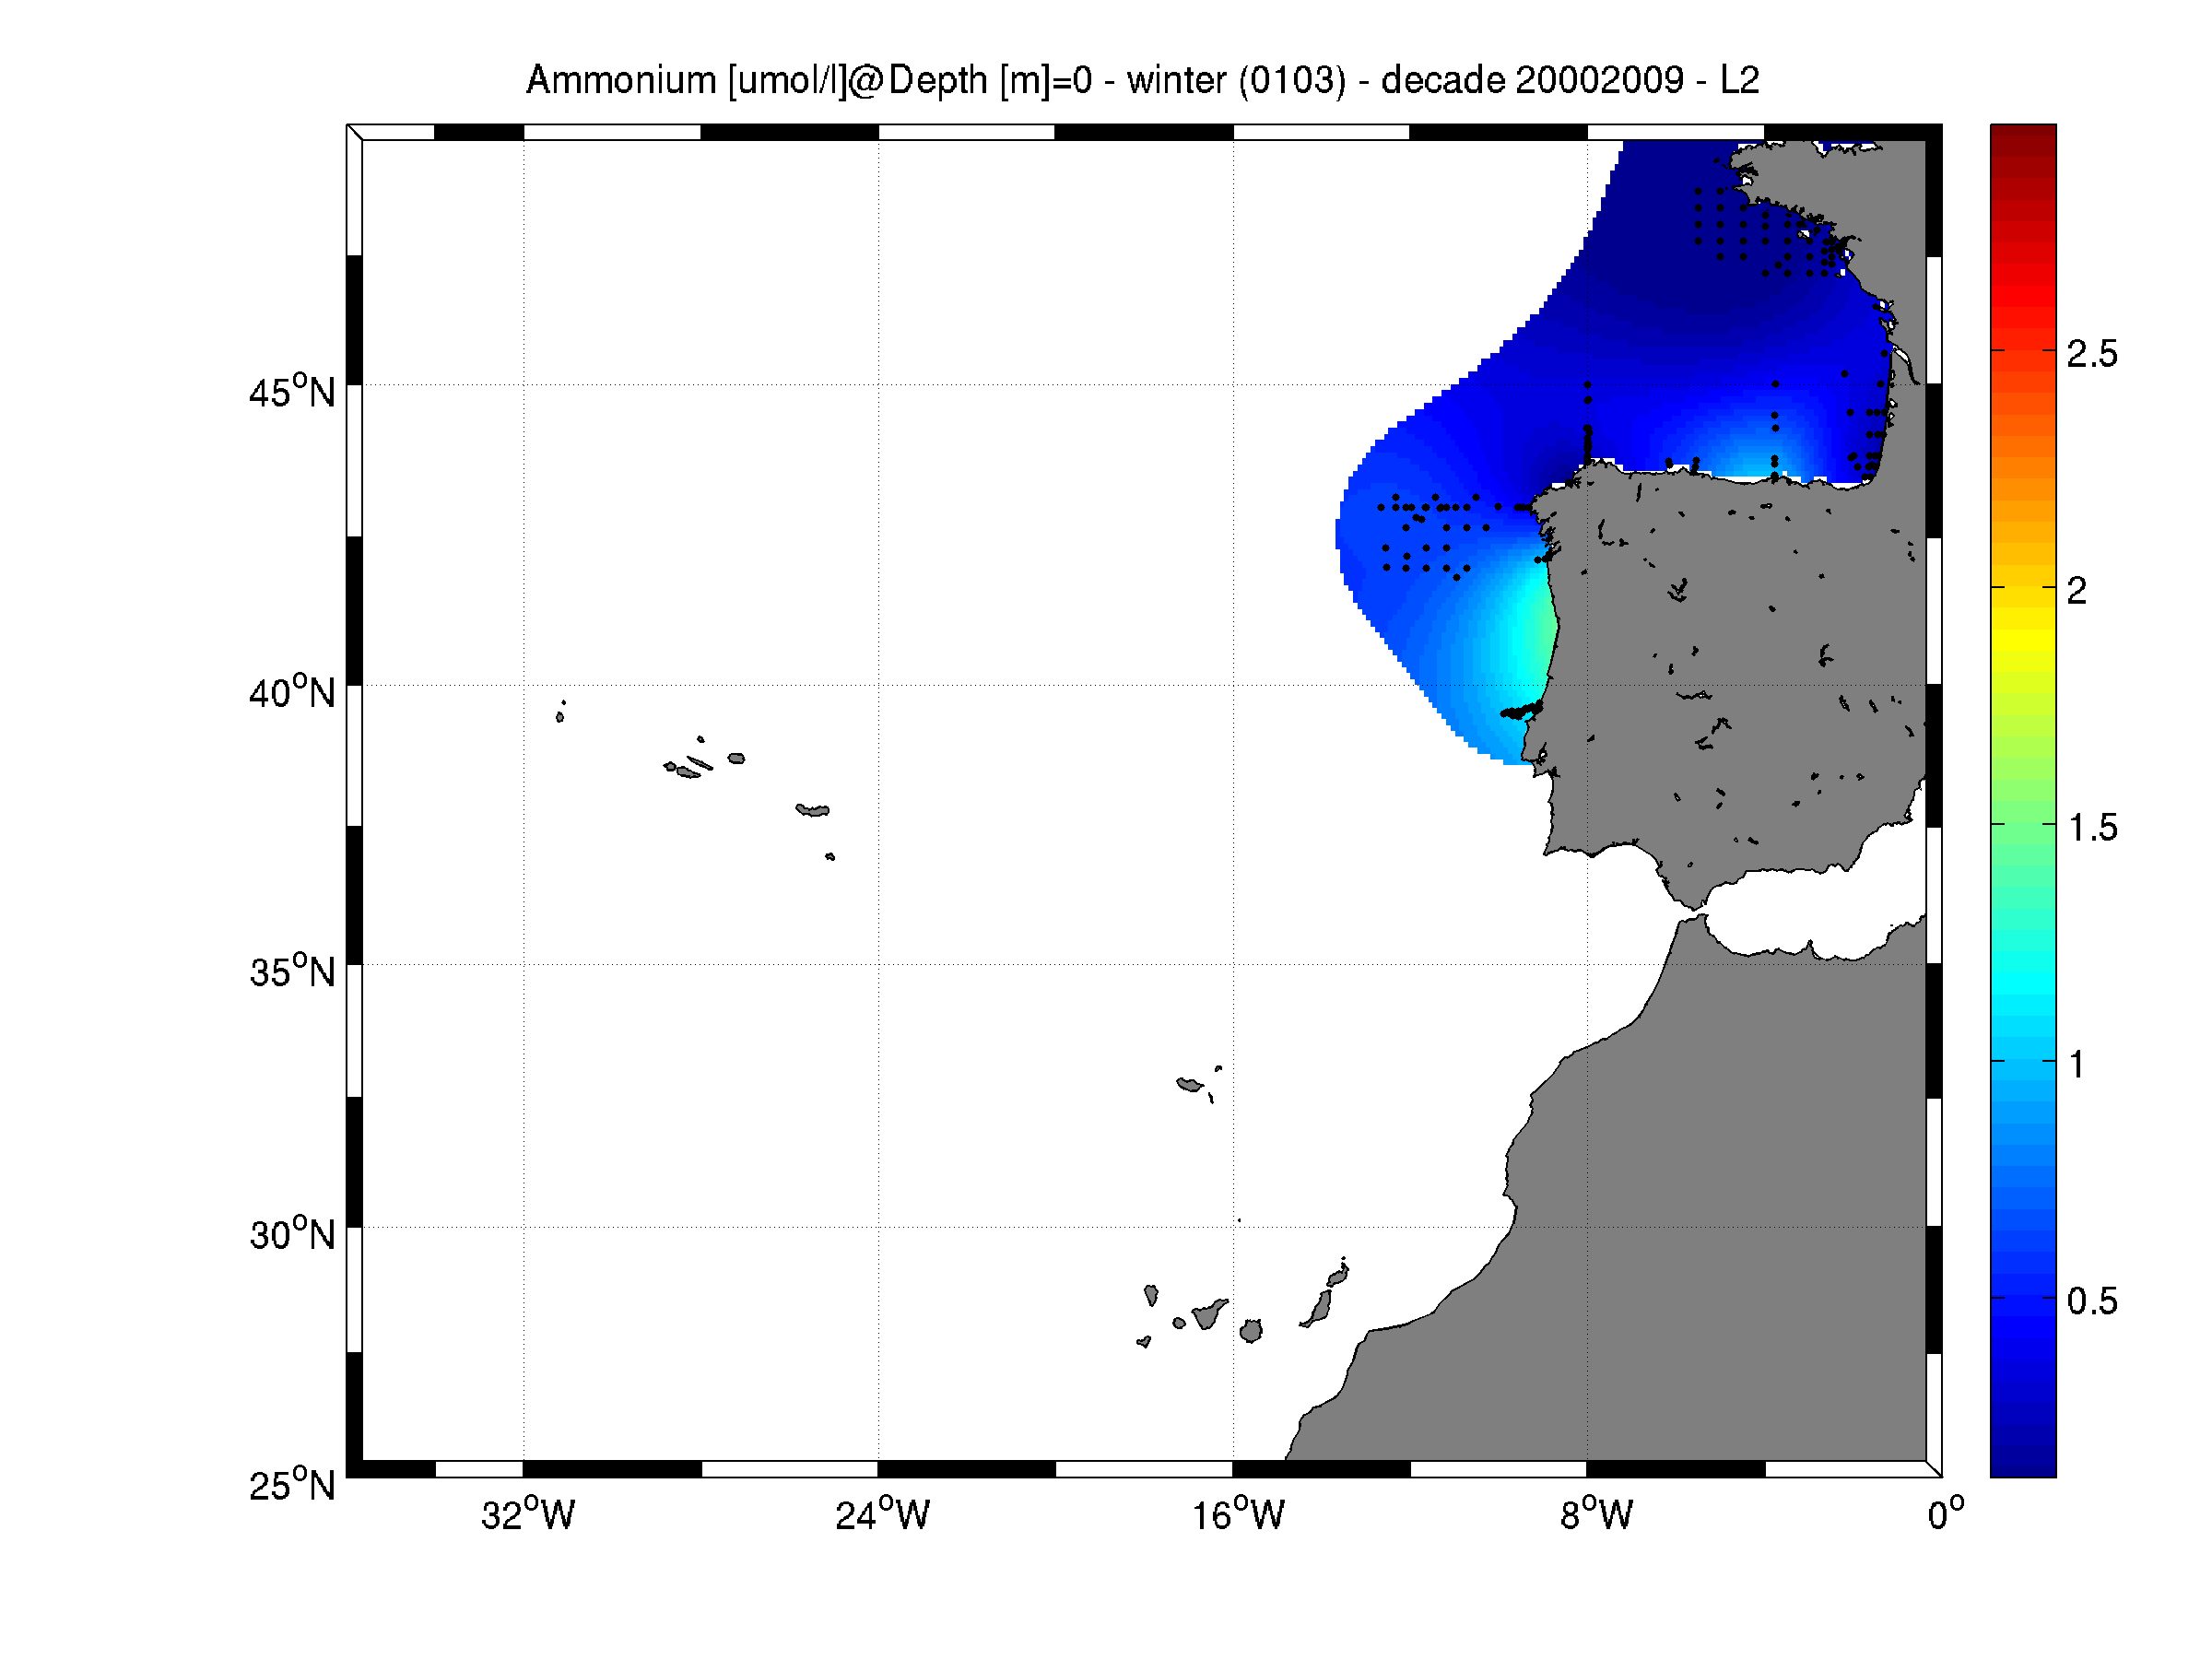
Moving 10-years analysis of Ammonium at Northeast Atlantic Ocean for each season: - winter: January-March, - spring: April-June, - summer: July-September, - autumn: October-December. Every year of the time dimension corresponds to the 10-year centred average of each season. Decades span : - from 1984-1993 until 2005-2014 (winter) - from 1980-1989 until 2005-2014 (spring) - from 1980-1989 until 2005-2014 (summer) - from 1980-1989 until 2005-2014 (autumn) Observational data span from 1962 to 2014. Depth range (IODE standard depths): -3000.0, -2500.0, -2000.0, -1750, -1500.0, -1400.0, -1300.0, -1200.0, -1100.0, -1000.0, -900.0, -800.0, -700.0, -600.0, -500.0, -400.0, -300.0, -250.0, -200.0, -150.0, -125.0, -100.0, -75.0, -50.0,-40.0, -30.0, -20.0, -10.0, -5.0, -0.0 Data Sources: observational data from SeaDataNet/EMODNet Chemistry Data Network. Description of DIVA analysis: Geostatistical data analysis by DIVA (Data-Interpolating Variational Analysis) tool. GEBCO 1min topography is used for the contouring preparation. Analyzed filed masked using relative error threshold 0.3 and 0.5 DIVA settings. Signal to noise ratio and correlation length were optimized and filtered vertically and a seasonally-averaged profile was used. Logarithmic transformation applied to the data prior to the analysis. Background field: the data mean value is subtracted from the data. Detrending of data: no, Advection constraint applied: no. Units: umol/l
-
Description of the spatial layers atributes of sea surface temperature trend for the last 10, 50 and 100 years for the Mediterranean basin and for each NUTS3 region along the coast.