 Catalogue PIGMA
/Environment/Pollution
Type of resources
Available actions
Topics
Keywords
Contact for the resource
Provided by
Years
Formats
Representation types
-
Stakeholder networks from 32 countries united to collaborate on Ocean Action, Climate Action, addressing pollution from land-based, riverine and marine-based sources and advancing Circular Economy development. International Waste Platform provides international expertise and launches joint initiatives; It supports advancing solutions to mitigate the global waste, plastic pollution & climate crises which are interlinked. Representatives committed themselves to align objectives, to support the implementation of strategies of Ocean Action and Climate Action, as well as to share ideas, best practices, concepts, programs, knowledge and opportunities; including the reduction of plastic debris at the source, before it enters rivers and the coastal environment. Country / regional networks and national marine debris networks make a difference in societal behaviour change and environmental policies by providing input and promoting action which aims at finding solutions to reduce (ocean) plastic pollution. Country and regional networks are instrumental to reach the prevention and reduction of marine pollution, facilitate and foster the establishment of national and international partnerships in a multi-stakeholder approach.
-
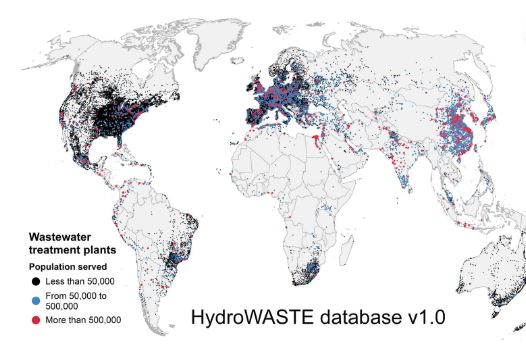
HydroWASTE is a spatially explicit global database of 58,502 wastewater treatment plants (WWTPs) and their characteristics. This database was developed by combining national and regional datasets with auxiliary information to derive or complete missing characteristics, including the amount of people served, the flow rate of effluents, and the level of treatment of processed wastewater. The HydroSHEDS river network with streamflow estimates was used to geo-reference plant outfall locations and to assess the distribution of wastewaters at a global scale. All wastewater treatment plants are co-registered to the global river network of the HydroRIVERS database via their estimated outfall locations.
-
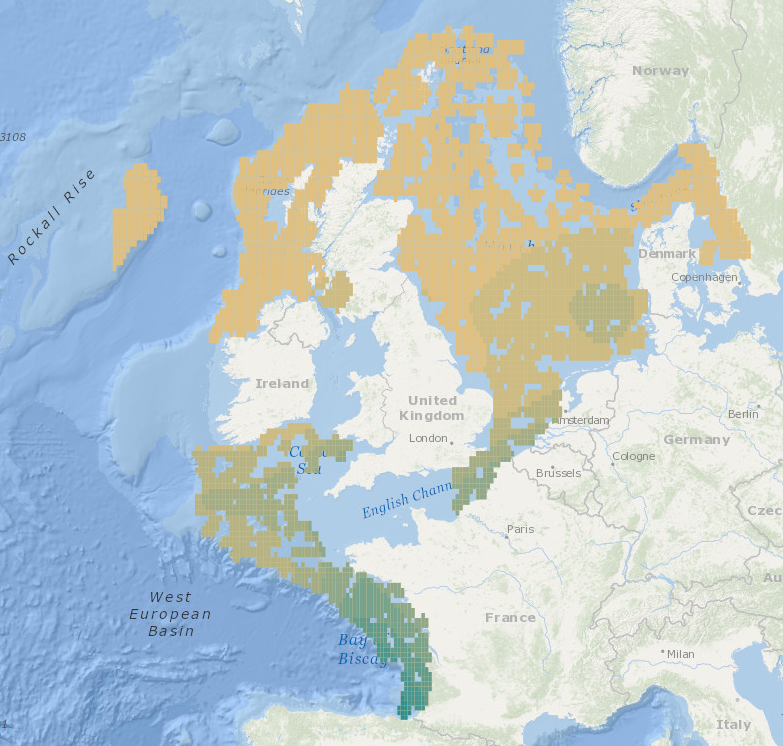
Intermediate Assessment 2017 - Seabed Litter - Litter is widespread on the seafloor across the area assessed, with plastic being the predominant material encountered. In the areas assessed, higher amounts of litter are found in the Eastern Bay of Biscay, Southern Celtic Seas and English Channel relative to the north of the Greater North Sea and Celtic Seas.
-
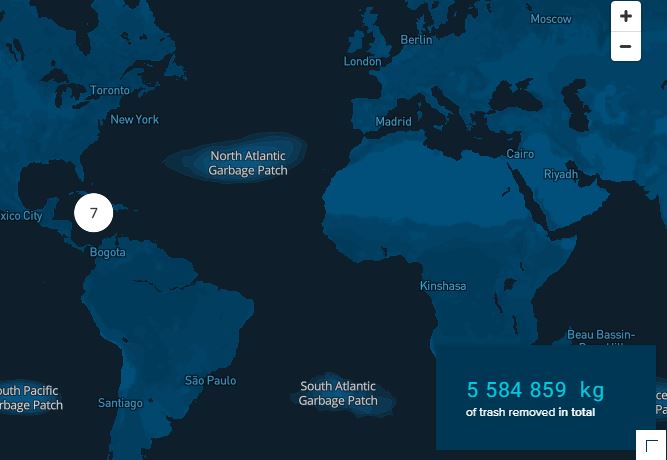
Every year, millions of tons of plastic enter the oceans, of which the majority spills out from rivers. A portion of this plastic travels to ocean garbage patches, where it gets caught in a vortex of circulating currents alongside plastic from other sources (e.g. offshore fishing activities). If no action is taken, plastic will increasingly impact our ecosystems, health, and economies. The Ocean Cleanup is a non-profit organization developing and scaling technologies to rid the oceans of plastic. To achieve this objective, we have to work on a combination of closing the sources of plastic pollution and cleaning up what has already accumulated in the ocean and doesn’t go away by itself. This goal means we plan to put ourselves out of business – once we have completed this project, our work is done. To rid the oceans of plastic, we need not only to clean up what is already out there but also stop new plastic from entering the ocean – we need to close the tap. Working together with government leaders, individuals, and private corporations, our goal is to tackle these 1000 most polluting rivers all over the world Every single year, marine plastic costs the economy (6 to 19) billions of dollars – impacting tourism, fisheries and aquaculture, and (governmental) cleanups. And that doesn’t include the impact on our health and on the marine ecosystem. Intercepting plastic in rivers is much more cost-effective than dealing with the consequences downstream.
-
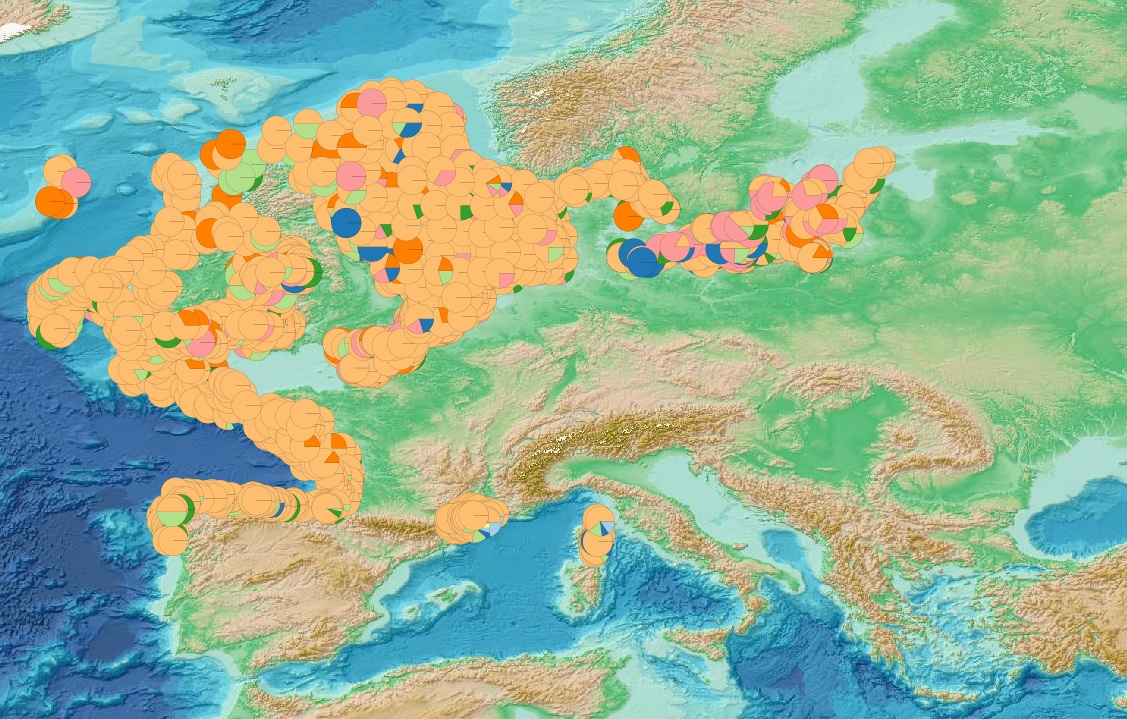
This visualization product displays the marine litter material categories percentage per trawl. EMODnet Chemistry included the collection of marine litter in its 3rd phase. Since the beginning of 2018, data of seafloor litter collected by international fish-trawl surveys have been gathered and processed in the EMODnet Chemistry Marine Litter Database (MLDB). The harmonization of all the data has been the most challenging task considering the heterogeneity of the data sources, sampling protocols (OSPAR and MEDITS protocols) and reference lists used on a European scale. Moreover, within the same protocol, different gear types are deployed during fishing bottom trawl surveys. Unlike other EMODnet seafloor litter products, all trawls surveyed since 2007 are included in this map even if the wingspread and/or the distance are unknown. Only surveys with an unknown number of items were excluded from this product. Harmonization of the material categories between ICES and MEDITS lists has been performed and the following calculation has been applied: Material % = (∑Number of items of each material category*100)/(∑Number of items of all material categories) More information on data processing and calculation are detailed in the document attached. Warning: the absence of data on the map doesn't necessarily mean that they don't exist, but that no information has been entered in the Marine Litter Database for this area.
-
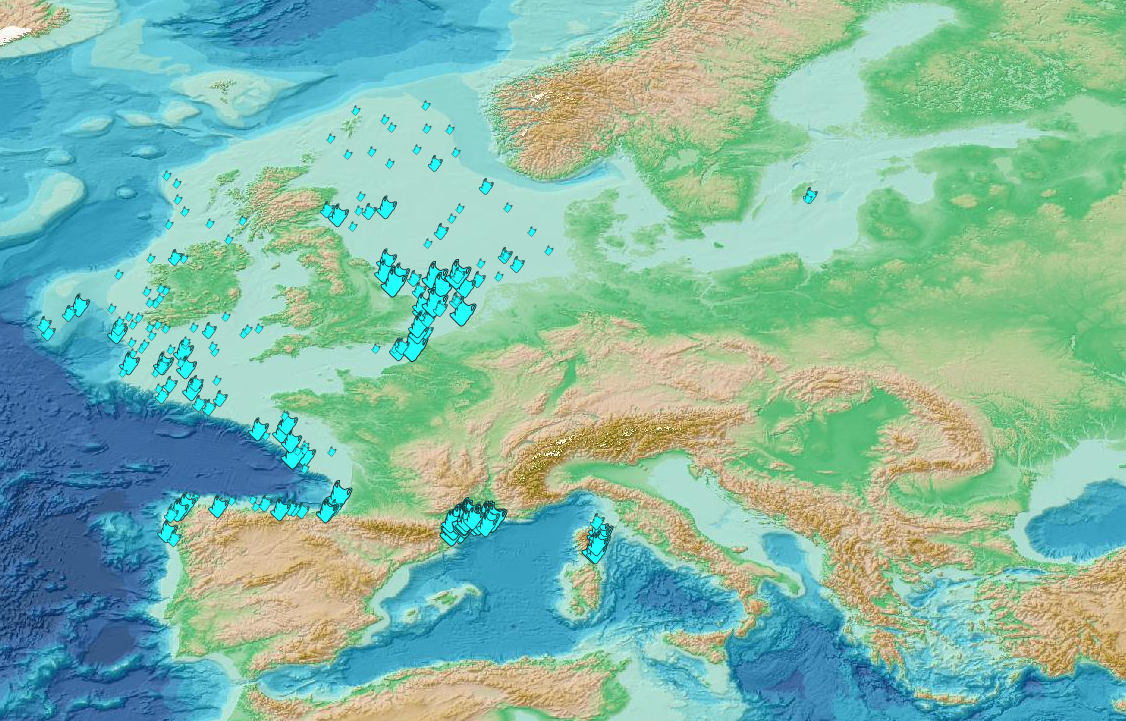
This visualization product displays plastic bags density per trawl. EMODnet Chemistry included the collection of marine litter in its 3rd phase. Since the beginning of 2018, data of seafloor litter collected by international fish-trawl surveys have been gathered and processed in the EMODnet Chemistry Marine Litter Database (MLDB). The harmonization of all the data has been the most challenging task considering the heterogeneity of the data sources, sampling protocols (OSPAR and MEDITS protocols) and reference lists used on a European scale. Moreover, within the same protocol, different gear types are deployed during fishing bottom trawl surveys. In cases where the wingspread and/or number of items were unknown, data could not be used because these fields are needed to calculate the density. Data collected before 2011 are affected by this filter. When the distance reported in the data was null, it was calculated from: - the ground speed and the haul duration using this formula: Distance (km) = Haul duration (h) * Ground speed (km/h); - the trawl coordinates if the ground speed and the haul duration were not filled in. The swept area is calculated from the wingspread (which depends on the fishing gear type) and the distance trawled: Swept area (km²) = Distance (km) * Wingspread (km) Densities have been calculated on each trawl and year using the following computation: Density of plastic bags (number of items per km²) = ∑Number of plastic bags related items / Swept area (km²) Percentiles 50, 75, 95 & 99 have been calculated taking into account data for all years. The list of selected items for this product is attached to this metadata. Information on data processing and calculation is detailed in the attached methodology document. Warning: the absence of data on the map doesn't necessarily mean that they don't exist, but that no information has been entered in the Marine Litter Database for this area.
-
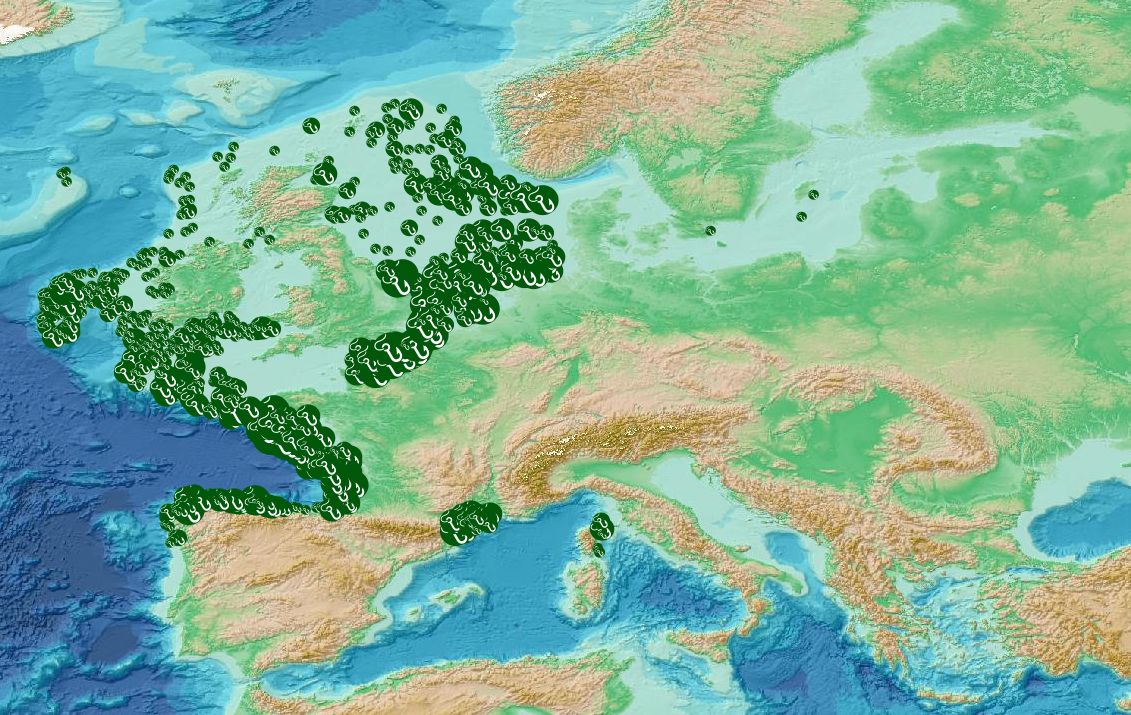
This visualization product displays fishing related items density per trawl. EMODnet Chemistry included the collection of marine litter in its 3rd phase. Since the beginning of 2018, data of seafloor litter collected by international fish-trawl surveys have been gathered and processed in the EMODnet Chemistry Marine Litter Database (MLDB). The harmonization of all the data has been the most challenging task considering the heterogeneity of the data sources, sampling protocols (OSPAR and MEDITS protocols) and reference lists used on a European scale. Moreover, within the same protocol, different gear types are deployed during fishing bottom trawl surveys. In cases where the wingspread and/or the number of items were unknown, data could not be used because these fields are needed to calculate the density. Data collected before 2011 are affected by this filter. When the distance reported in the data was null, it was calculated from: - the ground speed and the haul duration using this formula: Distance (km) = Haul duration (h) * Ground speed (km/h); - the trawl coordinates if the ground speed and the haul duration were not filled in. The swept area is calculated from the wingspread (which depends on the fishing gear type) and the distance trawled: Swept area (km²) = Distance (km) * Wingspread (km) Densities have been calculated on each trawl using the following computation: Density of fishing related items (number of items per km²) = ∑Number of fishing related items / Swept area (km²) Percentiles 50, 75, 95 & 99 have been calculated taking into account data for all years. The list of selected items for this product is attached to this metadata. Information on data processing and calculation is detailed in the attached methodology document. Warning: the absence of data on the map doesn't necessarily mean that they don't exist, but that no information has been entered in the Marine Litter Database for this area.
-
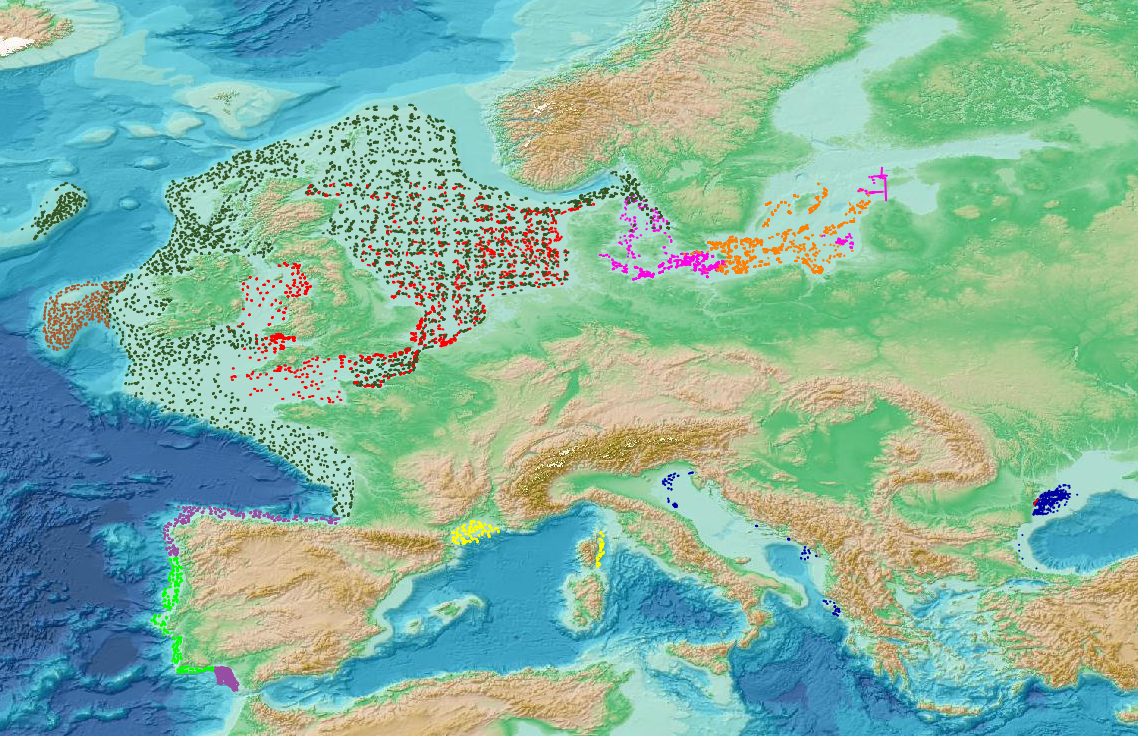
This visualization product displays the location of all the surveys present in the EMODnet marine litter database (MLDB). The different fishing gears used are represented by different colors. EMODnet Chemistry included the collection of marine litter in its 3rd phase. Since the beginning of 2018, data of seafloor litter collected by international fish-trawl surveys have been gathered and processed in the EMODnet Chemistry Marine Litter Database (MLDB). The harmonization of all the data has been the most challenging task considering the heterogeneity of the data sources, sampling protocols (OSPAR and MEDITS protocols) and reference lists used on a European scale. Moreover, within the same protocol, different gear types are deployed during fishing bottom trawl surveys. Unlike other EMODnet seafloor litter products, all trawls surveyed since 2006 are included in this map even if the wingspread and/or the distance are unknown. Only surveys with an unknown number of items were excluded from this product. More information on data processing and calculation are detailed in the document attached. Warning: the absence of data on the map doesn't necessarily mean that they don't exist, but that no information has been entered in the Marine Litter Database for this area.
-
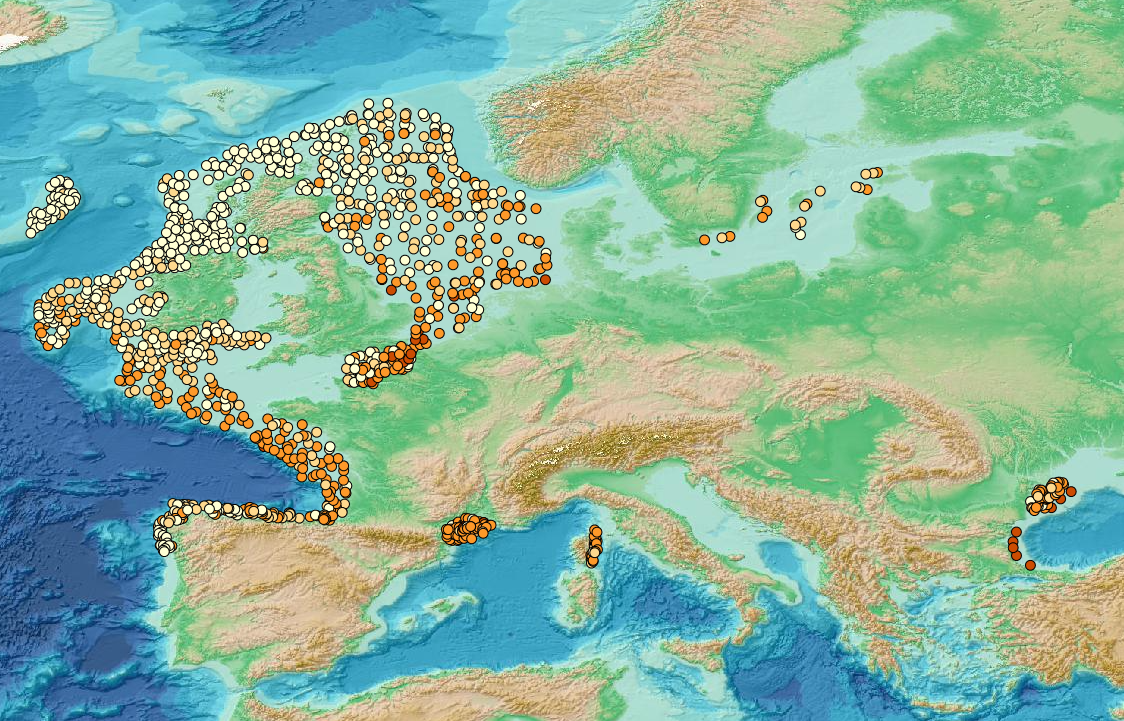
This visualization product displays the density of seafloor litter per trawl. EMODnet Chemistry included the collection of marine litter in its 3rd phase. Since the beginning of 2018, data of seafloor litter collected by international fish-trawl surveys have been gathered and processed in the EMODnet Chemistry Marine Litter Database (MLDB). The harmonization of all the data has been the most challenging task considering the heterogeneity of the data sources, sampling protocols (OSPAR and MEDITS protocols) and reference lists used on a European scale. Moreover, within the same protocol, different gear types are deployed during fishing bottom trawl surveys. In cases where the wingspread and/or number of items were unknown, data could not be used because these fields are needed to calculate the density. Data collected before 2011 are affected by this filter. When the distance reported in the data was null, it was calculated from: - the ground speed and the haul duration using this formula: Distance (km) = Haul duration (h) * Ground speed (km/h); - the trawl coordinates if the ground speed and the haul duration were not filled in. The swept area is calculated from the wingspread (which depends on the fishing gear type) and the distance trawled: Swept area (km²) = Distance (km) * Wingspread (km) Densities have been calculated on each trawl and year using the following computation: Density (number of items per km²) = ∑Number of items / Swept area (km²) Percentiles 50, 75, 95 & 99 have been calculated taking into account data for all years. More information on data processing and calculation are detailed in the document attached. Warning: the absence of data on the map doesn't necessarily mean that they don't exist, but that no information has been entered in the Marine Litter Database for this area.
-
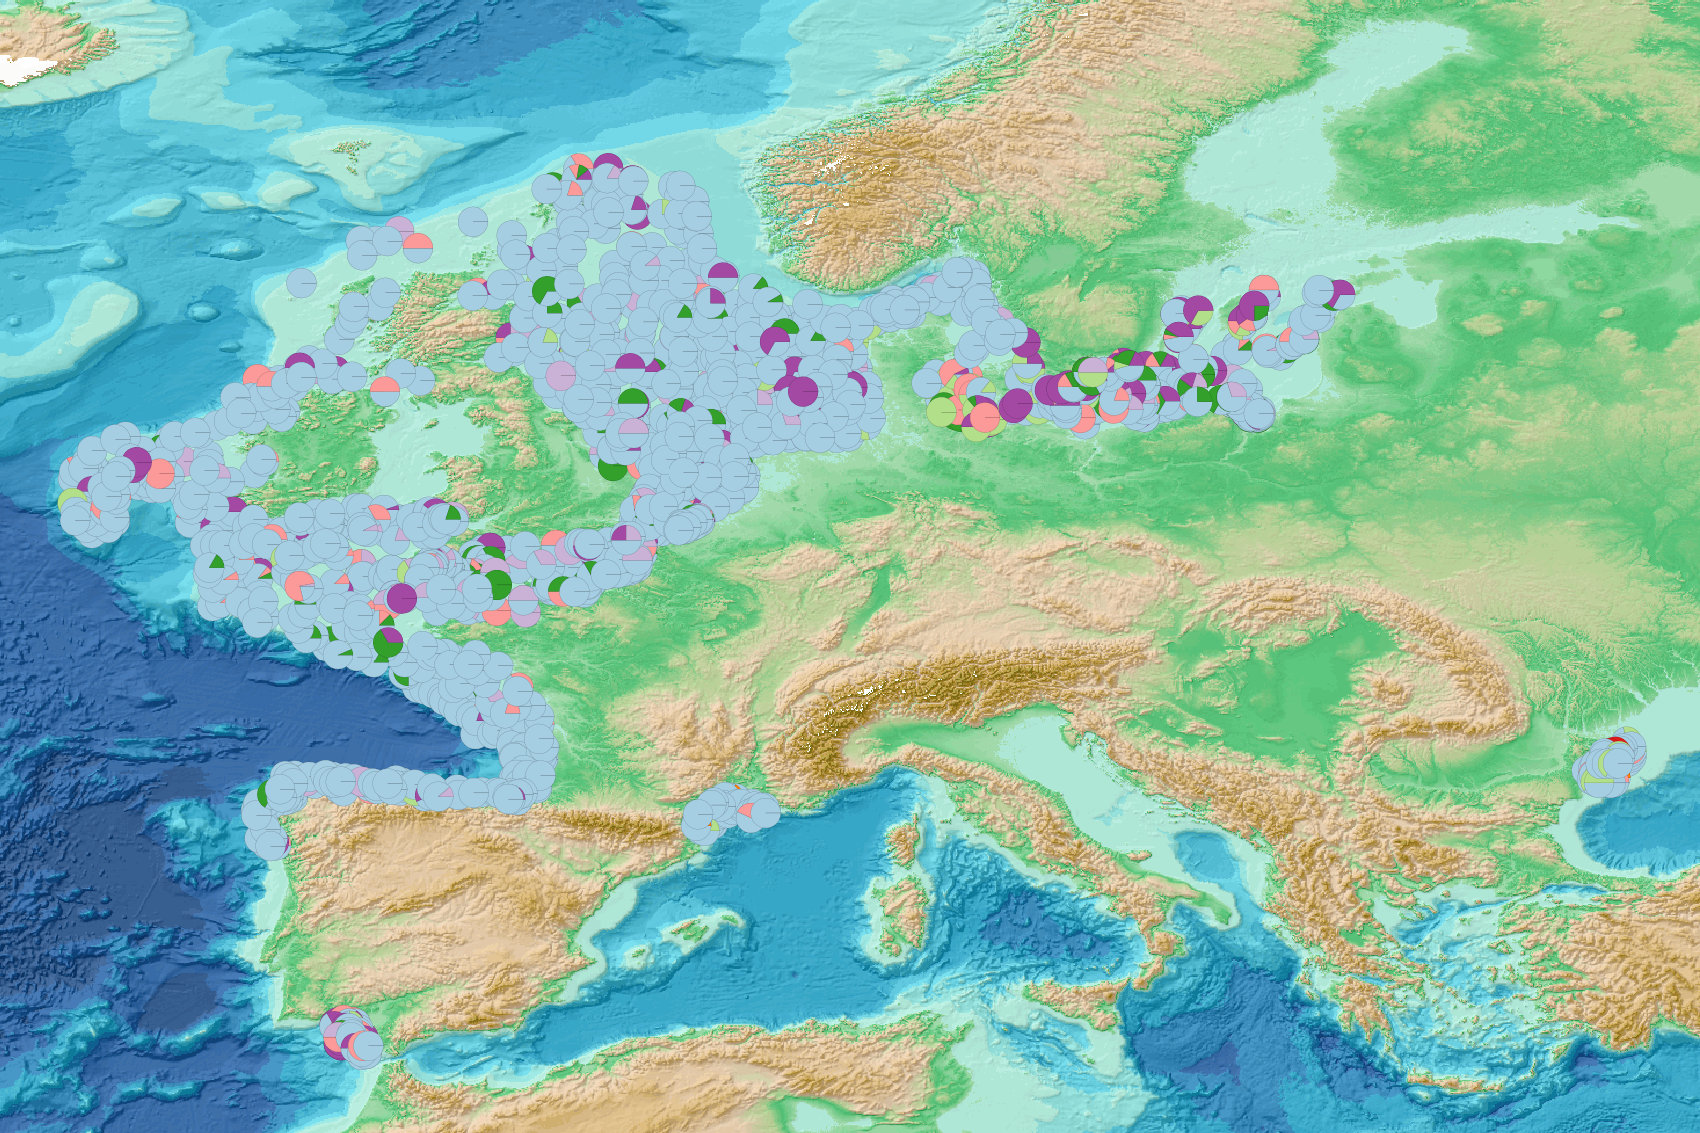
This visualization product displays the marine litter material categories percentage per trawl. EMODnet Chemistry included the collection of marine litter in its 3rd phase. Since the beginning of 2018, data of seafloor litter collected by international fish-trawl surveys have been gathered and processed in the EMODnet Chemistry Marine Litter Database (MLDB). The harmonization of all the data has been the most challenging task considering the heterogeneity of the data sources, sampling protocols (OSPAR and MEDITS protocols) and reference lists used on a European scale. Moreover, within the same protocol, different gear types are deployed during fishing bottom trawl surveys. Unlike other EMODnet seafloor litter products, all trawls surveyed since 2007 are included in this map even if the wingspread and/or the distance are unknown. Only surveys with an unknown number of items were excluded from this product. Harmonization of the material categories between ICES and MEDITS lists has been performed and the following calculation has been applied: Material % = (∑Number of items of each material category*100)/(∑Number of items of all material categories) More information on data processing and calculation are detailed in the document attached. Warning: the absence of data on the map doesn't necessarily mean that they don't exist, but that no information has been entered in the Marine Litter Database for this area.