 Catalogue PIGMA
Indian Ocean
Type of resources
Available actions
Topics
Keywords
Contact for the resource
Provided by
Years
Formats
Representation types
Resolution
-
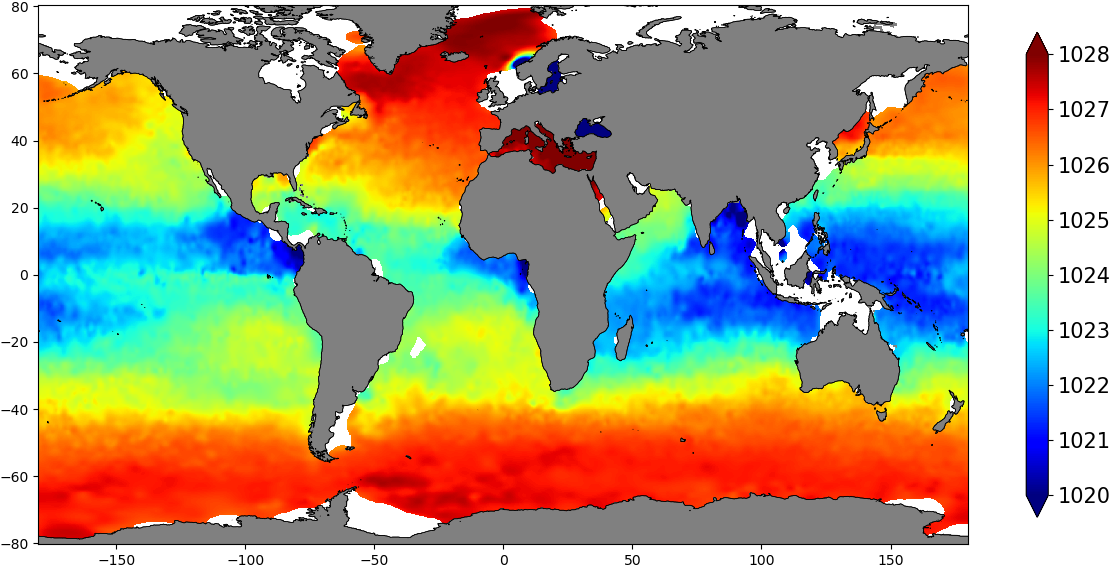
The SDC_GLO_CLIM_Dens product contains global monthly climatological estimates of in situ density using Temperature and Salinity from profiling floats contained in the World Ocean Data 18 (WOD18) database. The profiles were first quality controlled with a Nonlinear Quality control procedure. The climatology considers observations from surface to 2000 m for the time period 2003-2017. Density profiles are computed using UNESCO 1983 (EOS 80) equation from in situ temperature, salinity and pressure measurements by the PFL. Only profiles with both T,S values were used. The gridded fields are computed using DIVAnd (Data Interpolating Variational Analysis) version 2.3.1.
-
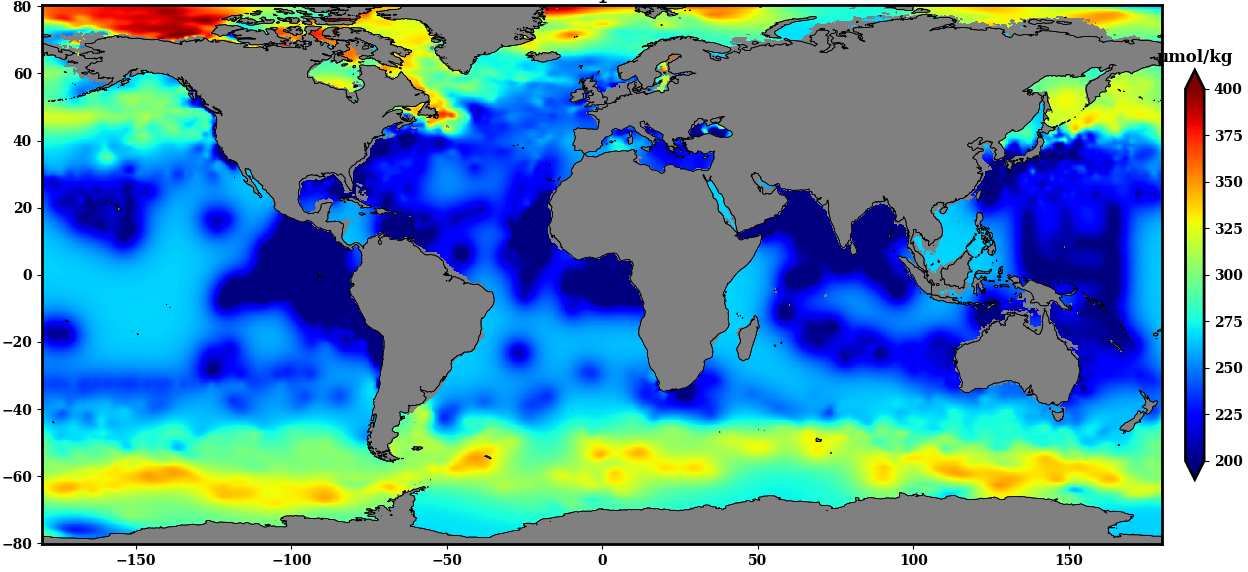
The SDC_GLO_CLIM_O2_AOU product contains two different monthly climatology for dissolved Oxygen and Apparent Oxygen Utilization, SDC_GLO_CLIM_O2 and SDC_GLO_CLIM_AOU respectively from the World Ocean Data (WOD) database. Only basic quality control flags from the WOD are used. The first climatology, SDC_GLO_CLIM_O2, considers Dissolved Oxygen profiles casted together with temperature and salinity from CTD, Profiling Floats (PFL) and Ocean Station Data (OSD) for time duration 2003 to 2017. The second climatology, SDC_GLO_CLIM_AOU, apparent Oxygen utilization, is computed as a difference of dissolved oxygen and saturation O2 profiles. The gridded fields are computed using DIVAnd (Data Interpolating Variational Analysis) version 2.3.1.
-
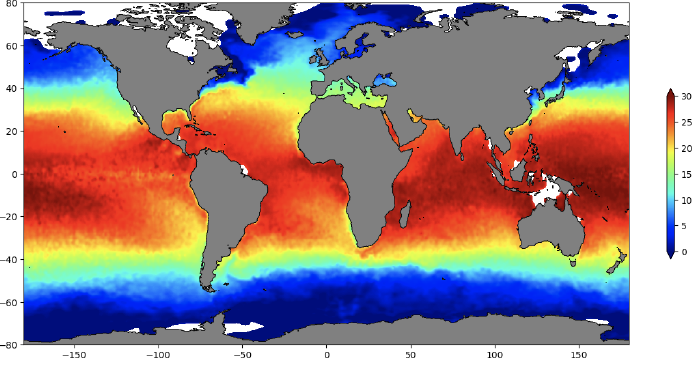
The SDC_GLO_CLIM_TS_V2 product is an improved version of SDC_GLO_CLIM_TS_V1 and contains two different monthly climatologies for temperature and salinity from the World Ocean Data 2018 (WOD-18) database. Along with the basic quality control flags from the WOD-18, an additional quality Control named Nonlinear Quality Control (NQC) is applied. The first climatology, V2_1, considers temperature and salinity profiles from Conductivity Depth Temperature (CTD), Ocean station data (OSD) and Moored buoy data (MRB) along with Profiling Floats (PFL) from 1900 to 2017. The second climatology, V2_2, utilizes only PFL data from 2003 to 2017. V2_1 considers 44 layers from surface to 6000 m while V2_2 only 34 from 0 to 2000 m. The gridded fields are computed using DIVAnd (Data Interpolating Variational Analysis) version 2.3.1. For data access, please register at http://www.marine-id.org/.
-
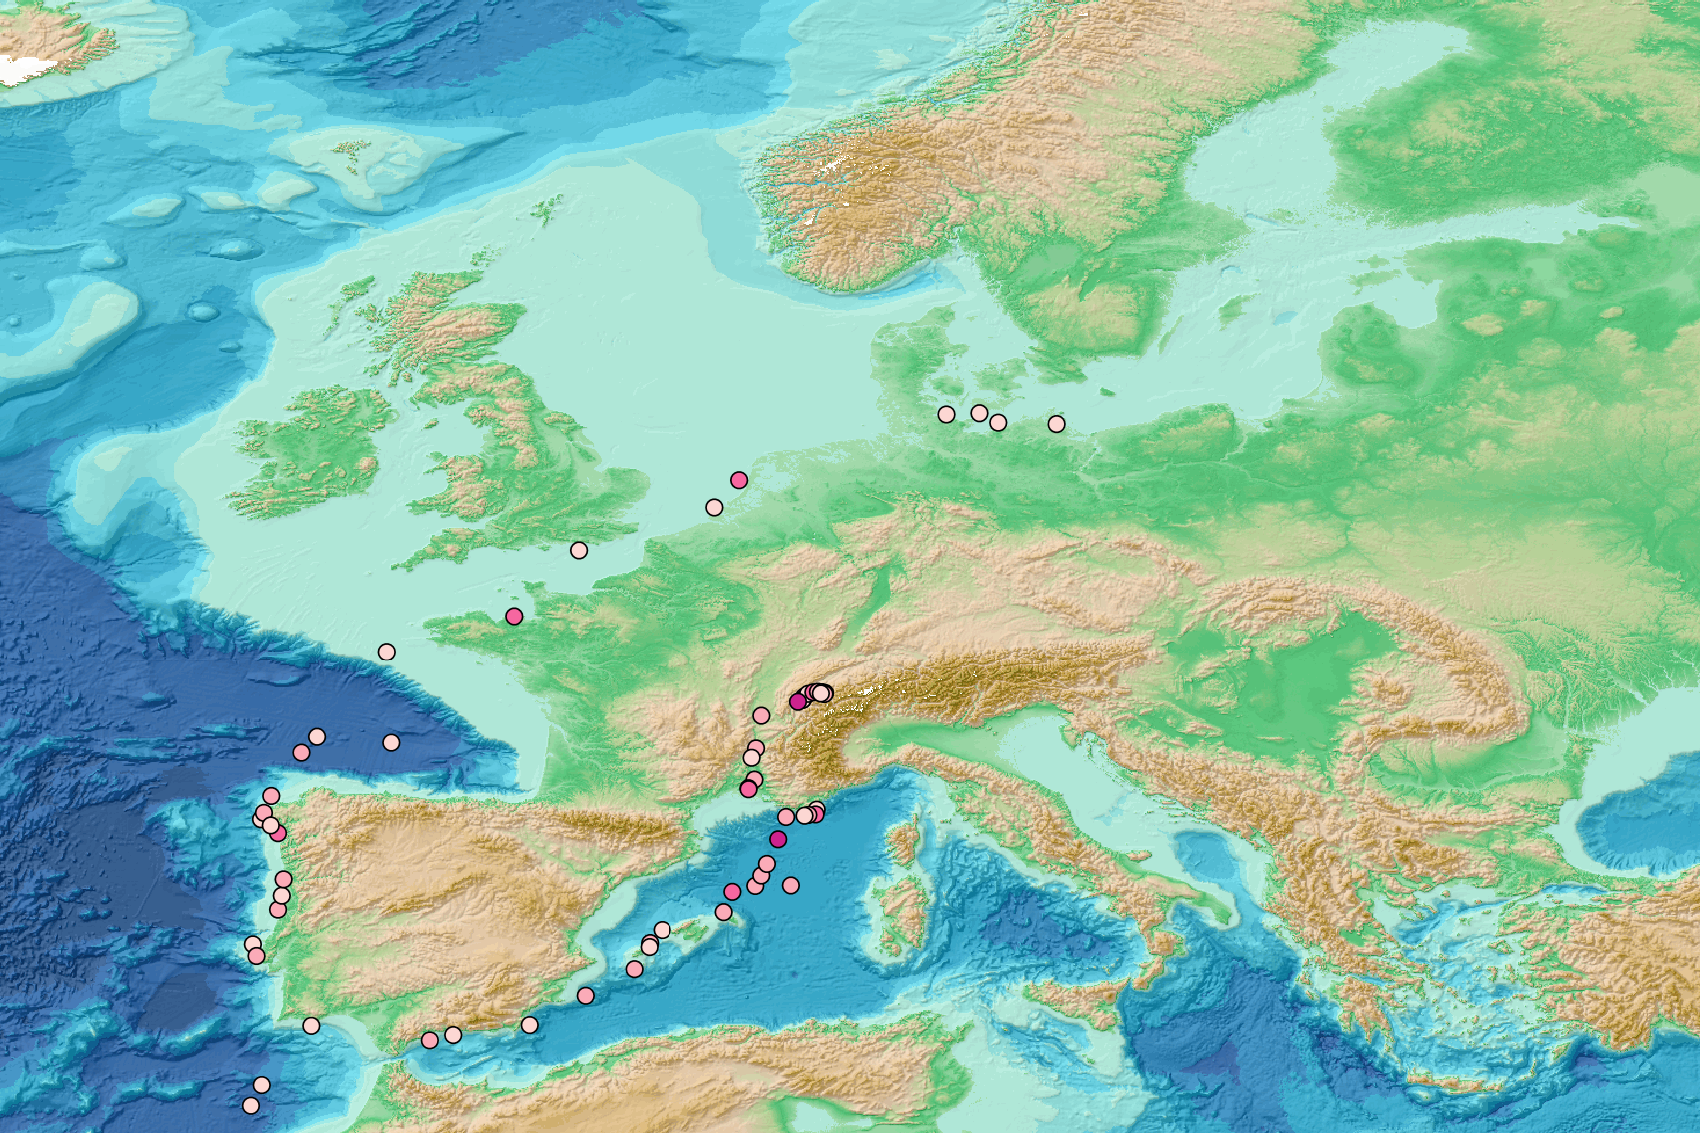
This visualization product displays the density of floating micro-litter per net normalized per km² per year from specific protocols different from research and monitoring protocols. EMODnet Chemistry included the collection of marine litter in its 3rd phase. Before 2021, there was no coordinated effort at the regional or European scale for micro-litter. Given this situation, EMODnet Chemistry proposed to adopt the data gathering and data management approach as generally applied for marine data, i.e., populating metadata and data in the CDI Data Discovery and Access service using dedicated SeaDataNet data transport formats. EMODnet Chemistry is currently the official EU collector of micro-litter data from Marine Strategy Framework Directive (MSFD) National Monitoring activities (descriptor 10). A series of specific standard vocabularies or standard terms related to micro-litter have been added to SeaDataNet NVS (NERC Vocabulary Server) Common Vocabularies to describe the micro-litter. European micro-litter data are collected by the National Oceanographic Data Centres (NODCs). Micro-litter map products are generated from NODCs data after a test of the aggregated collection including data and data format checks and data harmonization. A filter is applied to represent only micro-litter sampled according to a very specific protocol such as the Volvo Ocean Race (VOR) or Oceaneye. Densities were calculated for each net using the following calculation: Density (number of particles per km²) = Micro-litter count / (Sampling effort (km) * Net opening (cm) * 0.00001) When the number of microlitters or the net opening was not filled, the density could not be calculated. Percentiles 50, 75, 95 & 99 have been calculated taking into account data for all years. Warning: the absence of data on the map doesn't necessarily mean that they don't exist, but that no information has been entered in the National Oceanographic Data Centre (NODC) for this area.
-

This visualization product displays the density of floating micro-litter per net normalized per km² per year from specific protocols different from research and monitoring protocols. EMODnet Chemistry included the collection of marine litter in its 3rd phase. Before 2021, there was no coordinated effort at the regional or European scale for micro-litter. Given this situation, EMODnet Chemistry proposed to adopt the data gathering and data management approach as generally applied for marine data, i.e., populating metadata and data in the CDI Data Discovery and Access service using dedicated SeaDataNet data transport formats. EMODnet Chemistry is currently the official EU collector of micro-litter data from Marine Strategy Framework Directive (MSFD) National Monitoring activities (descriptor 10). A series of specific standard vocabularies or standard terms related to micro-litter have been added to SeaDataNet NVS (NERC Vocabulary Server) Common Vocabularies to describe the micro-litter. European micro-litter data are collected by the National Oceanographic Data Centres (NODCs). Micro-litter map products are generated from NODCs data after a test of the aggregated collection including data and data format checks and data harmonization. A filter is applied to represent only micro-litter sampled according to a very specific protocol such as the Volvo Ocean Race (VOR) or Oceaneye. Densities were calculated for each net using the following calculation: Density (number of particles per km²) = Micro-litter count / (Sampling effort (km) * Net opening (cm) * 0.00001) When the number of microlitters or the net opening was not filled, it was not possible to calculate the density. Percentiles 50, 75, 95 & 99 have been calculated taking into account data for all years. Warning: the absence of data on the map does no't necessarily mean that they do not exist, but that no information has been entered in the National Oceanographic Data Centre (NODC) for this area.