 Catalogue PIGMA
Skagerrak
Type of resources
Available actions
Topics
Keywords
Contact for the resource
Provided by
Years
Formats
Representation types
Update frequencies
status
Resolution
-

This visualization product displays the density of floating micro-litter per net normalized per km² per year from specific protocols different from research and monitoring protocols. EMODnet Chemistry included the collection of marine litter in its 3rd phase. Before 2021, there was no coordinated effort at the regional or European scale for micro-litter. Given this situation, EMODnet Chemistry proposed to adopt the data gathering and data management approach as generally applied for marine data, i.e., populating metadata and data in the CDI Data Discovery and Access service using dedicated SeaDataNet data transport formats. EMODnet Chemistry is currently the official EU collector of micro-litter data from Marine Strategy Framework Directive (MSFD) National Monitoring activities (descriptor 10). A series of specific standard vocabularies or standard terms related to micro-litter have been added to SeaDataNet NVS (NERC Vocabulary Server) Common Vocabularies to describe the micro-litter. European micro-litter data are collected by the National Oceanographic Data Centres (NODCs). Micro-litter map products are generated from NODCs data after a test of the aggregated collection including data and data format checks and data harmonization. A filter is applied to represent only micro-litter sampled according to a very specific protocol such as the Volvo Ocean Race (VOR) or Oceaneye. Densities were calculated for each net using the following calculation: Density (number of particles per km²) = Micro-litter count / (Sampling effort (km) * Net opening (cm) * 0.00001) When the number of microlitters or the net opening was not filled, it was not possible to calculate the density. Percentiles 50, 75, 95 & 99 have been calculated taking into account data for all years. Warning: the absence of data on the map does no't necessarily mean that they do not exist, but that no information has been entered in the National Oceanographic Data Centre (NODC) for this area.
-
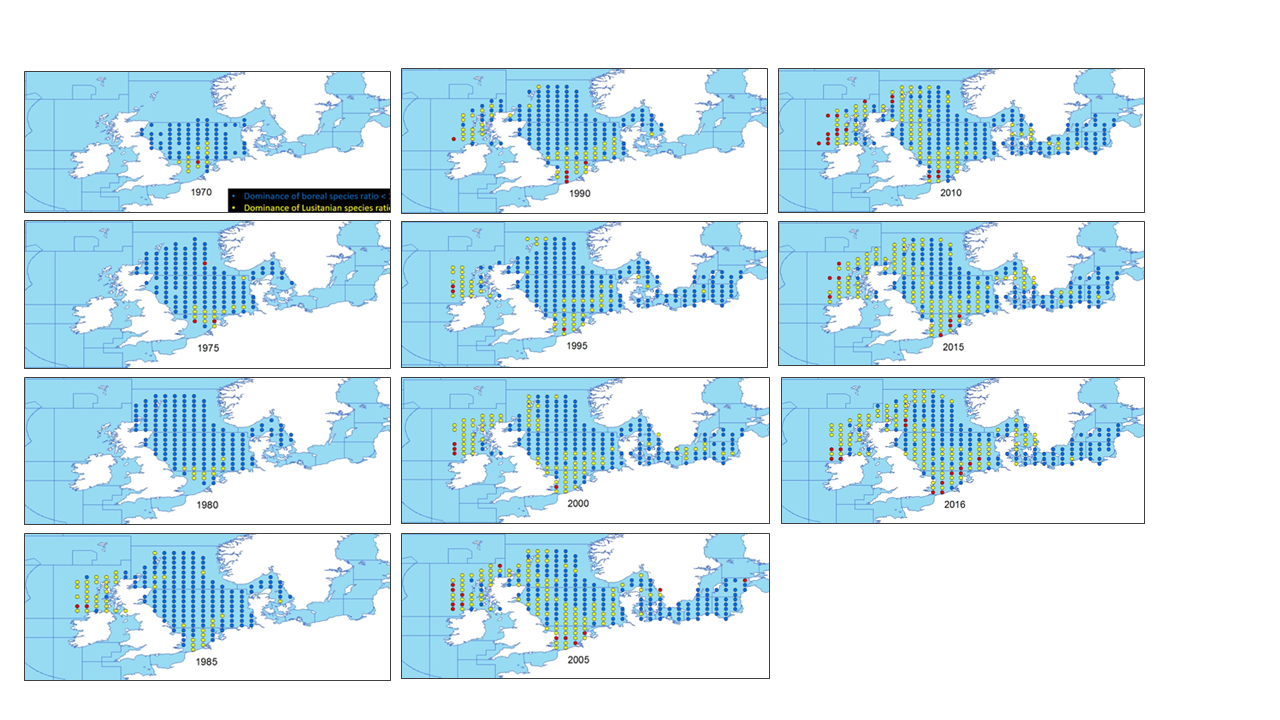
This metadata describes the ICES data on the temporal development of the Lusitanian/Boreal species ratio in the period from 19657 to 2016. Key message: The ratio between the number of Lusitanian (warm-favouring) and Boreal (cool-favouring) species are significantly increasing in several North-East Atlantic marine areas whereas there is no significant changes in all the southern areas. Changes in ratios are most apparent in the North Sea, Irish Sea and West of Scotland. Furthermore, it seems that Lusitanian species have not spread in all northward directions, but have followed two particular routes, through the English Channel and north around Scotland Blue dots indicates L/B ratios below 1 (dominance of Boreal species) Yellow dots indicates L/B ratios >=1 and <2 (dominance of Lusitanian species) Red dots indicates L/B ratios >=2 (high dominance of Lusitanian species) The dataset is derived from the ICES data portal 'DATRAS' (the Database of Trawl Surveys). DATRAS is an online database of trawl surveys with access to standard data products. DATRAS stores data collected primarily from bottom trawl fish surveys coordinated by ICES expert groups. The survey data are covering the Baltic Sea, Skagerrak, Kattegat, North Sea, English Channel, Celtic Sea, Irish Sea, Bay of Biscay and the eastern Atlantic from the Shetlands to Gibraltar. At present, there are more than 56 years of continuous time series data in DATRAS, and survey data are continuously updated by national institutions. The dataset has been used in the EEA Indicator "Changes in fish distribution in European seas" https://www.eea.europa.eu/data-and-maps/indicators/fish-distribution-shifts/assessment-1. The dataset has been used for this static map: https://www.eea.europa.eu/en/analysis/indicators/changes-in-fish-distribution-in/temporal-development-of-the-ratio
-
This visualization product displays the density of floating micro-litter per net normalized per km² per year from specific protocols different from research and monitoring protocols. EMODnet Chemistry included the collection of marine litter in its 3rd phase. Before 2021, there was no coordinated effort at the regional or European scale for micro-litter. Given this situation, EMODnet Chemistry proposed to adopt the data gathering and data management approach as generally applied for marine data, i.e., populating metadata and data in the CDI Data Discovery and Access service using dedicated SeaDataNet data transport formats. EMODnet Chemistry is currently the official EU collector of micro-litter data from Marine Strategy Framework Directive (MSFD) National Monitoring activities (descriptor 10). A series of specific standard vocabularies or standard terms related to micro-litter have been added to SeaDataNet NVS (NERC Vocabulary Server) Common Vocabularies to describe the micro-litter. European micro-litter data are collected by the National Oceanographic Data Centres (NODCs). Micro-litter map products are generated from NODCs data after a test of the aggregated collection including data and data format checks and data harmonization. A filter is applied to represent only micro-litter sampled according to a very specific protocol such as the Volvo Ocean Race (VOR) or Oceaneye. Densities were calculated for each net using the following calculation: Density (number of particles per km²) = Micro-litter count / (Sampling effort (km) * Net opening (cm) * 0.00001) When the number of microlitters or the net opening was not filled, the density could not be calculated. Percentiles 50, 75, 95 & 99 have been calculated taking into account data for all years. Warning: the absence of data on the map doesn't necessarily mean that they don't exist, but that no information has been entered in the National Oceanographic Data Centre (NODC) for this area.