 Catalogue PIGMA
MARBEC, Univ Montpellier, CNRS, Ifremer, IRD, Montpellier, France
Type of resources
Available actions
Topics
Keywords
Contact for the resource
Provided by
Years
Formats
Representation types
-
Données de Metabarcoding de phytoplancton marin (18s), taxon bactérien et archés (16s) pour la caractérisation de la diversité marine à partir d'ADN extraits sur filtres (eau de mer ou d'étangs filtrés sur 0,22um ou 3um) selon conditions variables de lumière et de température
-

Plankton was imaged with the PlanktoScope in different oceanic regions using different nets and protocol of conservation. This dataset aims to serve as reference for taxonomic identification with the PlanktoScope across 256 plankton taxa from 20µm to 300µm. Reference dataset can also serve as learning set for prediction in Ecotaxa (https://ecotaxa.obs-vlfr.fr/prj/15535). The full images were processed and segmented with the PlanktoScope around each individual. A set of associated features were measured on the objects with skimage.measure. All objects were classified into 256 different classes using the web application EcoTaxa (http://ecotaxa.obs-vlfr.fr). The following dataset corresponds to the 169, 149 objects and their calculated features. The different files provide information about the features of the objects, their taxonomic identification as well as the raw images. taxa.csv.gz Table of the classification of each object in the dataset, with columns: - object_id: unique object identifier in EcoTaxa. - annotation_category: taxonomic name corresponding to the last level of hierarchy - annotation_hierarchy: taxonomic lineage to the category - set: class of the image corresponding to the taxon - img_file_name: local path of the image corresponding to the taxon, named according to the object id features_native.csv.gz Table of morphological features computed by PlanktoScope. All features are computed on the object only, not the background. All area/length measures are in pixels. - object_id: unique object identifier in Ecotaxa And 33 features: - width: width of the smallest rectangle enclosing the object (pixel) - height: height of the smallest rectangle enclosing the object (pixel) - bx: X coordinates of the top left point of the smallest rectangle enclosing the object (pixel) - by: Y coordinates of the top left point of the smallest rectangle enclosing the object (pixel) - circ.: circularity of the object ((4∗π ∗Area)/Perim^2) [0-1] - area_exc: Surface area of the object excluding holes (pixel2) - area: Surface area of the object (pixel2) - %area: Percentage of object’s surface area that is comprised of holes - major: Length of the primary axis of the best fitting ellipse for the object (pixel) - minor: Length of the secondary axis of the best fitting ellipse for the object (pixel) - y: Y position of the center of gravity of the object (pixel) - x: X position of the center of gravity of the object (pixel) - convex_area: The area of the smallest polygon within which all points in the object fit (pixel2) - perim.: The length of the outside boundary of the object (pixel) - elongation: elongation index (major/minor) - perimareaexc: index of the relative complexity of the perimeter (perim/area_exc) - perimmajor: Index of the relative complexity of the perimeter (perim/major) - circex: Circularity of object excluding white pixels ((4 ∗ π ∗ Area_exc)/perim 2) - angle: Angle between the primary axis and a line parallel to the x-axis of the image - bounding_box_area: Area of the smallest box containing the object (pixel2) - eccentricity: Eccentricity of the ellipse that has the same second-moments as the region. Ratio of the focal distance of the ellipse over the major axis length [0-1] - equivalent_diameter: The diameter of a circle with the same area as the object (pixel) - euler_number: Euler characteristic of the set of non-zero pixels. Computed as number of connected components subtracted by number of holes - extent: Ratio of pixels in the object to pixels in the total bounding box - local_centroid_col: Horizontal coordinate of the center of mass of the object (pixel) - local_centroid_row: Vertical coordinate of the center of mass of the object (pixel) - solidity: Ratio of pixels in the object to pixels of the convex hull image (area / convex_area) - meanhue: Mean base color of the object in hue scale (0-360) - meansaturation: Mean saturation of the object [0-100] - meanvalue: Mean brightness of the object [0-100] - stdhue: Standard deviation of base color - stdsaturation: Standard deviation of saturation - stdvalue: Standard deviation of brightness inventory.tsv Tree view of the taxonomy and number of images in each taxon, displayed as text. With columns : - annotation_hierarchy: taxonomic lineage - annotation_category: name of the taxon - n: number of objects in each taxon group map.png Map of the sampling locations, to give an idea of the diversity sampled in this dataset. imgs Directory containing images of each object, named according to the object id object_id and sorted in subdirectories according to their taxon.
-
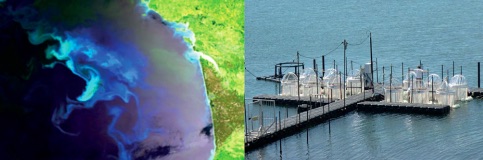
An observation network was initiated in 2021 in the framework of the CocoriCO2 project to monitore carbonate parameters along the French coastal systems. Six sites were selected along the French Atlantic and Mediterranean coastlines based on their importance in terms of shellfish production and the presence of high- and low-frequency monitoring activities. At each site, autonomous pH sensors were deployed both inside and outside shellfish production areas, next to high-frequency CTD (conductivity-temperature-depth) probes operated through two operating monitoring networks (SNO COAST-HF and Ifremer ECOSCOPA). pH sensors were set to an acquisition rate of 15 min and discrete seawater samples were collected biweekly in order to control the quality of pH data (laboratory spectrophotometric measurements) as well as to measure total alkalinity and dissolved inorganic carbon concentrations for full characterization of the carbonate system. While this network has been up and running for more than two years, the acquired dataset has already revealed important differences in terms of pH variations between monitored sites related to the influence of diverse processes (freshwater inputs, tides, temperature, biological processes).