 Catalogue PIGMA
2024
Type of resources
Available actions
Topics
Keywords
Contact for the resource
Provided by
Years
Formats
Representation types
Update frequencies
status
Scale
Resolution
-
Water_body_chlorophyll-a - Monthly Climatology for the European Seas for the period 1960-2023 on the domain from longitude -45.0 to 70.0 degrees East and latitude 24.0 to 83.0 degrees North. Data Sources: observational data from SeaDataNet/EMODnet Chemistry Data Network. Description of DIVA analysis: The computation was done with the DIVAnd (Data-Interpolating Variational Analysis in n dimensions), version 2.7.12, using GEBCO 30sec topography for the spatial connectivity of water masses. Horizontal correlation length and vertical correlation length vary spatially depending on the topography and domain. Depth range: 0.0, 5.0, 10.0, 15.0, 20.0, 25.0, 30.0, 35.0, 40.0, 45.0, 50.0, 55.0, 60.0, 65.0, 70.0, 75.0, 80.0, 85.0, 90.0, 95.0, 100.0, 125.0, 150.0, 175.0, 200.0, 225.0, 250.0, 275.0, 300.0, 325.0, 350.0, 375.0, 400.0, 425.0, 450.0, 475.0, 500.0, 550.0, 600.0, 650.0, 700.0, 750.0, 800.0, 850.0, 900.0, 950.0, 1000.0, 1050.0, 1100.0, 1150.0, 1200.0, 1250.0, 1300.0, 1350.0, 1400.0, 1450.0, 1500.0, 1550.0, 1600.0, 1650.0, 1700.0, 1750.0, 1800.0, 1850.0, 1900.0, 1950.0, 2000.0, 2100.0, 2200.0, 2300.0, 2400.0, 2500.0, 2600.0, 2700.0, 2800.0, 2900.0, 3000.0, 3100.0, 3200.0, 3300.0, 3400.0, 3500.0, 3600.0, 3700.0, 3800.0, 3900.0, 4000.0, 4100.0, 4200.0, 4300.0, 4400.0, 4500.0, 4600.0, 4700.0, 4800.0, 4900.0, 5000.0, 5100.0, 5200.0, 5300.0, 5400.0, 5500.0 m. Units: mg/m3. The horizontal resolution of the produced DIVAnd analysis is 0.25 degrees.
-
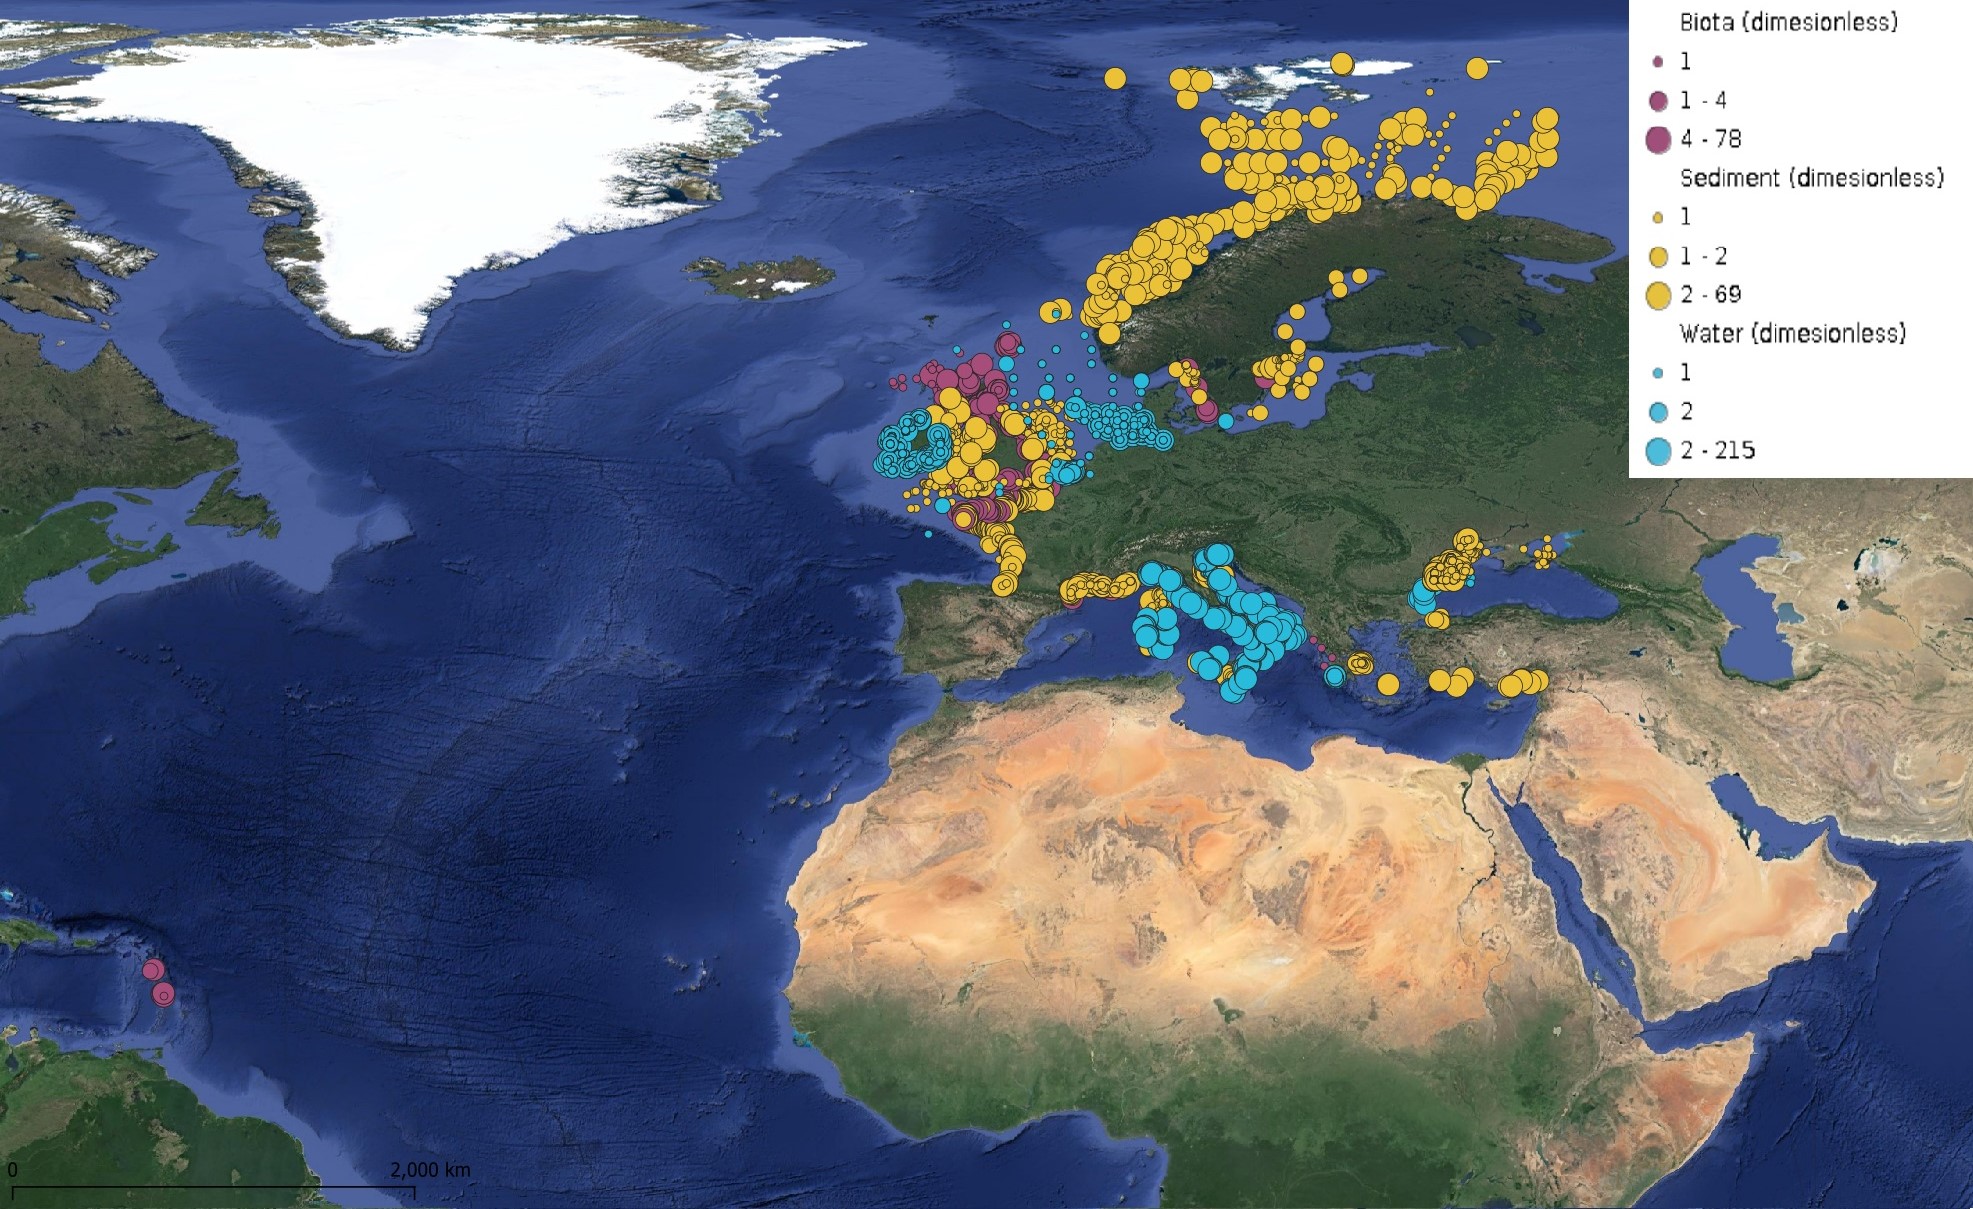
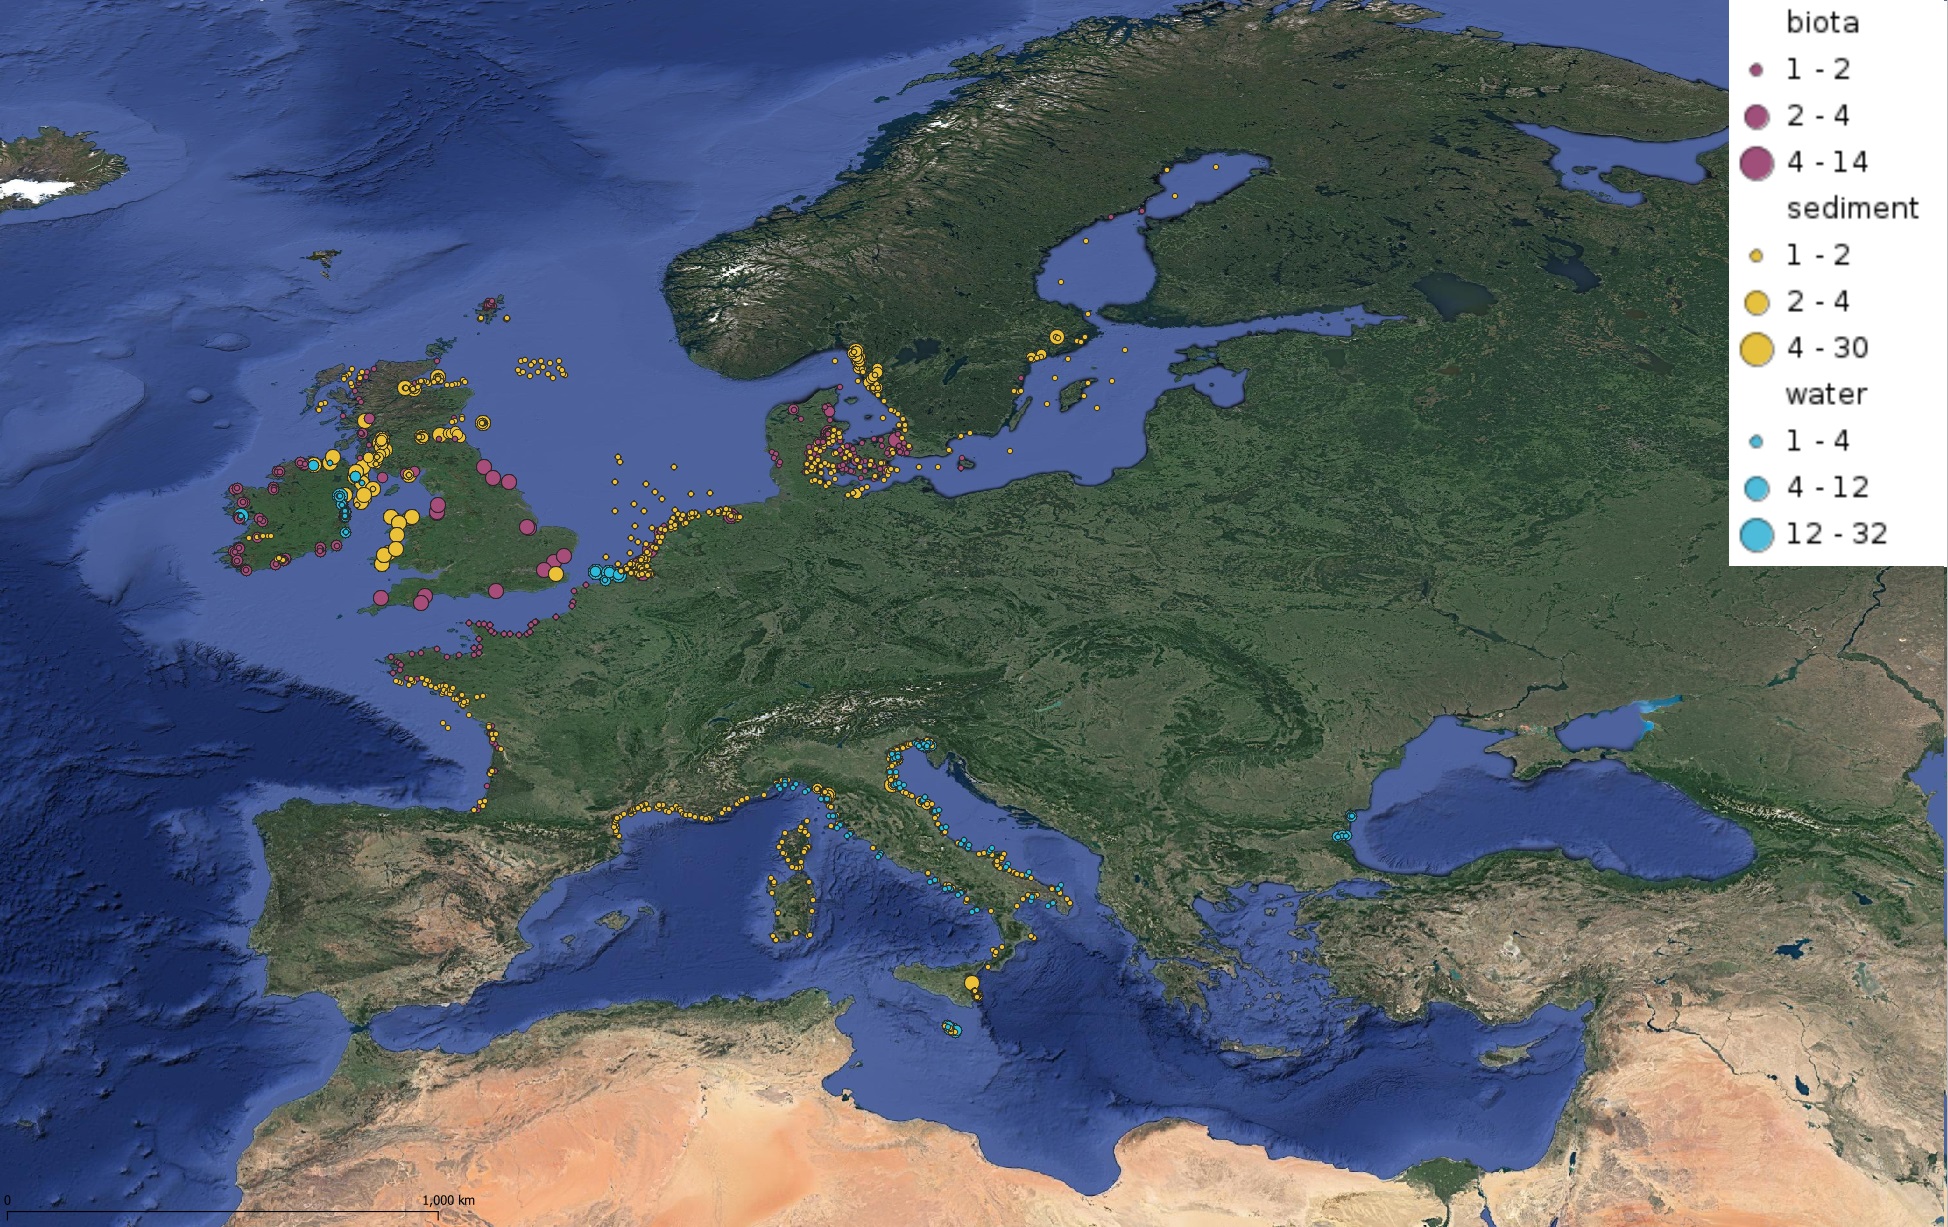
This product displays for Naphthalene, positions with values counts that have been measured per matrix and are present in EMODnet regional contaminants aggregated datasets, v2024. The product displays positions for all available years.
-
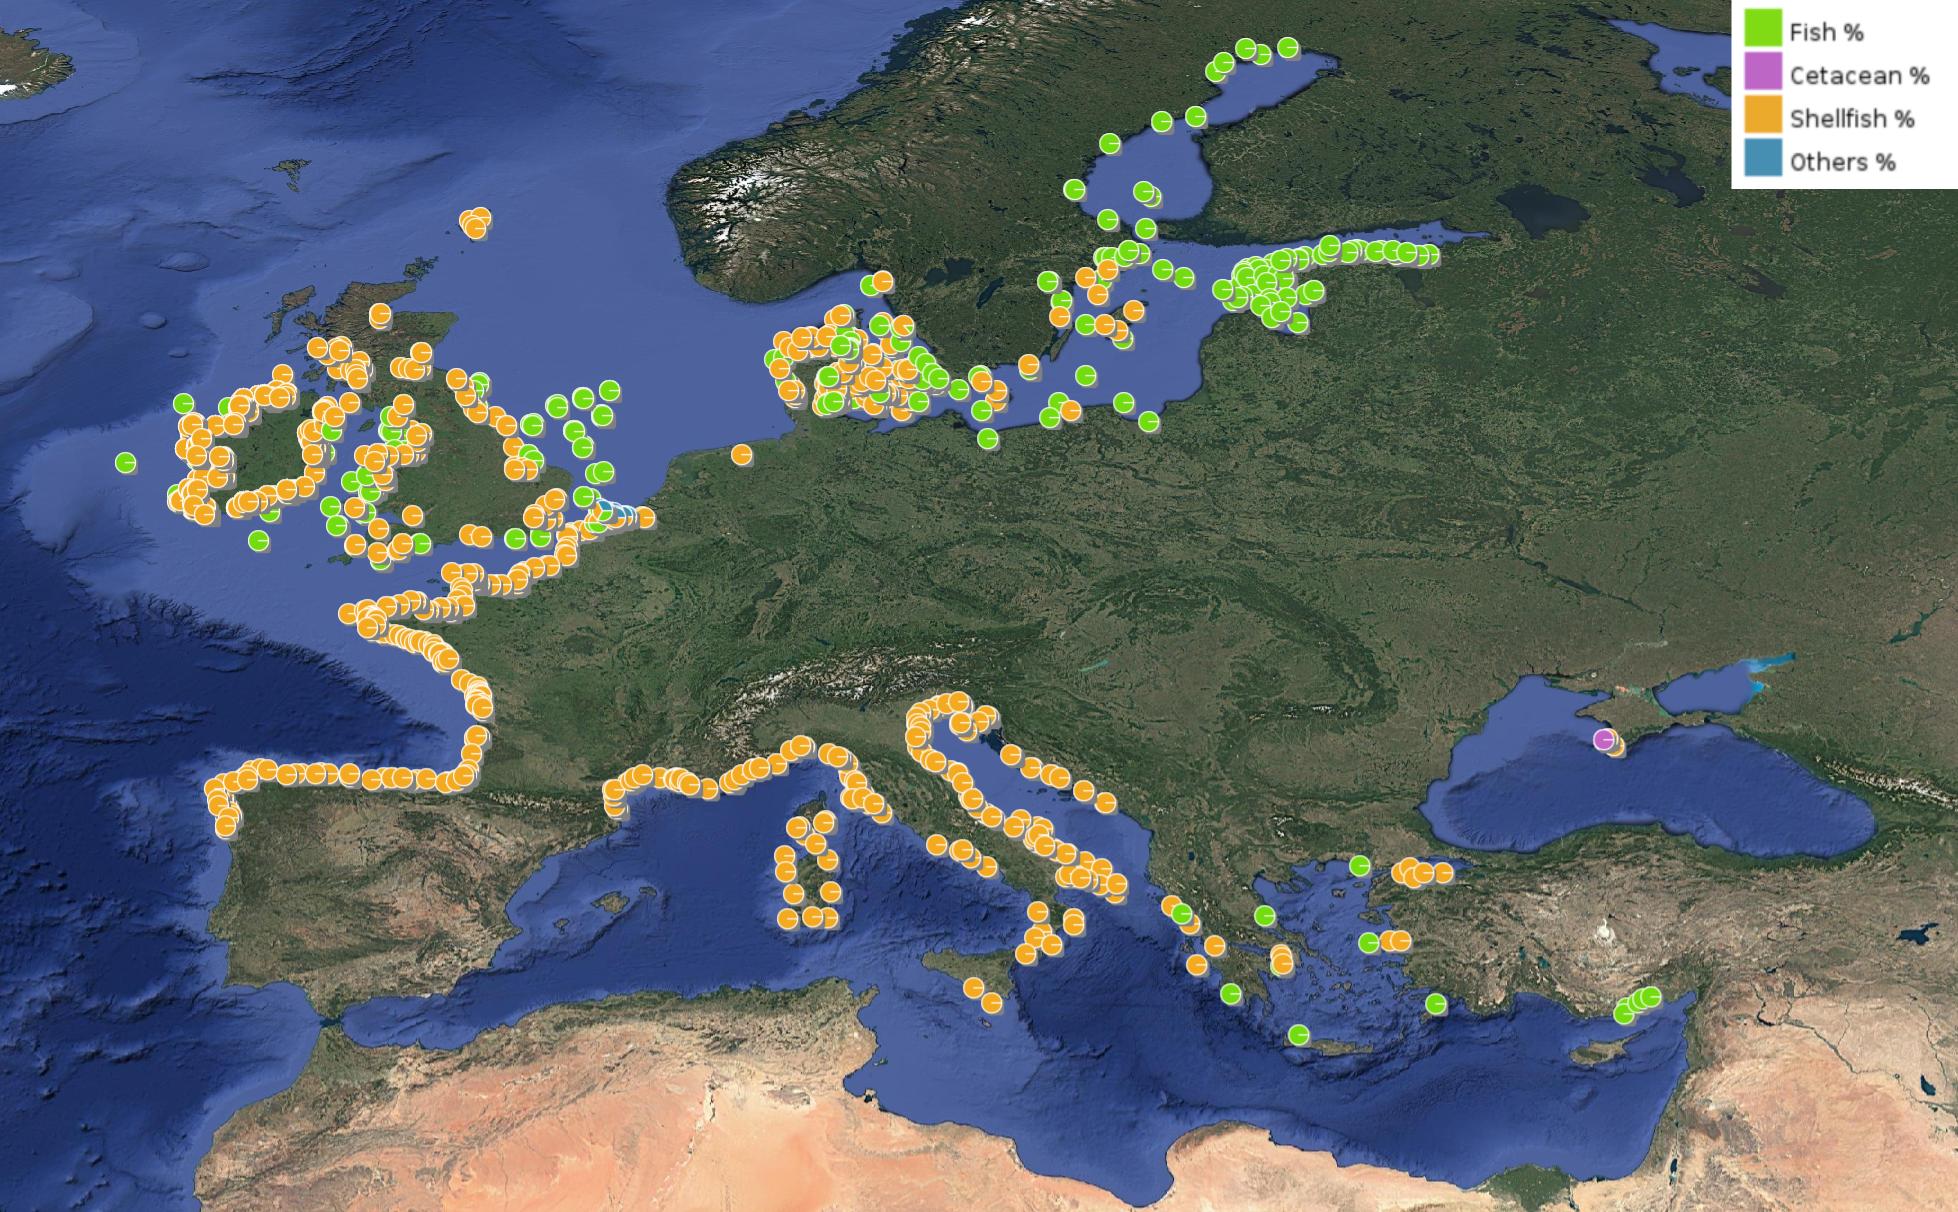
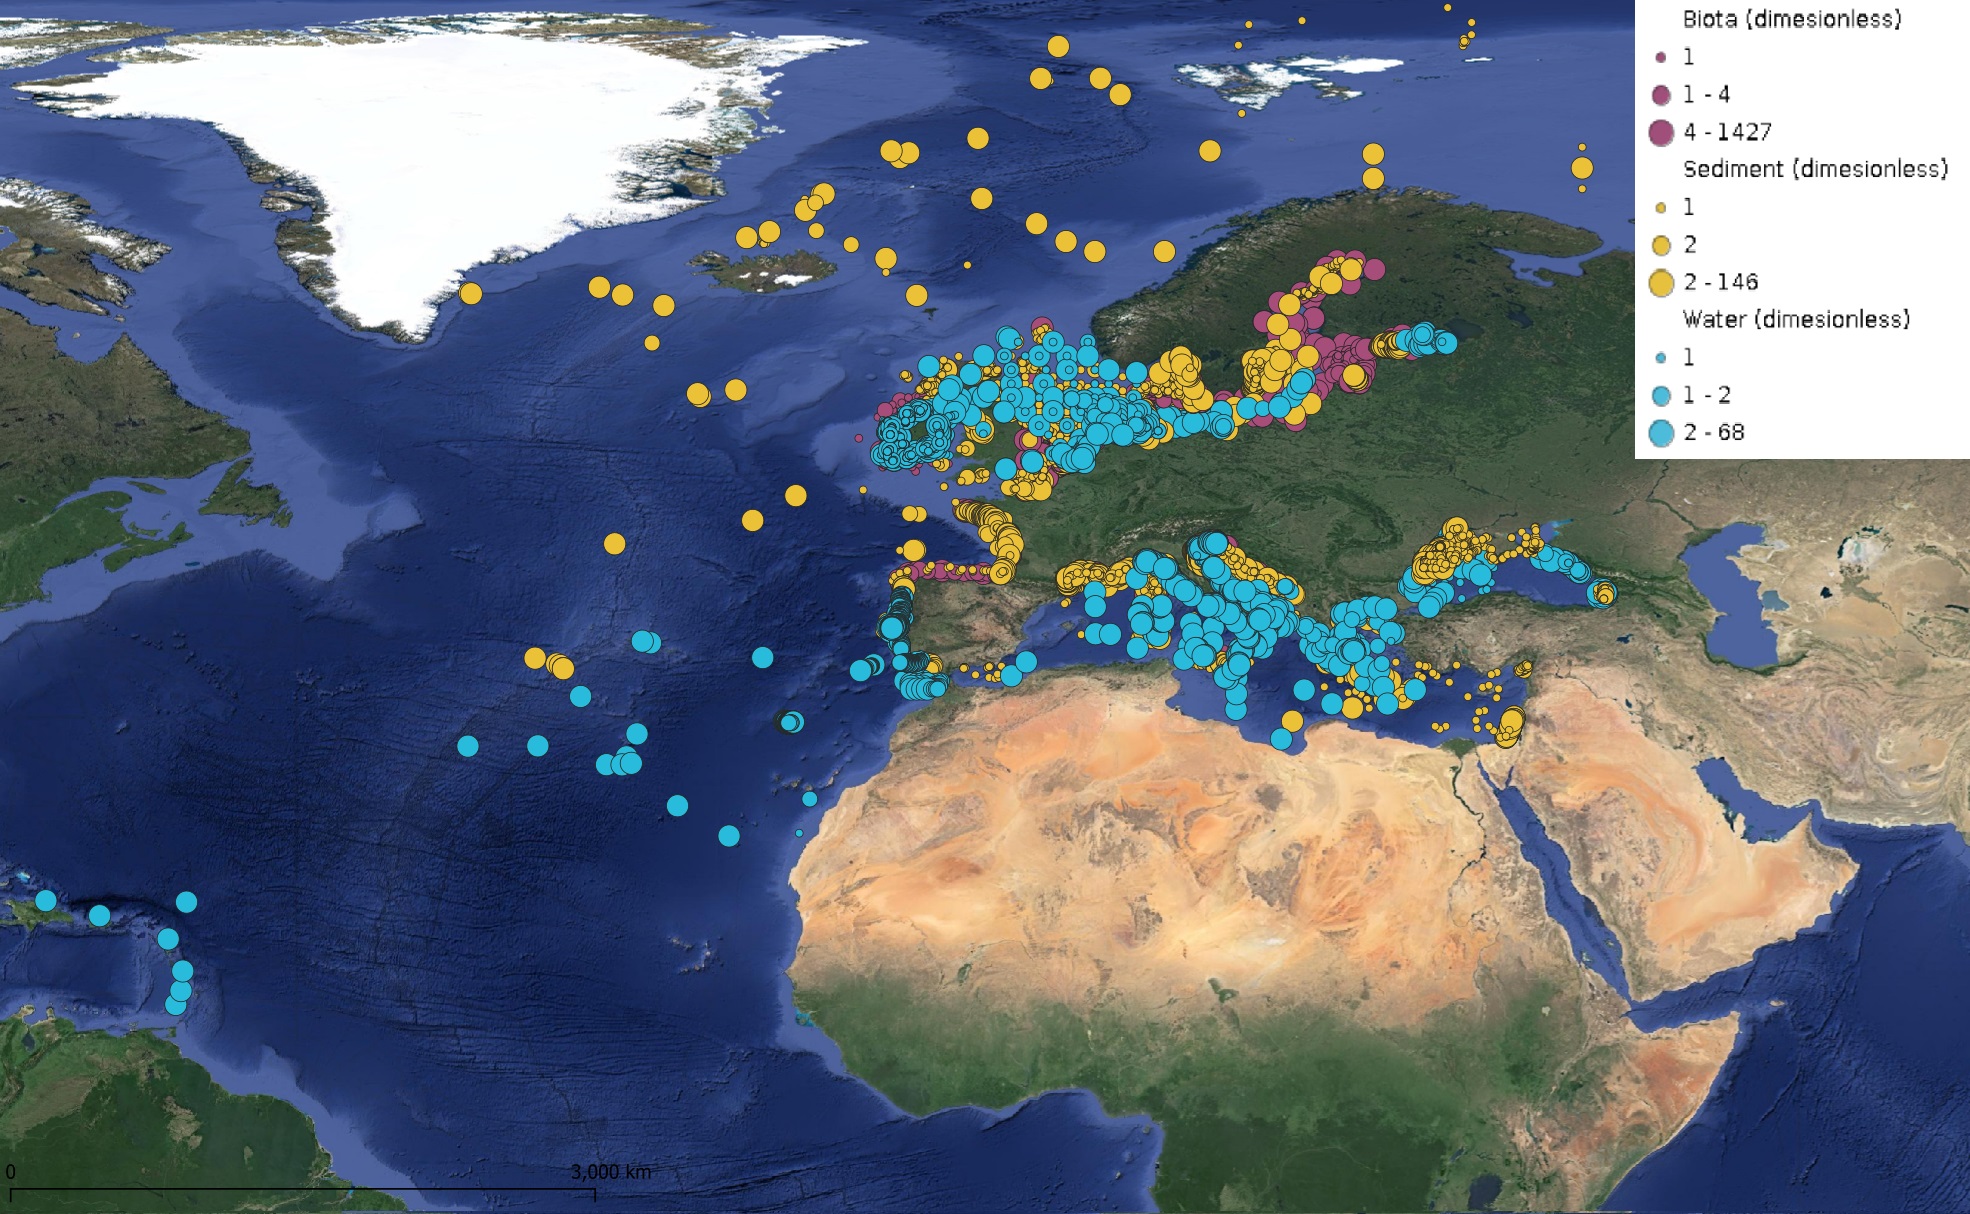
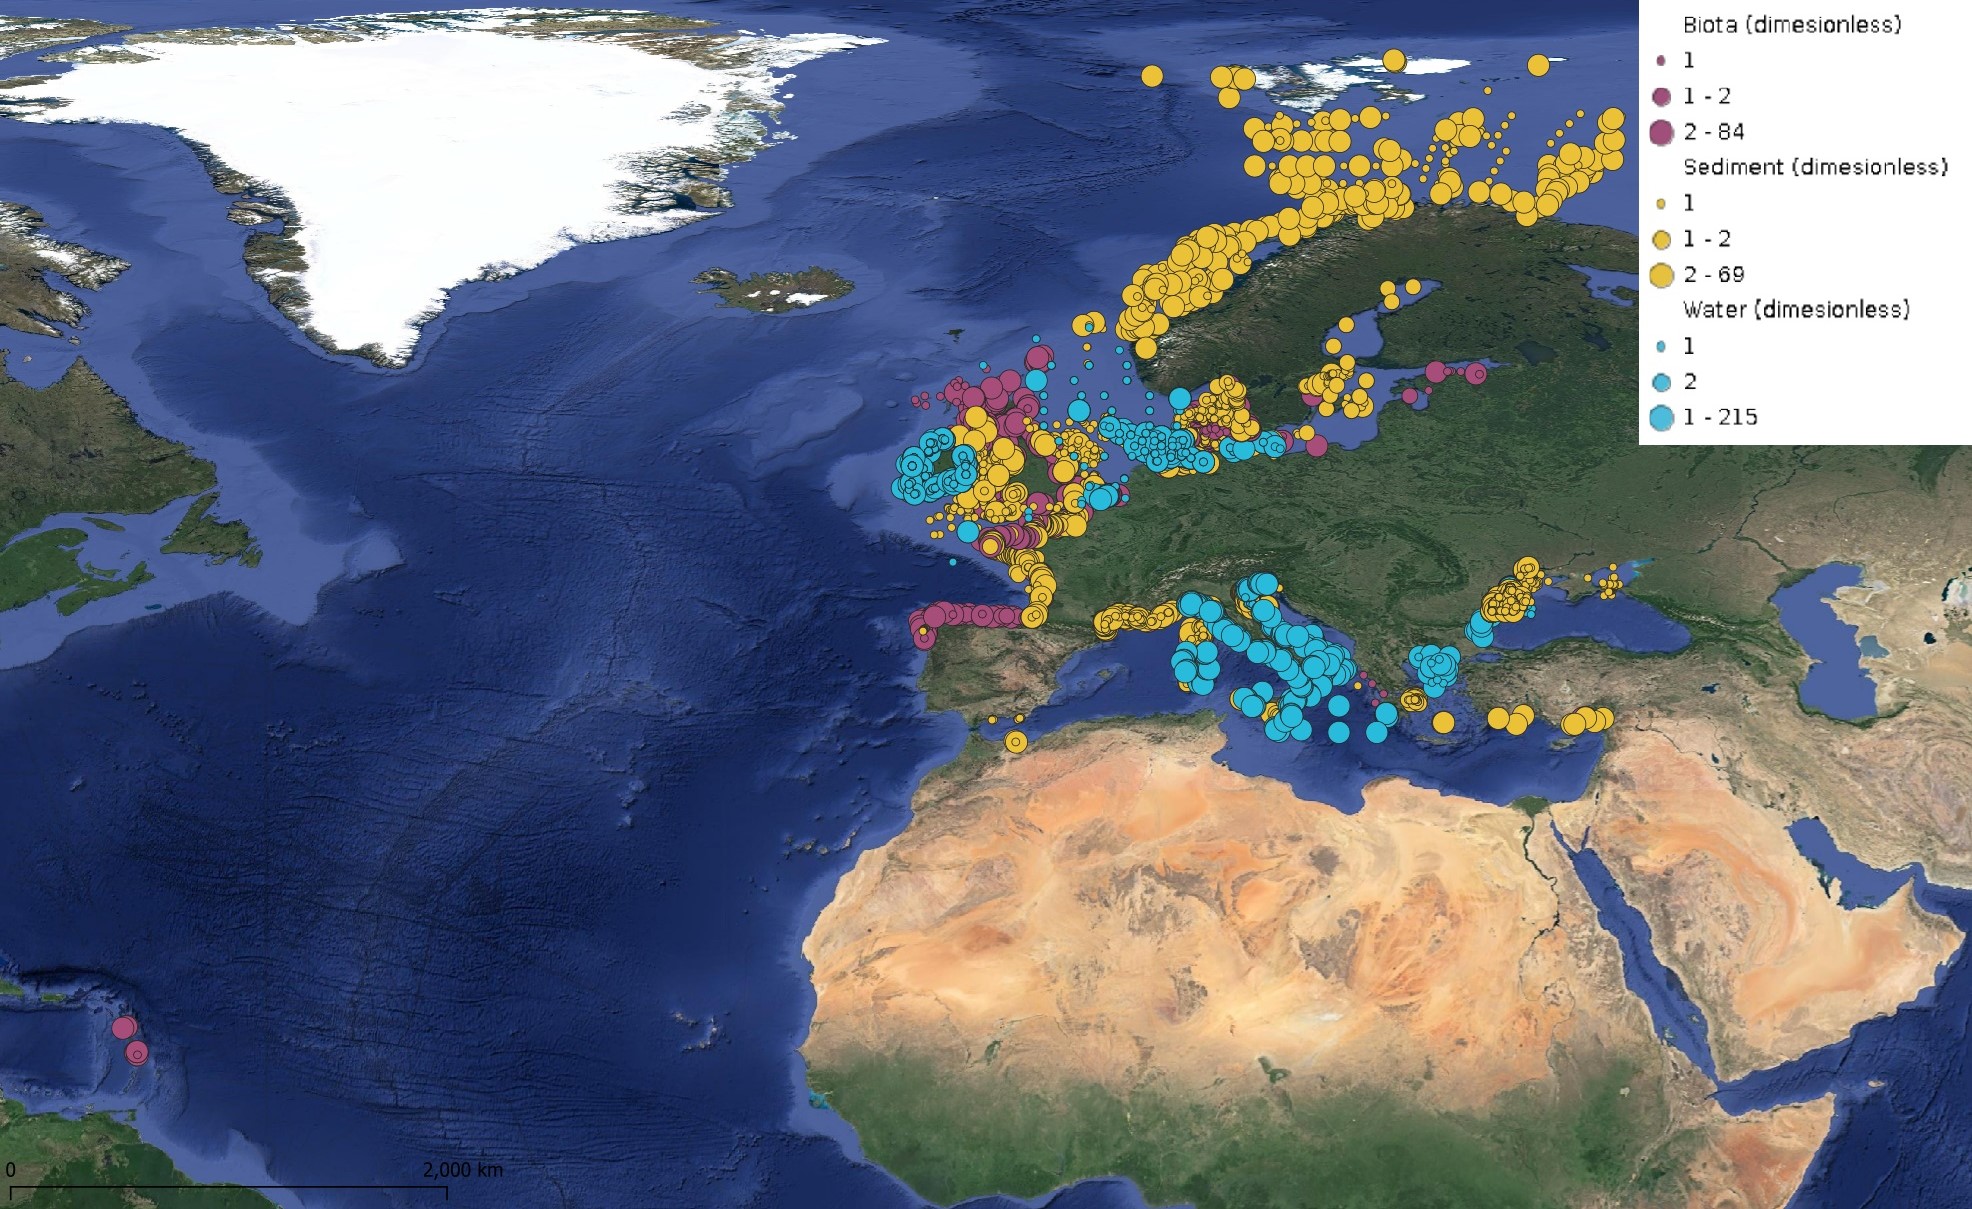
This product displays for DDT, DDE, and DDD, positions with percentages of all available data values per group of animals that are present in EMODnet regional contaminants aggregated datasets, v2024. The product displays positions for all available years.
-
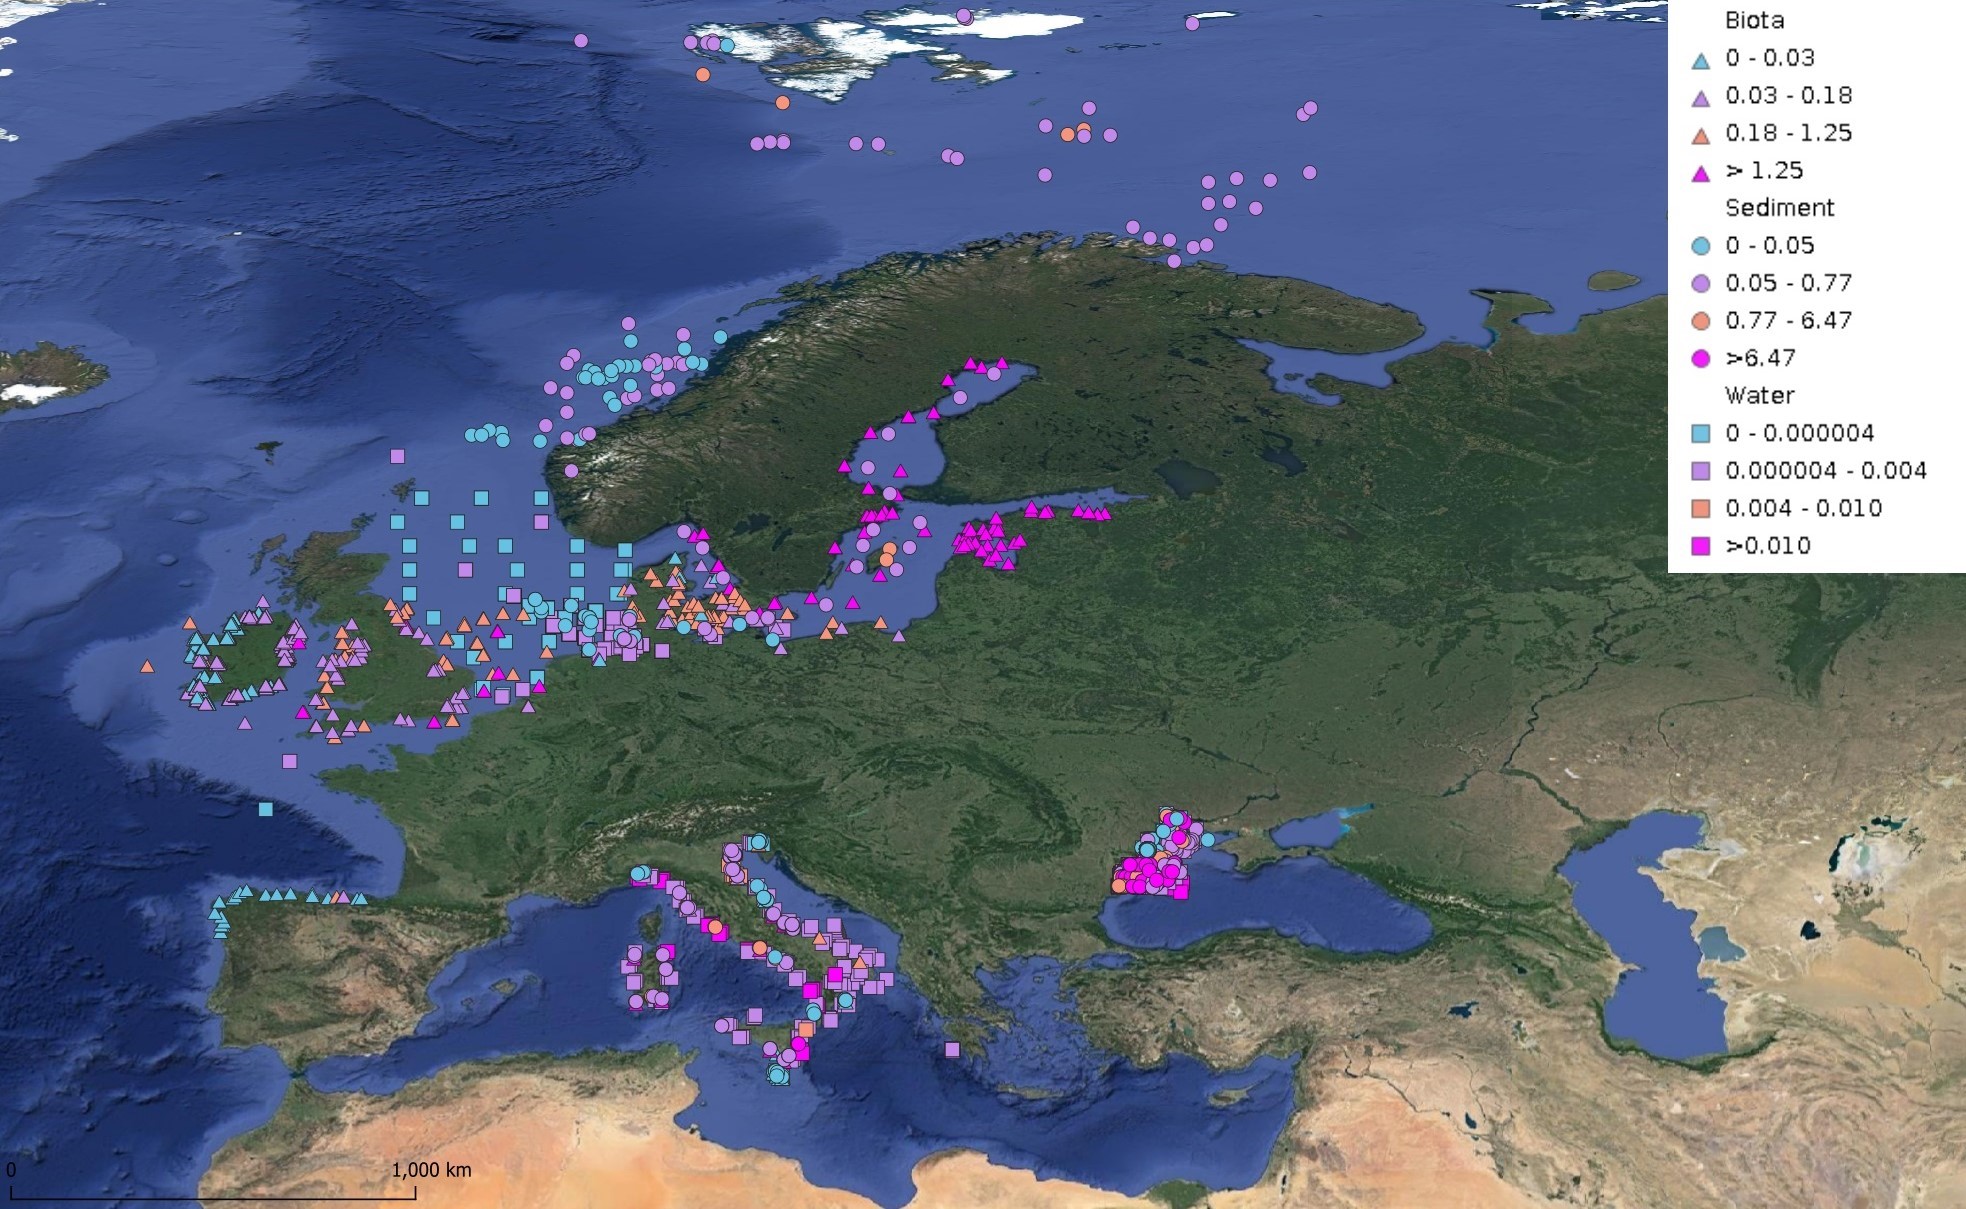
This product displays for Hexachlorobenzene, median values since 2012 that have been measured per matrix and are present in EMODnet regional contaminants aggregated datasets, v2024. The median values ranges are derived from the following percentiles: 0-25%, 25-75%, 75-90%, >90%. Only "good data" are used, namely data with Quality Flag=1, 2, 6, Q (SeaDataNet Quality Flag schema). For water, only surface values are used (0-15 m), for sediment and biota data at all depths are used.
-
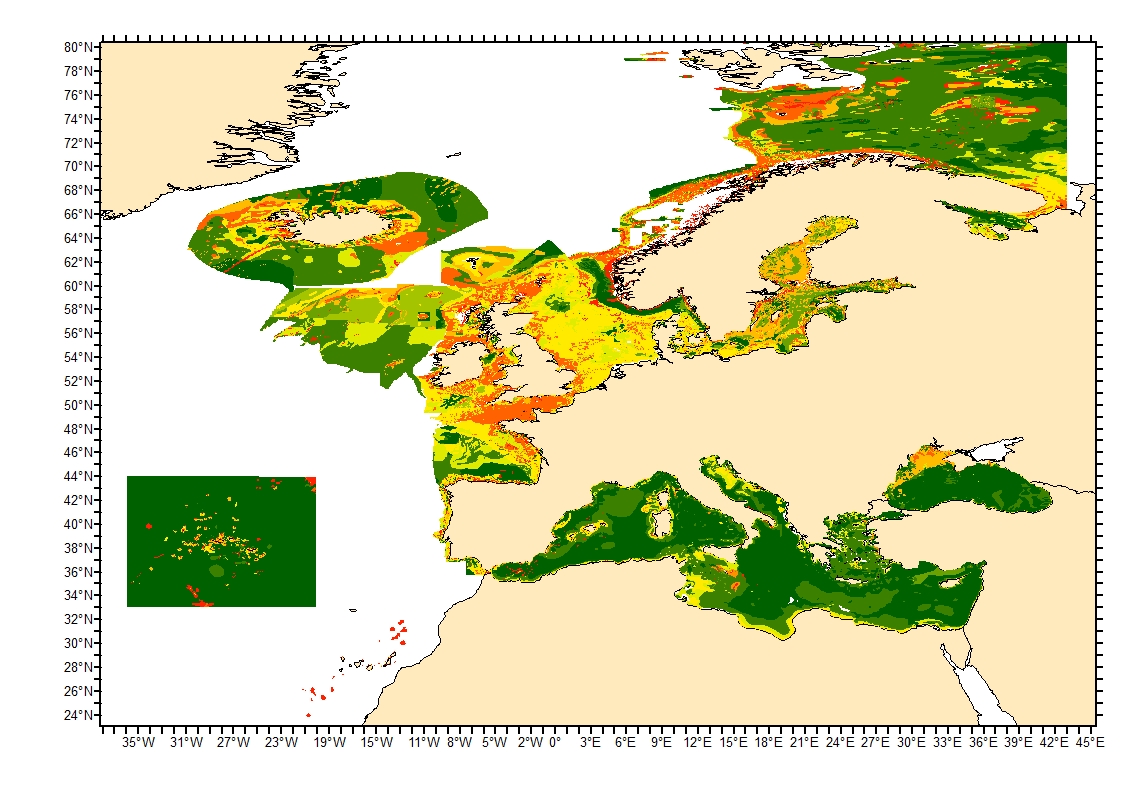
Sediment average grain size in the European North-East Atlantic and Mediterranean waters was generated from Euseamap 2023 sediment categories. This rough granulometry estimate may be used for habitat models at meso- and large scale.
-

Coastal Surveillance Through Observation of Ocean Color (COASTlOOC) oceanographic expeditions were conducted in 1997 and 1998 to examine the relationship between the optical properties of seawater and related biological and chemical properties across the coastal-to-open ocean gradient in various European seas. A total of 379 stations were visited along the coasts of the Gulf of Lion in the Mediterranean Sea (n = 61), Adriatic Sea (n = 39), Baltic Sea (n = 57), North Sea (n = 99), English Channel (n = 85) and Atlantic Ocean (n = 38). Particular emphasis was dedicated to the collection of a comprehensive set of apparent (AOPs) and inherent (IOPs) optical properties to support the development of ocean color remote sensing algorithms. The data were collected in situ using traditional ship-based sampling, but also from a helicopter, which is a very efficient means for that type of coastal sampling. The dataset collected during the COASTlOOC campaigns is unique in that it is fully consistent in terms of operators, protocols, and instrumentation. This rich and historical dataset is still today frequently requested and used by other researchers. Therefore, we present the result of an effort to compile and standardize a dataset which will facilitate its use in future development and evaluation of new bio-optical models adapted for optically-complex waters.
-
This product displays for Tributyltin, positions with values counts that have been measured per matrix and are present in EMODnet regional contaminants aggregated datasets, v2022. The product displays positions for all available years.
-
This product displays for Lead, positions with values counts that have been measured per matrix for each year and are present in EMODnet regional contaminants aggregated datasets, v2024. The product displays positions for every available year.
-
This product displays for Fluoranthene, positions with values counts that have been measured per matrix and are present in EMODnet regional contaminants aggregated datasets, v2024. The product displays positions for all available years.
-

This product displays for Tributyltin, positions with values counts that have been measured per matrix and are present in EMODnet regional contaminants aggregated datasets, v2024. The product displays positions for all available years.