 Catalogue PIGMA
Physical oceanography
Type of resources
Available actions
Topics
Keywords
Contact for the resource
Provided by
Years
Formats
-
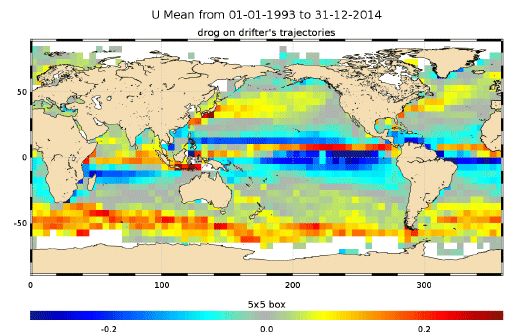
The In Situ delayed mode product designed for reanalysis purposes integrates the best available version of in situ data for ocean surface currents. The data are collected from the Surface Drifter Data Assembly Centre (SD-DAC at NOAA AOML). All surface drifters data have been processed to check for drogue loss. Drogued and undrogued drifting buoy surface ocean currents are provided with a drogue presence flag as well as a wind slippage correction for undrogued buoys. Altimeter and wind data have been used to extract the direct wind slippage from the total drifting buoy velocities. This product is designed to be assimilated into or for validation purposes of operational models operated by ocean forecasting centers for reanalysis purposes or for research community. These users need data aggregated and quality controlled in a reliable and documented manner.
-
Observations of Sea surface temperature and salinity are now obtained from voluntary sailing ships using medium or small size sensors. They complement the networks installed on research vessels or commercial ships. The delayed mode dataset proposed here is upgraded annually as a contribution to GOSUD (http://www.gosud.org )
-
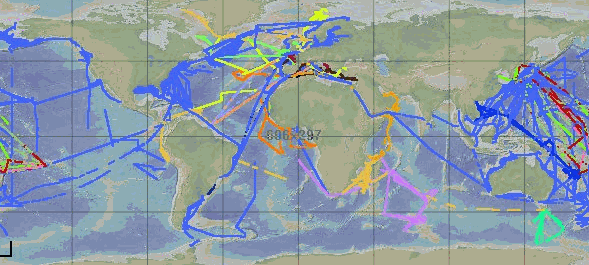
GOSUD aims at assembling in-situ observations of the world ocean surface collected by a variety of ships and at distributing quality controlled datasets. At present time the variables considered by GOSUD are temperature and salinity. The GOSUD data are mostly collected using thermosalinographs (TSG) installed on research vessels, on commercial ships and in some cases on sailing exploration ships GOSUD manages both near-real time data and delayed mode (reprocessed) data.
-
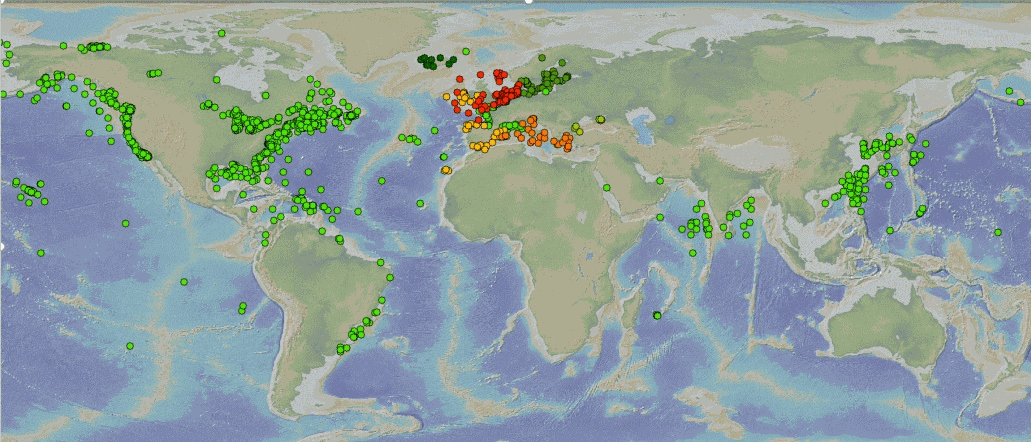
This product integrates observations aggregated and validated from the Regional EuroGOOS consortium (Arctic-ROOS, BOOS, NOOS, IBI-ROOS, MONGOOS and Black Sea GOOS) as well as from National Data Centers (NODCs) and JCOMM global systems (Argo, GOSUD, OceanSITES, GTSPP, DBCP) and the Global telecommunication system (GTS) used by the Met Offices. Data are available in a dedicated directory to waves (INSITU_GLO_WAV_REP_OBSERVATIONS_013_045) of GLOBAL Distribution Unit in one file per platform. This directory is updated twice a year. Data are distributed in two datasets, one with original time sampling and the other with hourly data and rounded timestamps. The information distributed includes wave parameters and wave spectral information. The latest version of Copernicus delayed-mode wave product is distributed from Copernicus Marine catalogue. Additional credits: The American wave data are collected from US NDBC (National Data Buoy Center). The Australian wave data are collected from Integrated Marine Observing System (IMOS); IMOS is enabled by the National Collaborative Research Infrastructure Strategy (NCRIS); It is operated by a consortium of institutions as an unincorporated joint venture, with the University of Tasmania as Lead Agent. The Canadian data are collected from Fisheries and Oceans Canada.
-
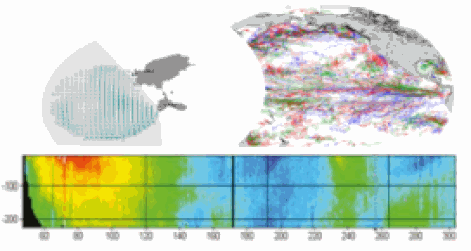
This delayed mode product designed for reanalysis purposes integrates the best available version of in situ data for ocean surface currents and current vertical profiles. It concerns three delayed time datasets dedicated to near-surface currents measurements coming from three platforms (Lagrangian surface drifters, High Frequency radars and Argo floats) and velocity profiles within the water column coming from the Acoustic Doppler Current Profiler (ADCP, vessel mounted only). The latest version of Copernicus surface and sub-surface water velocity product is also distributed from Copernicus Marine catalogue.
-
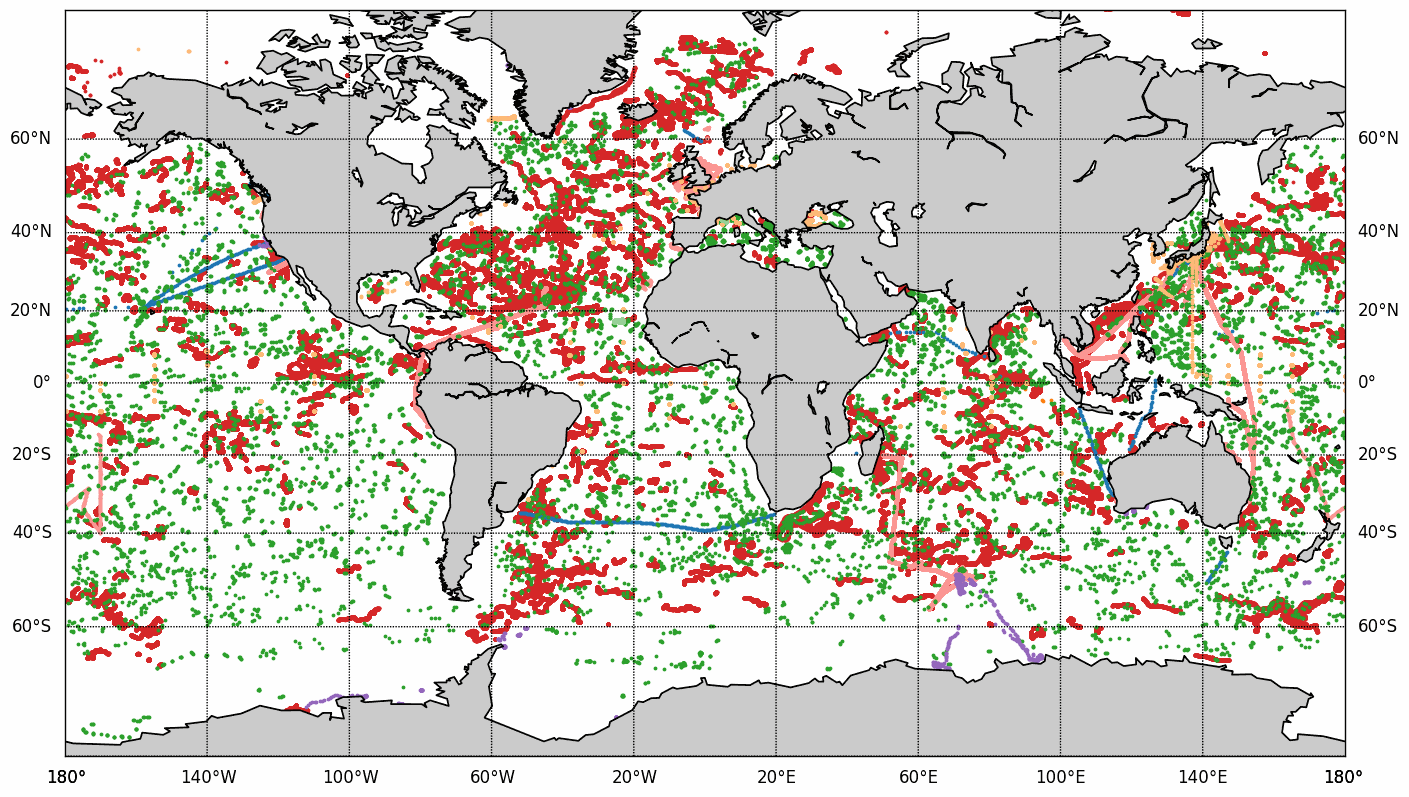
The COriolis Ocean Dataset for Reanalysis (hereafter "CORA") product is a global dataset of in situ temperature and salinity measurements. The CORA observations comes from many different sources collected by Coriolis data centre in collaboration with the In Situ Thematic Centre of the Copernicus Marine Service (CMEMS INSTAC). The observation integrated in the CORA product have been acquired both by autonomous platforms (Argo profilers, fixed moorings , gliders , drifters, sea mammals) , research or opportunity vessels (CTDs, XBTs, ferrybox). From the near real time CMEMS In Situ Thematic Centre product validated on a daily and weekly basis for forecasting purposes, a scientifically validated product is created. It s a "reference product" updated on a yearly basis since 2007. This product has been controlled using an objective analysis (statistical tests) method and a visual quality control (QC). This QC procedure has been developed with the main objective to improve the quality of the dataset to the level required by the climate application and the physical ocean re-analysis activities. It provides T and S weekly gridded fields and individual profiles both on their original level with QC flags and interpolated level. The measured parameters, depending on the data source, are : temperature, salinity. The reference level of measurements is immersion (in meters) or pressure (in decibars). CORA contains historical profiles extracted from the EN.4 global T&S dataset, World Ocean Atlas, SeaDataNet, ICES and other data aggregators . The last version of the CORA product are also available freely from the Copernicus WEB site : - Global Ocean- CORA- In-situ Observations Yearly Delivery in Delayed Mode - Global Ocean- Delayed Mode gridded CORA- In-situ Observations objective analysis in Delayed Mode
-
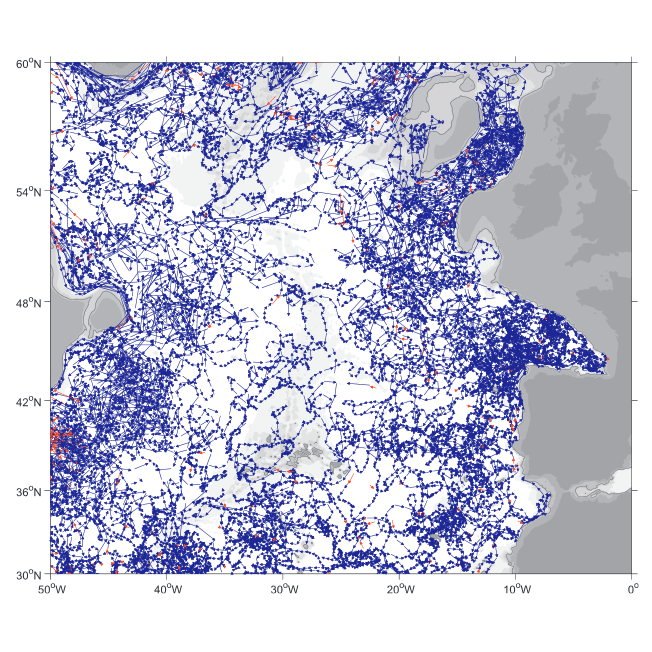
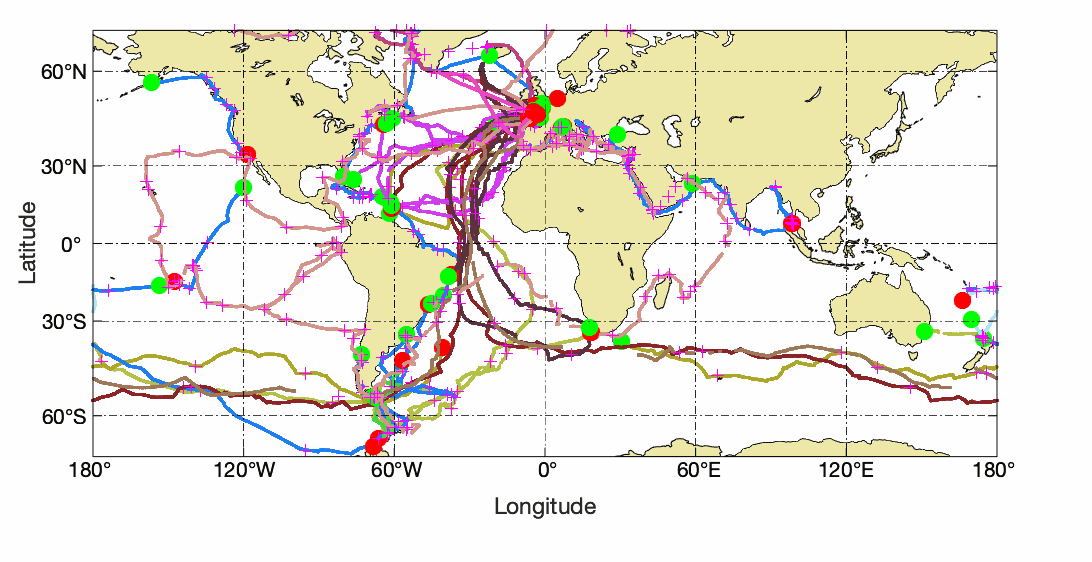
A world deep displacement dataset comprising more than 1600 000 Argo floats deep displacements, has been produced from the global Argo float database (GDAC). ANDRO dataset was completed over the period 2000-2009, then was partially but yearly updated since 2010. ANDRO actual contents and format is described in the user guide, which must be carefully read before using ANDRO (ANDRO format is also described in Ollitrault M. et al (2013)). One important feature of ANDRO is that the pressures measured during float drifts at depth, and suitably averaged are preserved in ANDRO (see Figure 2). To reach this goal, it was necessary to reprocess most of the Argo raw data, because of the many different decoding versions (roughly 100) not always applied by the DACs to the displacement data because they were mainly interested in the p,t,S profiles. The result of our work was the production of comprehensive files, named DEP (for déplacements in French), containing all the possibly retrievable float data. For detailed information and status of the last released ANDRO product, please visit the dedicated Argo France web page: https://www.umr-lops.fr/SNO-Argo/Products/ANDRO-Argo-floats-displacements-Atlas
-
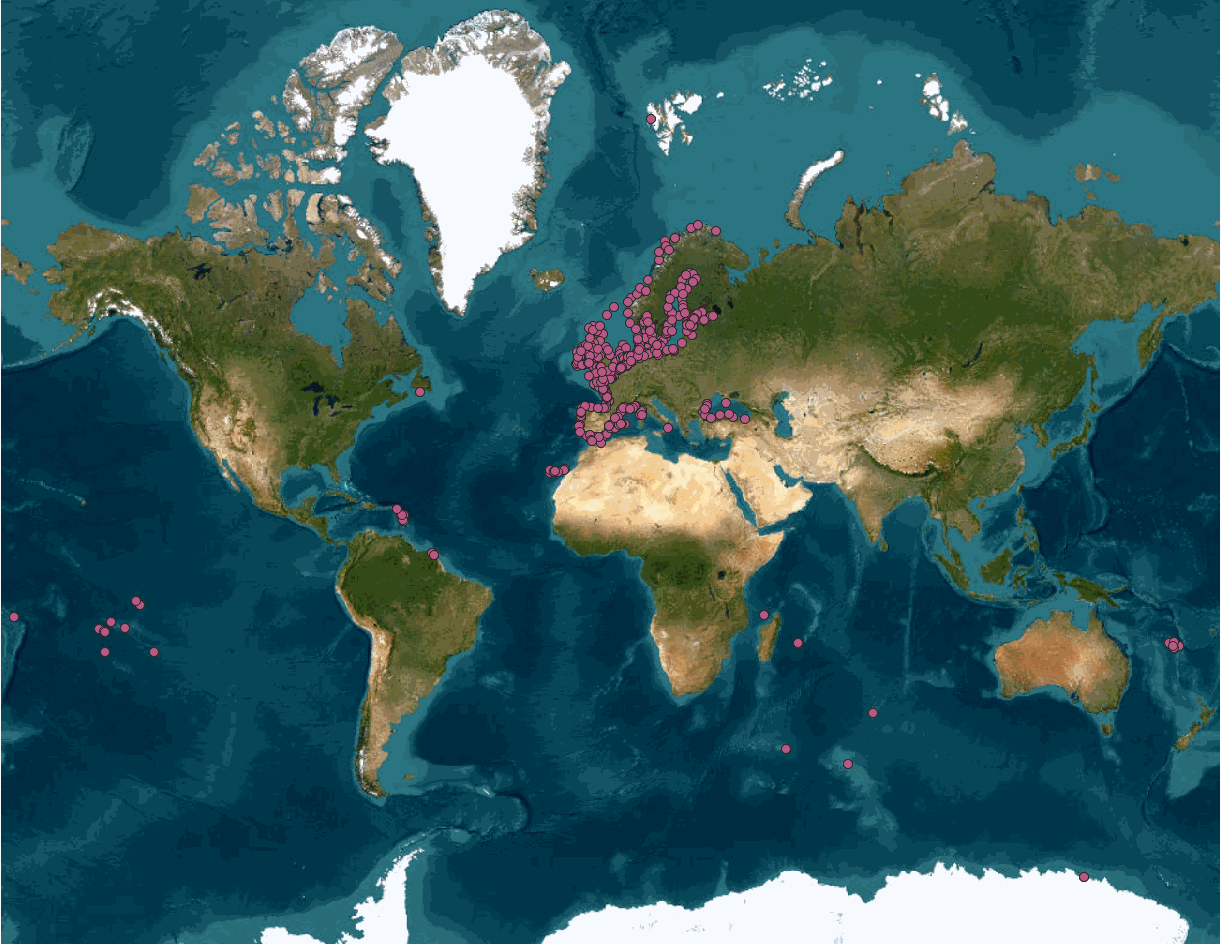
This product integrates sea level observations aggregated and validated from the Regional EuroGOOS consortium (Arctic-ROOS, BOOS, NOOS, IBI-ROOS, MONGOOS) and Black Sea GOOS as well as from the Global telecommunication system (GTS) used by the Met Offices. The latest version of Copernicus delayed-mode Sea level product is also distributed from Copernicus Marine catalogue.
-

LOCEAN has been in charge of collecting sea water for the analysis of water isotopes on a series of cruises or ships of opportunity mostly in the equatorial Atlantic, in the North Atlantic, in the southern Indian Ocean, in the southern Seas, Nordic Seas, and in the Arctic. The LOCEAN data set of the oxygen and hydrogen isotope (δ18O and δD) of marine water covers the period 1998 to 2019, but the effort is ongoing. Most data prior to 2010 (only δ18O) were analyzed using isotope ratio mass spectrometry (Isoprime IRMS) coupled with a Multiprep system (dual inlet method), whereas most data since 2010 (and a few earlier data) were obtained by cavity ring down spectrometry (CRDS) on a Picarro CRDS L2130-I, or less commonly on a Picarro CRDS L2120-I. Occasionally, some data were also run by Marion Benetti on an Isoprime IRMS coupled to a GasBench (dual inlet method) at the university of Iceland (Reykjavik). On the LOCEAN Picarro CRDS, most samples were initially analyzed after distillation, but since 2016, they have often been analyzed using a wire mesh to limit the spreading of sea salt in the vaporizer. Some of the samples on the CRDS were analyzed more than once on different days, when repeatability for the same sample was not sufficient or the daily run presented a too large drift. Accuracy is best when samples are distilled, and for δD are better on the Picarro CRDS L2130-I than on the Picarro CRDS L2120-I. Usually, we found that the reproducibility of the δ18O measurements is within ± 0.05 ‰ and of the δD measurements within ± 0.30 ‰, which should be considered an upper estimate of the error on the measurement on a Picarro CRDS. The water samples were kept in darkened glass bottles (20 to 50 ml) with special caps, and were often (but not always) taped afterwards. Once brought back in Paris, the samples were often stored in a cold room (with temperature close to 4°C), in particular if they were not analyzed within the next three months. There is however the possibility that some samples have breathed during storage. We found it happening on a number of samples, more commonly when they were stored for more than 5 years before being analyzed. We also used during one cruise bottles with not well-sealed caps (M/V Nuka Arctica in April 2019), which were analyzed within 3 months, but for which close to one third of the samples had breathed. We have retained those analyses, but added a flag ‘3’ meaning probably bad, at least on d-excess (outside of regions where sea ice forms or melts, for the analyses done on the Picarro CRDS, excessive evaporation is usually found with a d-excess criterium (which tends to be too low); for the IRMS analyses, it is mostly based when excessive scatter is found in the S- δ18O scatter plots or between successive data, in which case some outliers were flagged at ‘3’). In some cases when breathing happened, we found that d-excess can be used to produce a corrected estimate of δ18O and δD (Benetti et al., 2016). When this method was used a flag ‘1’ is added, indicating ‘probably good’ data, and should be thought as not as accurate as the data with no ‘correction’, which are flagged ‘2’ or ‘0’. We have adjusted data to be on an absolute fresh-water scale based on the study of Benetti et al. (2017), and on further tests with the different wire meshes used more recently. We have also checked the consistency of the runs in time, as there could have been changes in the internal standards used. On the Isoprime IRMS, it was mostly done using different batches of ‘Eau de Paris’ (EDP), whereas on the Picarro CRDS, we used three internal standards kept in metal tanks with a slight overpressure of dry air). The internal standards have been calibrated using VSMOW and GISP, and were also sent to other laboratories to evaluate whether they had drifted since the date of creation (as individual sub-standards have typically stored for more than 5-years). These comparisons are still not fully statisfactory to evaluate possible drifts in the sub-standards. Version V5 contains only one global file (ALL-Wisotopes-V5). However, up to version V4, individual files corresponded to regional subsets : - SO: Southern Ocean including cruise station and surface data mostly from 2017 in the Weddell Sea (WAPITI Cruise JR160004, DOI:10.17882/54012), as well as in the southern Ocean south of 20°S - SI: OISO cruise station and surface data in the southern Indian Ocean (since 1998) (DOI:10.18142/228) - EA: 20°N-20°S cruise station and surface data (since 2005), in particular in the equatorial Atlantic from French PIRATA (DOI:10.18142/14) and EGEE cruises (DOI:10.18142/95) - NA: 20°N-72°N station and surface data, mostly in the North Atlantic from Oceanographic cruises as well as from ships of opportunity (this includes in particular OVIDE cruise data since 2002 (DOI:10.17882/46448), CATARINA, BOCATS1 and BOCATS2 (PID2019-104279GB-C21/AEI/10.13039/501100011033) cruises funded by the Spanish Research Agency, RREX2017 2017 cruise data (DOI:10.17600/17001400), SURATLANT data set since 2011 (DOI:10.17882/54517), Nuka Arctica and Tukuma Arctica data since 2012, STRASSE (DOI:10.17600/12040060) and MIDAS cruise data in 2012-2013, as well as surface data from various ships of opportunity since 2012) - NS: Nordic Sea data from cruises in 2002-2018 - AS: Arctic Ocean north of 72°N, in particular from two Tara cruises (in 2006-2008 and 2013) and expeditions since 2020 - PM: miscellaneous data in tropical Pacific, Indian Ocean, Mediterranean Sea and Black Sea In some regions, such as in the Indian Ocean, it is valuable to combine different subsets to have the full data distribution. The files are in csv format reported, and starting with version V1, it is reported as: - Cruise name, station id, bottle number, day, month, year, hour, minute, latitude, longitude, pressure (db), temperature (°C), it, salinity (pss-78), is, dissolved oxygen (micromol/kg), io2, δ18O, iO, d D, iD, d-excess, id, method type * - Temperature is an in situ temperature - Salinity is a practical salinity it, is, io2, iO, iD, id are quality indices equal to: - 0 no quality check (but presumably good data) - 1 probably good data - 2 good data - 3 probably bad data - 4 certainly bad data - 9 missing data (and the missing data are reported with an unlikely missing value) The method type is 1 for IRMS measurements, 2 for CRDS measurement of a saline water sample, 3 for CRDS measurement of a distilled water sample. * : in addition, starting at version V6, after method type are added : - non-adjusted (original) δ18O and δD when available (when not available, values -99.99 are reported) - An approximate sample measurement date (day, month, year) The day is usually set to 15. In many cases, sets of samples are measured in batches, i.e. from a cruise. Individual samples are often measured more than once, and at different times. The date reported is mostly indicative of when the last measurements are done on a specific set of data. In some subsets, it is very approximative.
-
The general objective of the PEACETIME cruise is to study the fundamental processes and their interactions at the ocean-atmosphere interface, occurring after atmospheric deposition (especially Saharan dust) in the Mediterranean Sea, and how these processes impact the functioning of the pelagic ecosystem. During the proposed 33 days cruise in the western and central Mediterranean Sea in May 2017, we will study the impact of atmospheric deposition on the cycles of chemical elements, on marine biogeochemical processes and fluxes, on marine aerosols emission and how ongoing changes will impact the functioning of Mediterranean Sea communities in the future. The cruise is designed to explore a variety of oligotrophic regimes. Combining in situ observations both in the atmosphere and the ocean, and in situ and minicosm-based on-board process studies, the 40 embarking scientists from atmosphere and ocean sciences will characterize the chemical, biological and physical/optical properties of both the atmosphere and the sea-surface microlayer, mixed layer and deeper waters. The PEACETIME strategy (season and cruise track) associated to a combination of dust transport forecasting tools and near real-time satellite remote sensing is designed to maximize the probability to catch a Saharan dust deposition event in a stratified water column in order to follow the associated processes in-situ. This coordinated multidisciplinary effort will allow us to fill the current weaknesses/lacks in our knowledge of atmospheric deposition impact in the ocean and feedbacks to the atmosphere in such oligotrophic systems. As a key joint-project between MERMEX and CHARMEX : The PEACETIME project comes in the scope of the regional multidisciplinaryprogramme MISTRALS (Mediterranean Integrated STudies at Regional And Local Scales ), which aims at predicting the evolution of this region following strong expected changes in climate and human pressures. In this framework, the PEACETIME project constitutes a key joint project between the ChArMEx (the Chemistry-Aerosol Mediterranean Experiment) and MERMEx (Marine Ecosystems Response in the Mediterranean Experiment) initiatives, enabling to gather communities of atmospheric chemists and marine biogeochemists around the common question of assessing the impact of atmospheric deposition on the marine biogeochemical processes and air-sea exchanges.