 Catalogue PIGMA
/Biological oceanography/Zooplankton
Type of resources
Available actions
Topics
Keywords
Contact for the resource
Provided by
Years
Formats
Representation types
Update frequencies
status
-
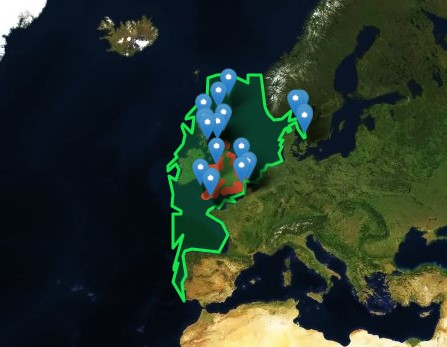
Excel file containing CPR data from Standard Areas B4,C3,C4,D3,D4,D5,E4,F4 for the plankton Calanus finmarchicus and helgolandicus, total traverse (small) copepods, total large copepods, Phytoplankton Colour Index and Cnidaria (presence denoted by a 1, absence by a zero). All taxa are from 1980, except Cnidaria which are from 2011. Dataset is in the format of sample level data, with each row being a discrete sample, with a sample being 3m3 filtered seawater, and 10nm of tow. For each row, a sample has the following information, starting at column a: Standard area of sample, sample id, latitude (decimal degrees) of sample mid point, longitude (decimal degrees) of sample midpoint, sample midpoint date and local time, year of sample, month of sample, then plankton abundance values (or PCI index or cnidaria presence/absence). All taxa have been looked for during the period this dataset spans, so zero values represent true absence.
-
Accredited through the MEDIN partnership, and core-funded by the Department for the Environment, Food and Rural Affairs (Defra) and the Scottish Government, DASSH provides tools and services for the long-term curation, management and publication of marine species and habitats data, within the UK and internationally. Working closely with partners and data providers we are committed to the FAIR Data Principles, to make marine biodiversity data Findable, Accessible, Interoperable and Reusable. DASSH is a flagship initiative of the Marine Biological Association (MBA), and builds on the MBA's historic role in marine science. Through partnerships with other UK and European data centres DASSH contributes to data portals including the NBN Atlas, EMODnet, EurOBIS and GBIF. Fill out a form into the website to generate monthly lifeform abundances from the selected dataset.
-
The Continuous Plankton Recorder (CPR) Survey is the most geographically extensive marine monitoring programme in the world. Today the Survey is operated by the Marine Biological Association, based in Plymouth, UK. Operating since 1931, the Continuous Plankton Recorder (CPR) survey is recognised as the longest sustained and geographically most extensive marine biological survey in the world. The dataset comprises a uniquely large record of marine biodiversity covering ~800 taxa over multi-decadal periods. In terms of our scientific understanding of natural variability and human-induced change on our oceans, the CPR survey is of global importance and it is used by scientists, policy makers and environmental managers across the world. The data is used to examine strategically important science pillars such as climate change, human health, fisheries, biodiversity, pathogens, invasive species, ocean acidification and natural capital. The results have included the globally first documented studies of large-scale ecological regime shifts, and of biogeographic, phenological and trans-arctic migrations in the marine environment in response to climate change. The data in this sampling event resource has been published as a Darwin Core Archive (DwC-A), which is a standardized format for sharing biodiversity data as a set of one or more data tables. The core data table contains 252,385 records. 2 extension data tables also exist. An extension record supplies extra information about a core record. The number of records in each extension data table is illustrated below.
-

The Continuous Plankton Recorder (CPR) is a marine sampler that is towed behind volunteer ships of opportunity at speeds of up to ∼20 knots and samples at a depth of ∼7 m below the surface. Plankton have been sampled on routes crossing the North Atlantic and NW European shelf seas using a consistent methodology since 1958. Plankton species abundance counts are included here from 1960-2019. The CPR unit is a metal casing in the shape of a ∼1 m torpedo that houses a roll of silk which automatically rotates using a geared propeller system. The seawater enters the front aperture where plankton and small particles are captured onto the rotating silk, which has a mesh size of 270 µm. This silk is stored in 4 % buffered formalin to preserve the sample until microscopic analysis at the laboratory in Plymouth. The silk is cut into pre-defined sections that represent one sample and equate to 10 nautical miles of tow. Phytoplankton and zooplankton are identified and counted at different stages of the microscopic analysis: semi-quantitative count of phytoplankton across 20 fields of view per sample, quantitative count of all zooplankton >= 2 mm (these are picked off the silk for identification), and semi-quantitative traverse count of all zooplankton 2 mm. For a more in-depth description of the sampling methodology please refer to Richardson et al. (2006). Ostle, C., et al. The Plankton Lifeform Extraction Tool: A digital tool to increase the discoverability and usability of plankton time-series data, Earth Syst. Sci. Data Discuss. https://doi.org/10.5194/essd-2021-171, 2021. The Phytoplankton Colour Index is a record of the colour gradient of the mesh as one of 4 colour categories (0,1,2,6.5) and has been shown to relate to the chlorophyll content of the water, including organisms not visible in the sample (Raitsos et al., 2013, Raitsos, D.E., Walne, A., Lavender, S.J., Licandro, P., Reid, P.C., and Edwards, M. 2013. A 60-year ocean colour data set from the Continuous Plankton Recorder. Journal of Plankton Research, 35(1): 158–164).
-

'''Short description:''' The Low and Mid-Trophic Levels (LMTL) reanalysis for global ocean is produced at [https://www.cls.fr CLS] on behalf of Global Ocean Marine Forecasting Center. It provides 2D fields of biomass content of zooplankton and six functional groups of micronekton. It uses the LMTL component of SEAPODYM dynamical population model (http://www.seapodym.eu). No data assimilation has been done. This product also contains forcing data: net primary production, euphotic depth, depth of each pelagic layers zooplankton and micronekton inhabit, average temperature and currents over pelagic layers. '''Forcings sources:''' * Ocean currents and temperature (CMEMS multiyear product) * Net Primary Production computed from chlorophyll a, Sea Surface Temperature and Photosynthetically Active Radiation observations (chlorophyll from CMEMS multiyear product, SST from NOAA NCEI AVHRR-only Reynolds, PAR from INTERIM) and relaxed by model outputs at high latitudes (CMEMS biogeochemistry multiyear product) '''Vertical coverage:''' * Epipelagic layer * Upper mesopelagic layer * Lower mesopelagic layer (max. 1000m) '''DOI (product) :''' https://doi.org/10.48670/moi-00020