 Catalogue PIGMA
Tool
Type of resources
Available actions
Topics
Keywords
Contact for the resource
Provided by
Years
Representation types
Resolution
-
The mission for this tool, as well as its overriding goal, is "Solving problems in capture fisheries and aquaculture using GIS, remote sensing and mapping". Specifically, the objectives of GISFish are to: - Improve the sustainability of aquaculture and capture fisheries by promoting the use of GIS, remote sensing and mapping; - Facilitate the use of GIS, remote sensing, and mapping through easy access to comprehensive information on applications and training opportunities. The Fisheries and Aquaculture Management Division at FAO is actively promoting the use of spatial analytical tools and geo-referenced information for the analysis of Fisheries and Aquaculture data and in the development of Fisheries and Aquaculture management. GISFish is a "one stop" site from which to obtain the global experience on Geographic Information Systems (GIS), Remote Sensing and Mapping as applied to Fisheries and Aquaculture. GISFish sets out the issues in Fisheries and Aquaculture, and demonstrates the benefits of using GIS, remote sensing and mapping to resolve them. The global experience provided by GISFish is captured in Issues, Publications, Activities, Training, Data and Tools, Contacts,Discussions, News and events. GISFish is broadly divided into two domains, GISFish Aquaculture and GISFish Capture Fisheries with a wide range of material and information that is shared between the two domains to address the role of GIS to support the Ecosystem Approach to Fisheries (EAF) and the Ecosystem Approach to Aquaculture (EAF).
-

rgbif is an R package from rOpenSci that allows searching and retrieving data from GBIF. rgbif wraps R code around the GBIF API to allow you to talk to GBIF from R and access metadata, species names, and occurrences. rgbif allows you to easily: - get data for single occurrences - retrieve multiple occurences - search for taxon names - generate maps of occurences
-
Google Earth Engine combines a multi-petabyte catalog of satellite imagery and geospatial datasets with planetary-scale analysis capabilities. Scientists, researchers, and developers use Earth Engine to detect changes, map trends, and quantify differences on the Earth's surface. Earth Engine is now available for commercial use, and remains free for academic and research use.
-
The indiSeaS project is co-funded by the Intergovernmental Oceanographic Commission (IOC), the European Network of Excellence Euroceans, “'Institut de recherche pour le développement (IRD)” and the European project on Marine Ecosystem Evolution in a Changing Environment (MEECE). It is a multi-institutes collaborative effort. Scientific experts on ecosystems all over world calculate indicators and provide background information. The IndiSeas project aims at "Evaluating the status of marine ecosystems in a changing world”, using a set of different types of indicators to reflect the effects of multiple drivers on the states and trends of marine exploited ecosystems. It focuses on the effects of fishing, use of ecology, biodiversity, as well as climate and socio-economic indicators on world's marine ecosystems health. The objectives are to review IndiSeas datasets, present preliminary results to regional experts, discuss methods to be developed in each of the six task groups, establish work and publication plans for the future. Expertise from over 70 scientists, 49 research institutes and 36 countries.
-
Quonops Online Services provide noise monitoring and prediction tools. In a similar manner to weather forecasting systems, Quonops© produces an estimate of the spatio-temporal distribution of noise levels generated by human activities at sea, aggregating multiple sources, and assessing short-, mid- and long-term source contributions to the global noise field. The outputs from Quonops© are tailored to the requirements of existing and emerging national and international regulations regarding: - Underwater noise. - The conservation of habitats and marine ecosystems. - The protection of marine species. Such tools aim to support management decisions by assessing, quantifying and prioritizing direct and indirect anthropogenic pressures on marine life, according to regulations on underwater noise, especially the descriptor 11 of the European Marine Strategy Framework Directive.
-

Blue-Cloud 2026 is a collaborative project that leverages Europe's expertise in aquatic environmental observation and data handling. Building on existing infrastructures like Copernicus and EMODnet, Blue-Cloud aims to create a federated ecosystem for FAIR and open data in marine research. Through a web-based platform, it offers simplified access to multidisciplinary datasets, analytical services, and computing facilities. Over 42 months, Blue-Cloud 2026 will expand its core services, integrate more analytical tools, and enhance data discovery and access. With a focus on supporting the EU Blue Economy and environmental agendas, it strives to contribute to the EU Green Deal and UN Sustainable Development Goals. Coordinated by CNR, Trust-IT Services, and MARIS, the project brings together a dedicated team of 40 partners from 13 EU countries.
-
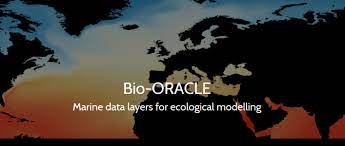
The availability of user-friendly, high-resolution global environmental datasets is crucial for bioclimatic modelling. For terrestrial environments, WorldClim has served this purpose since 2005, but equivalent marine data only became available in 2012, with pioneer initiatives like Bio-ORACLE providing data layers for several ecologically relevant variables. Currently, the available marine data packages have not yet been updated to the most recent Intergovernmental Panel on Climate Change (IPCC) predictions nor to present times, and are mostly restricted to the top surface layer of the oceans, precluding the modelling of a large fraction of the benthic diversity that inhabits deeper habitats. To address this gap, we present a significant update of Bio-ORACLE for new future climate scenarios, present-day conditions and benthic layers (near sea bottom). The reliability of data layers was assessed using a cross-validation framework against in situ quality-controlled data. This test showed a generally good agreement between our data layers and the global climatic patterns. We also provide a package of functions in the R software environment (sdmpredictors) to facilitate listing, extraction and management of data layers and allow easy integration with the available pipelines for bioclimatic modelling.
-
The code and files contained in this repository support replication of a broad-scale benthic habitat classification of the South Atlantic produced by McQuaid et al. (2023). We used statistical clustering algorithms to classify broad-scale (10km2) environmental data into distinct habitat classes, which reflect variation in physical conditions and we assume support distinct biological communities. We request that any use of the input data is referenced as per the table below, and that classification outputs are referenced as: McQuaid K. A. Bridges A. E. H., Howell K. L., Gandra T. B. R., de Souza V., Currie J. C., Hogg O. T., Pearman T. R. R., Bell J. B. B., Atkinson L. J., Baum D., Bonetti J., Carranza A., Defeo O., Furey T., Gasalla M. A., Golding N, Hampton S. L., Horta S., Jones D. O. B., Lombard A. T., Manca E., Marin Y., Martin S., Mortensen P., Passdore C., Piechaud N., Sink K. J. & Yool A. 2023. Broad-scale benthic habitat classification of the South Atlantic. Progress in Oceanography. DOI: https://doi.org/10.1016/j.pocean.2023.103016
-
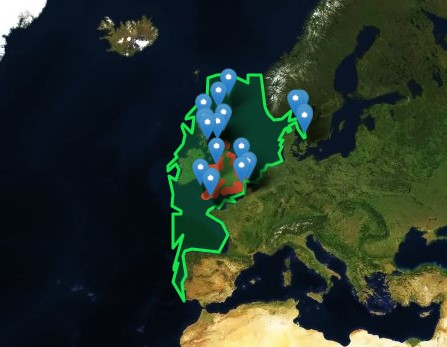
Accredited through the MEDIN partnership, and core-funded by the Department for the Environment, Food and Rural Affairs (Defra) and the Scottish Government, DASSH provides tools and services for the long-term curation, management and publication of marine species and habitats data, within the UK and internationally. Working closely with partners and data providers we are committed to the FAIR Data Principles, to make marine biodiversity data Findable, Accessible, Interoperable and Reusable. DASSH is a flagship initiative of the Marine Biological Association (MBA), and builds on the MBA's historic role in marine science. Through partnerships with other UK and European data centres DASSH contributes to data portals including the NBN Atlas, EMODnet, EurOBIS and GBIF. Fill out a form into the website to generate monthly lifeform abundances from the selected dataset.
-

The Sea Around Us is a research initiative at The University of British Columbia (located at the Institute for the Oceans and Fisheries, formerly Fisheries Centre) that assesses the impact of fisheries on the marine ecosystems of the world, and offers mitigating solutions to a range of stakeholders. The Sea Around Us was initiated in collaboration with The Pew Charitable Trusts in 1999, and in 2014, the Sea Around Us also began a collaboration with The Paul G. Allen Family Foundation to provide African and Asian countries with more accurate and comprehensive fisheries data. It provides data and analyses through View Data, articles in peer-reviewed journals, and other media (News). We regularly update our products at the scale of countries’ Exclusive Economic Zones, Large Marine Ecosystems, the High Seas and other spatial scales, and as global maps and summaries. It emphasises catch time series starting in 1950, and related series (e.g., landed value and catch by flag state, fishing sector and catch type), and fisheries-related information on every maritime country (e.g., government subsidies, marine biodiversity). Information is also offered on sub-projects, e.g., the historic expansion of fisheries, the performance of Regional Fisheries Management Organizations, or the likely impact of climate change on fisheries. The information and data presented on this website is freely available to any user, granted that its source is acknowledged. We are aware that this information may be incomplete. Please let us know about this via the feedback options available on this website.